Wazuh
Wazuh is the open source security platform that unifies XDR and SIEM protection for endpoints and cloud workloads. It is designed to help organisations detect threats, monitor integrity, and ensure compliance across their infrastructure, including physical, virtual, containerised, and cloud environments.
Lab Setup for Proof of Concept
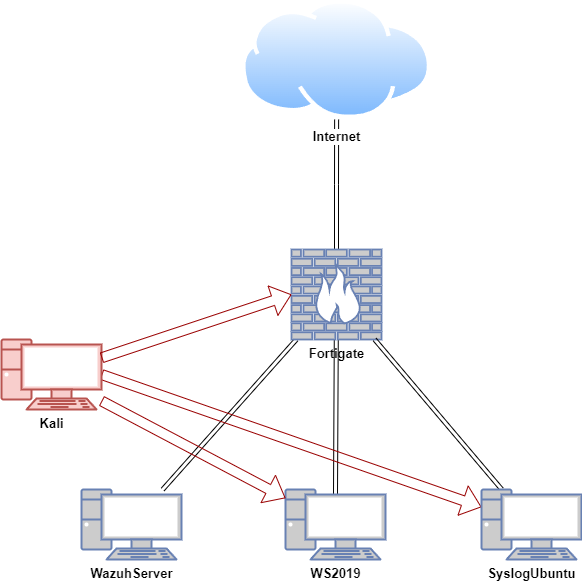
In this proof of concept, attack emulation was conducted on the FortiGate VM, Windows and Ubuntu hosts in a safe and controlled setting.
Note: Do not attempt to replicate the attack emulation demonstrated here unless you are properly trained and it is safe to do so. Unauthorised attack emulation can lead to legal consequences and unintended damage to systems. Always ensure that such activities are conducted by qualified professionals in a secure, isolated environment.
| Host | OS | Role | IP Address |
|---|---|---|---|
| Fortigate | Fortios 7.6.0 | Firewall/Router | 192.168.1.111 (WAN) / 10.0.0.1 (LAN) |
| WazuhServer | Centos Stream 9 | Wazuh server | 10.0.0.20 |
| WS2019 | Windows Server 2019 | Wazuh agent | 10.0.0.24 |
| SyslogUbuntu | Ubuntu 22.04 LTS | Wazuh agent, rsyslog server | 10.0.0.26 |
| Kali | Kali Linux 2024.2 | Attacker machine | 192.168.1.161, 10.0.0.29 |
Install Wazuh Server offline
To install Wazuh offline, first download its core components for later installation on a system without Internet access. You can set up the Wazuh server, indexer, and dashboard on a single host (all-in-one deployment) or install them separately across multiple hosts (distributed deployment), depending on your requirements. See the Wazuh Server requirements for details.
Note: Root user privileges are required to run the following commands.
Prerequisites
Ensure that curl, tar, and setcap are installed on the target system for the offline installation. On some Debian-based systems, gnupg may also be required.
Additionally, some systems have cp set as an alias for cp -i, which prompts for confirmation before overwriting files. To prevent this, run unalias cp.
Configuring Firewall (Optional)
Configure Firewall rule to allow access on required ports
CentOS:
firewall-cmd --zone=public --add-port=9200/tcp --permanent #Wazuh-indexer
firewall-cmd --zone=public --add-port=55000/tcp --permanent #enrollment service
firewall-cmd --zone=public --add-port=1514/tcp --permanent #agent communication
firewall-cmd --zone=public --add-port=1515/tcp --permanent #enrollment service

#Apply changes
firewall-cmd --reload

#Check applied
firewall-cmd --list-all
Ubuntu:
Downloading the Packages and Configuration Files
From any Linux system with Internet access, run the following commands to execute a script that downloads all necessary files for offline installation on x86_64 architectures. Choose the appropriate package format to download.
RPM:
curl -sO https://packages.wazuh.com/4.14/wazuh-install.sh
chmod 744 wazuh-install.sh
./wazuh-install.sh -dw rpm
DEB:
curl -sO https://packages.wazuh.com/4.14/wazuh-install.sh
chmod 744 wazuh-install.sh
./wazuh-install.sh -dw deb
Download the certificates configuration file.
Modify config.yml to set up certificate creation.
- For an all-in-one deployment, replace
"<indexer-node-ip>","<wazuh-manager-ip>", and"<dashboard-node-ip>"with127.0.0.1. - For a distributed deployment, update the node names and IP addresses with the correct values for the Wazuh server, indexer, and dashboard. Add extra node fields as required.
nodes:
  # Wazuh indexer nodes
  indexer:
    - name: node-1
      ip: 10.0.0.20
    #- name: node-2
    #  ip: "<indexer-node-ip>"
    #- name: node-3
    #  ip: "<indexer-node-ip>"

  # Wazuh server nodes
  # If there is more than one Wazuh server
  # node, each one must have a node_type
  server:
    - name: wazuh-1
      ip: 10.0.0.20
    #  node_type: master
    #- name: wazuh-2
    #  ip: "<wazuh-manager-ip>"
    #  node_type: worker
    #- name: wazuh-3
    #  ip: "<wazuh-manager-ip>"
    #  node_type: worker

  # Wazuh dashboard nodes
  dashboard:
    - name: dashboard
      ip: 10.0.0.20
Run the ./wazuh-install.sh -g to generate the certificates. For a multi-node cluster, these certificates need to be later deployed to all Wazuh instances in your cluster.
Transfer the following files to a directory on the host(s) where the offline installation will be performed. You can use scp for this:
wazuh-install.shwazuh-offline.tar.gzwazuh-install-files.tar
Installing Wazuh Components
In the working directory where you placed wazuh-offline.tar.gz and wazuh-install-files.tar, execute the following command to decompress the installation files:
Installing the Wazuh Indexer
RPM:
The following dependencies must be installed on the Wazuh indexer nodes.
- coreutils
rpm --import ./wazuh-offline/wazuh-files/GPG-KEY-WAZUH
rpm -ivh ./wazuh-offline/wazuh-packages/wazuh-indexer*.rpm
DEB:
The following dependencies must be installed on the Wazuh indexer nodes.
- debconf
- adduser
- procps
Run the following commands replacing <indexer-node-name> with the name of the Wazuh indexer node you are configuring as defined in config.yml. For example, node-1. This deploys the SSL certificates to encrypt communications between the Wazuh central components.
On CentOS, if you encounter the error:
Navigate to /etc/wazuh-indexer/certs/ and run chmod 400 * as the root user.
mkdir /etc/wazuh-indexer/certs
mv -n wazuh-install-files/$NODE_NAME.pem /etc/wazuh-indexer/certs/indexer.pem
mv -n wazuh-install-files/$NODE_NAME-key.pem /etc/wazuh-indexer/certs/indexer-key.pem
mv wazuh-install-files/admin-key.pem /etc/wazuh-indexer/certs/
mv wazuh-install-files/admin.pem /etc/wazuh-indexer/certs/
cp wazuh-install-files/root-ca.pem /etc/wazuh-indexer/certs/
chmod 500 /etc/wazuh-indexer/certs
chmod 400 /etc/wazuh-indexer/certs/*
chown -R wazuh-indexer:wazuh-indexer /etc/wazuh-indexer/certs
Move each node’s certificate and key files (e.g., node-1.pem and node-1-key.pem) to their respective certs folder. These files are specific to each node and shouldn’t be shared with others. However, do not move the root-ca.pem certificate—copy it instead, so it can be deployed to other component folders later.
Edit /etc/wazuh-indexer/opensearch.yml and modify the following settings:
network.host– Defines the node’s address for HTTP and transport traffic. It should match the address used inconfig.ymlwhen generating SSL certificates.node.name– Set this to the Wazuh indexer node name as defined inconfig.yml(e.g.,node-1).cluster.initial_master_nodes– List the names of master-eligible nodes, as specified inconfig.yml.
network.host: "10.0.0.20"
node.name: "node-1"
cluster.initial_master_nodes:
- "node-1"
#- "node-2"
#- "node-3"
discovery.seed_hosts– Contains the addresses of master-eligible nodes. Leave it commented for a single-node setup, but for multi-node configurations, uncomment it and specify the node addresses.
plugins.security.nodes_dn– Lists the Distinguished Names (DNs) of certificates for all Wazuh indexer cluster nodes. Uncomment and modify these based on your settings andconfig.yml.
plugins.security.nodes_dn:
- "CN=node-1,OU=Wazuh,O=Wazuh,L=California,C=US"
- "CN=node-2,OU=Wazuh,O=Wazuh,L=California,C=US"
- "CN=node-3,OU=Wazuh,O=Wazuh,L=California,C=US"
Enable and start the Wazuh indexer service. Verify Wazuh indexer is active and running (exit with q)
systemctl daemon-reload
systemctl enable wazuh-indexer
systemctl start wazuh-indexer
systemctl status wazuh-indexer
Once all Wazuh indexer nodes are running, execute the indexer-security-init.sh script on any Wazuh indexer node. This updates the certificate information and initiates the cluster.
Run the following command to check that the installation is successful.
#Example output
{
  "name" : "node-1",
  "cluster_name" : "wazuh-cluster",
  "cluster_uuid" : "6hQpHd5cSzCLrhFo0T-Crg",
  "version" : {
    "number" : "7.10.2",
    "build_type" : "rpm",
    "build_hash" : "eee49cb340edc6c4d489bcd9324dda571fc8dc03",
    "build_date" : "2023-09-20T23:54:29.889267151Z",
    "build_snapshot" : false,
    "lucene_version" : "9.7.0",
    "minimum_wire_compatibility_version" : "7.10.0",
    "minimum_index_compatibility_version" : "7.0.0"
  },
  "tagline" : "The OpenSearch Project: https://opensearch.org/"
}
Installing the Wazuh server
Run the following commands to import the Wazuh key and install the Wazuh manager.
RPM:
rpm --import ./wazuh-offline/wazuh-files/GPG-KEY-WAZUH
rpm -ivh ./wazuh-offline/wazuh-packages/wazuh-manager*.rpm
DEB:
On systems with apt as package manager, the following dependencies must be installed on the Wazuh server nodes.
- gnupg
- apt-transport-https
Store the Wazuh indexer username and password in the Wazuh manager keystore using the wazuh-keystore tool.
Note: The default credentials for an offline installation are admin:admin.
echo '<INDEXER_USERNAME>' | /var/ossec/bin/wazuh-keystore -f indexer -k username
echo '<INDEXER_PASSWORD>' | /var/ossec/bin/wazuh-keystore -f indexer -k password
Enable and start the Wazuh manager service. Verify Wazuh manager is active and running (exit with q)
systemctl daemon-reload
systemctl enable wazuh-manager
systemctl start wazuh-manager
systemctl status wazuh-manager
Installing Filebeat
Filebeat must be installed and configured on the same server as the Wazuh manager. Run the following command to install Filebeat.
RPM:
DEB:
Copy the configuration files to the correct location. When prompted, type "yes" to overwrite /etc/filebeat/filebeat.yml.
Note for CentOS: Remove &&\ from the command.
cp ./wazuh-offline/wazuh-files/filebeat.yml /etc/filebeat/ &&\
cp ./wazuh-offline/wazuh-files/wazuh-template.json /etc/filebeat/ &&\
chmod go+r /etc/filebeat/wazuh-template.json
Edit the /etc/filebeat/filebeat.yml configuration file and replace the following value:
hosts: The list of Wazuh indexer nodes to connect to. You can use either IP addresses or hostnames. By default, the host is set to localhost hosts: ["127.0.0.1:9200"]. Replace it with your Wazuh indexer address accordingly.
If you have more than one Wazuh indexer node, you can separate the addresses using commas. For example, hosts: ["10.0.0.1:9200", "10.0.0.2:9200", "10.0.0.3:9200"]
# Wazuh - Filebeat configuration file
 output.elasticsearch:
 hosts: ["10.0.0.20:9200"]
 protocol: https
 username: ${username}
 password: ${password}
Create a Filebeat keystore to securely store authentication credentials.
Add the username and password admin:admin to the secrets keystore.
echo admin | filebeat keystore add username --stdin --force
echo admin | filebeat keystore add password --stdin --force
Install the Wazuh module for Filebeat.
Replace <SERVER_NODE_NAME> with your Wazuh server node certificate name, the same used in config.yml when creating the certificates. For example, wazuh-1. Then, move the certificates to their corresponding location.
On CentOS, if you encounter the error:
Navigate to /etc/filebeat/certs/ and run chmod 400 * as a root user
mkdir /etc/filebeat/certs
mv -n wazuh-install-files/$NODE_NAME.pem /etc/filebeat/certs/filebeat.pem
mv -n wazuh-install-files/$NODE_NAME-key.pem /etc/filebeat/certs/filebeat-key.pem
cp wazuh-install-files/root-ca.pem /etc/filebeat/certs/
chmod 500 /etc/filebeat/certs
chmod 400 /etc/filebeat/certs/*
chown -R root:root /etc/filebeat/certs
Enable and start the Filebeat service. Verify Filebeat is active and running (exit with q)
systemctl daemon-reload
systemctl enable filebeat
systemctl start filebeat
systemctl status filebeat
Run the following command to make sure Filebeat is successfully installed.
#Example output
elasticsearch: https://10.0.0.20:9200...
  parse url... OK
  connection...
    parse host... OK
    dns lookup... OK
    addresses: 10.0.0.20
    dial up... OK
  TLS...
    security: server's certificate chain verification is enabled
    handshake... OK
    TLS version: TLSv1.3
    dial up... OK
  talk to server... OK
  version: 7.10.2
Wazuh server node is now successfully installed.
Installing the Wazuh Dashboard
RPM:
The following dependencies must be installed on the Wazuh dashboard node.
- libcap
rpm --import ./wazuh-offline/wazuh-files/GPG-KEY-WAZUH
rpm -ivh ./wazuh-offline/wazuh-packages/wazuh-dashboard*.rpm
DEB:
The following dependencies must be installed on the Wazuh dashboard node.
- debhelper version 9 or later
- tar
- curl
- libcap2-bin
Replace <DASHBOARD_NODE_NAME> with your Wazuh dashboard node name, the same used in config.yml to create the certificates. For example, dashboard. Then, move the certificates to their corresponding location.
On CentOS, if you encounter the error:
Navigate to /etc/wazuh-dashboard/certs/ and run chmod 400 * as a root user
mkdir /etc/wazuh-dashboard/certs
mv -n wazuh-install-files/$NODE_NAME.pem /etc/wazuh-dashboard/certs/dashboard.pem
mv -n wazuh-install-files/$NODE_NAME-key.pem /etc/wazuh-dashboard/certs/dashboard-key.pem
cp wazuh-install-files/root-ca.pem /etc/wazuh-dashboard/certs/
chmod 500 /etc/wazuh-dashboard/certs
chmod 400 /etc/wazuh-dashboard/certs/*
chown -R wazuh-dashboard:wazuh-dashboard /etc/wazuh-dashboard/certs
Edit the /etc/wazuh-dashboard/opensearch_dashboards.yml file and replace the following values:
server.host: This setting specifies the host of the back end server. To allow remote users to connect, set the value to the IP address or DNS name of the Wazuh dashboard. The value0.0.0.0will accept all the available IP addresses of the host.opensearch.hosts: The URLs of the Wazuh indexer instances to use for all your queries. The Wazuh dashboard can be configured to connect to multiple Wazuh indexer nodes in the same cluster. The addresses of the nodes can be separated by commas. For example,["https://10.0.0.2:9200", "https://10.0.0.3:9200","https://10.0.0.4:9200"]
server.host: 10.0.0.20
server.port: 443
opensearch.hosts: https://10.0.0.20:9200
opensearch.ssl.verificationMode: certificate
Enable and start the Wazuh dashboard. Verify Wazuh dashboard is active and running (exit with q)
systemctl daemon-reload
systemctl enable wazuh-dashboard
systemctl start wazuh-dashboard
systemctl status wazuh-dashboard
Edit the file /usr/share/wazuh-dashboard/data/wazuh/config/wazuh.yml and replace the url value with the IP address or hostname of the Wazuh server master node.
hosts:
  - default:
      url: https://10.0.0.20
      port: 55000
      username: wazuh-wui
      password: wazuh-wui
      run_as: false
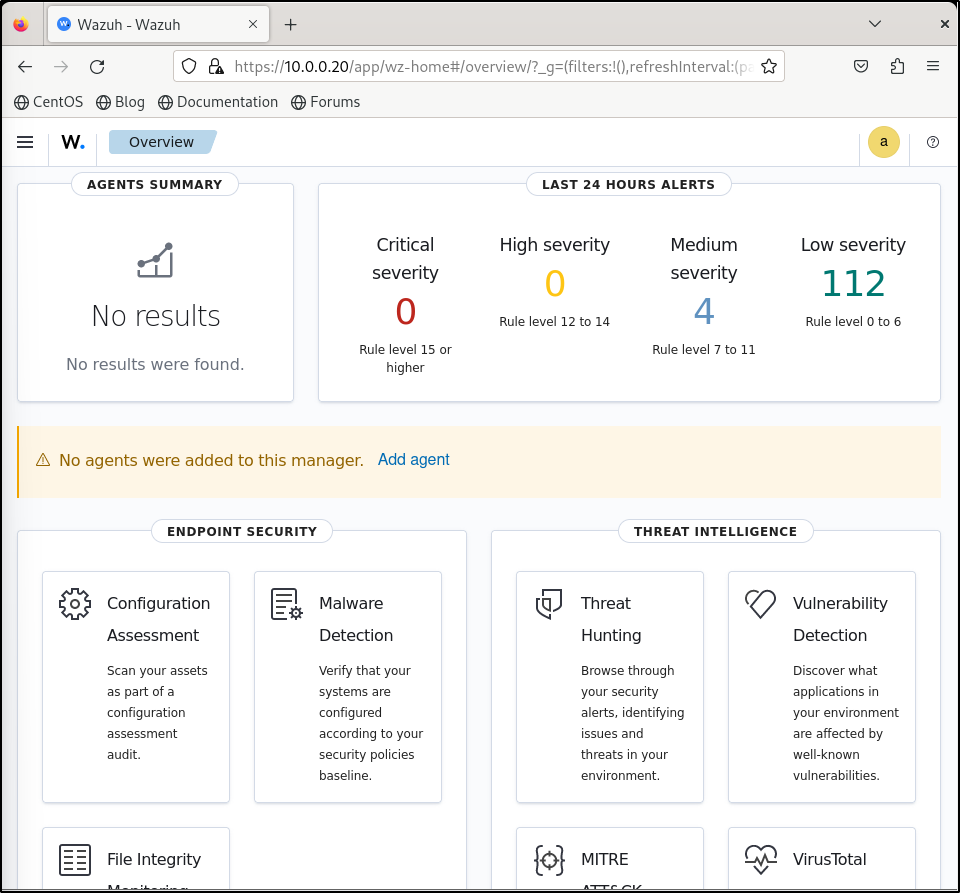
Access the web interface.
- URL: https://
- Username: admin
- Password: admin
Importing Certificate (Optional)
Upon the first access to the Wazuh dashboard, the browser shows a warning message stating that the certificate was not issued by a trusted authority. An exception can be added in the advanced options of the web browser or, for increased security, the root-ca.pem file previously generated can be imported to the certificate manager of the browser.
Copy /etc/wazuh-dashboard/certs/root-ca.pem to user’s home directory
Change ownership of user's home directory to the non-root user to enable read access to root-ca.pem
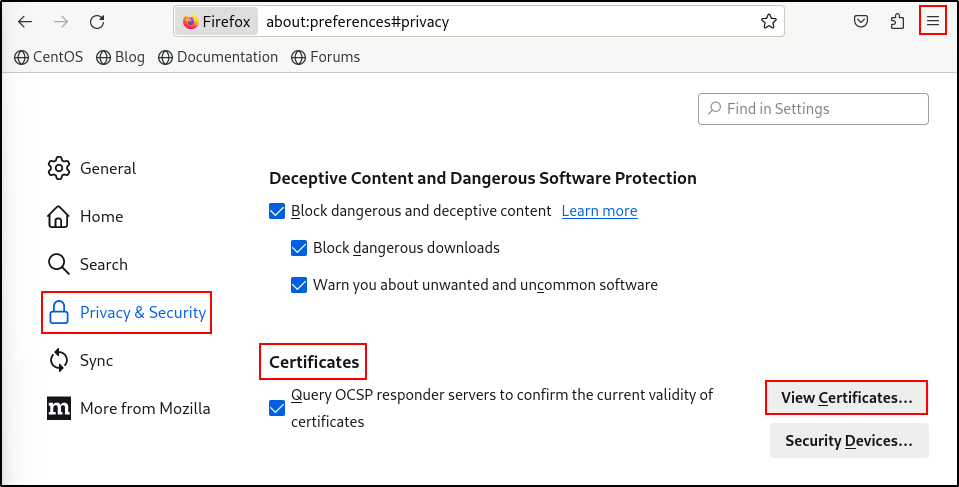
On Firefox, go to Settings, Privacy & Security and Certificates. Click View Certificates.
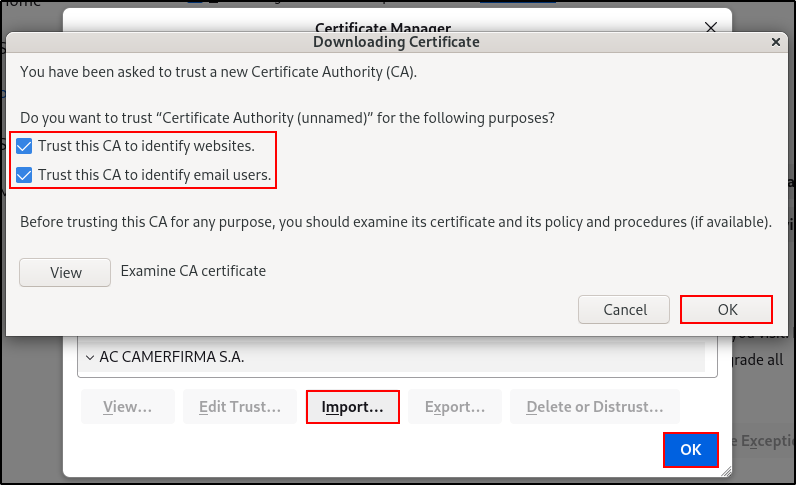
Click Import, select root-ca.pem in user’s home directory. Select Trust this CA to identify website and email users. Click OK.
Delete root-ca.pem from user’s home directory.
Securing Wazuh Installation (Optional)
You have now installed and configured all the Wazuh central components. We recommend changing the default credentials to protect your infrastructure from possible attacks.
Use the Wazuh passwords tool to change all the internal users passwords.
/usr/share/wazuh-indexer/plugins/opensearch-security/tools/wazuh-passwords-tool.sh --api --change-all --admin-user wazuh --admin-password wazuh
Save the new Wazuh indexer password into the Wazuh manager keystore. Restart Wazuh manager service.
/var/ossec/bin/wazuh-keystore -f indexer -k password -v <SNIP>
systemctl start wazuh-manager
systemctl status wazuh-manager
Add the new password to the Filebeat secrets keystore. Restart the Filebeat service
echo "<SNIP>" | filebeat keystore add password --stdin --force
systemctl restart filebeat
filebeat test output
Verify that new password has been added to /usr/share/wazuh-dashboard/data/wazuh/config/wazuh.yml. Restart the Wazuh dashboard.
nano /usr/share/wazuh-dashboard/data/wazuh/config/wazuh.yml
systemctl restart wazuh-dashboard
systemctl status wazuh-dashboard
Installing Wazuh Agents on Endpoints
Configuring Firewall on Windows
For Wazuh agent to communicate with the Wazuh manager services, the following ports needs to be allowed for outbound connection:
- 1514/TCP for agent communication.
- 1515/TCP for enrollment via automatic agent request.
- 55000/TCP for enrollment via manager API.
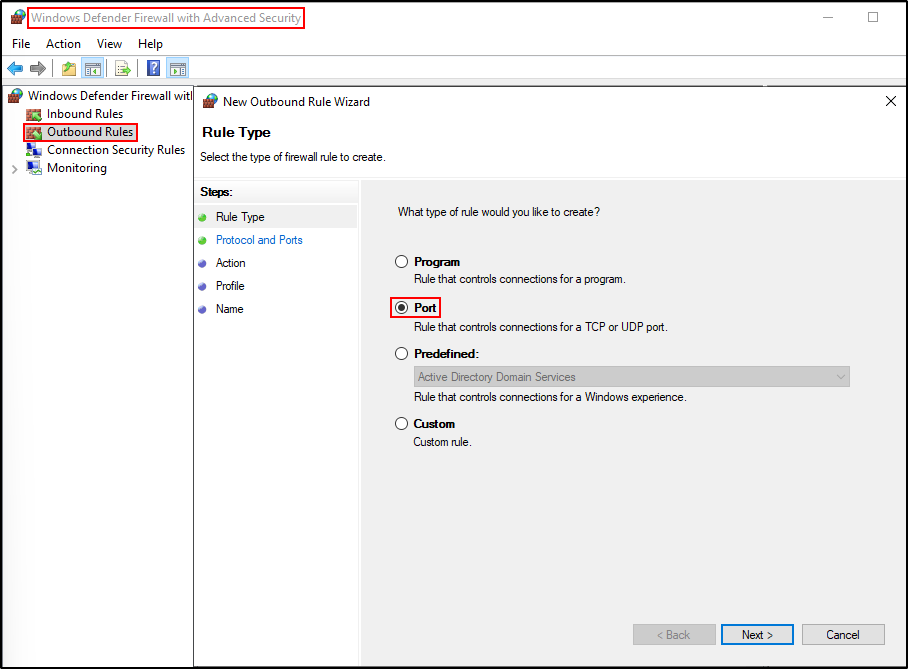
Open Windows Defender Firewall with Advanced Security. Right-click Outbound Rules and create new rule. Select Port.
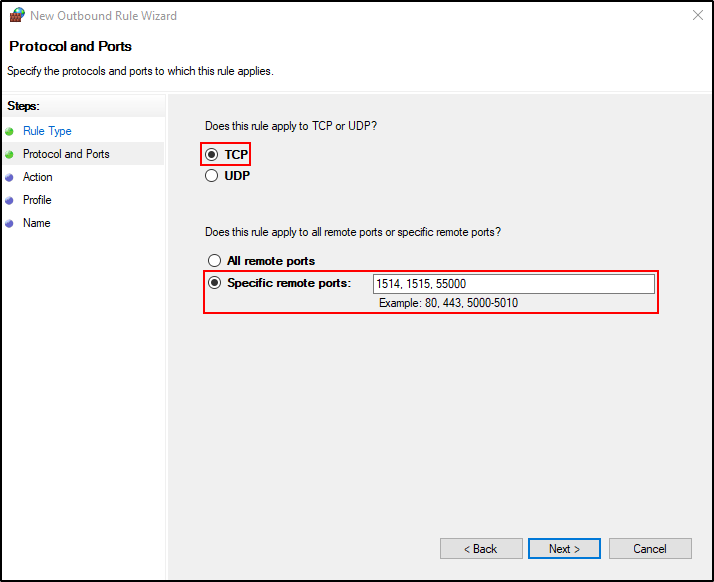
Select TCP and Specific remote ports. Put 1514, 1515, 55000. Click Next.
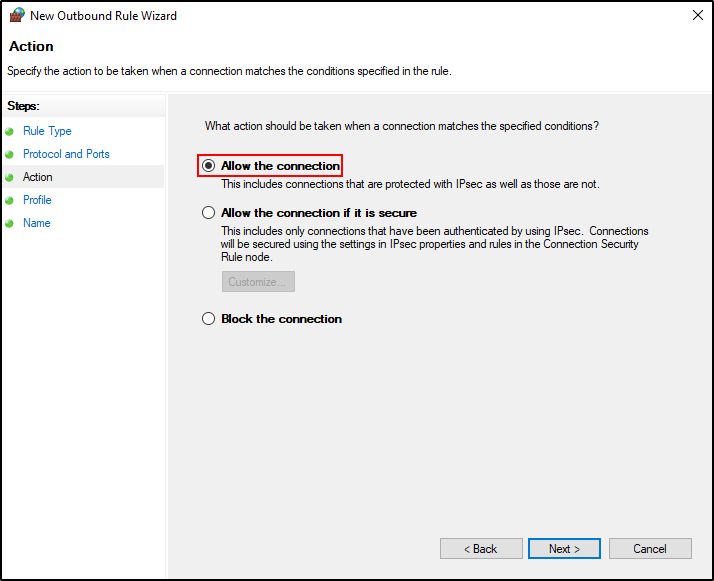
Select Allow the connection.
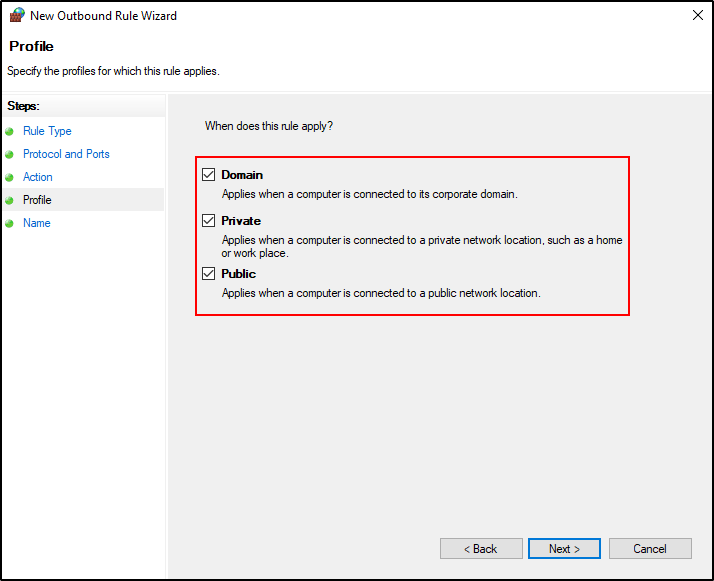
Select Domain, Private and Public.
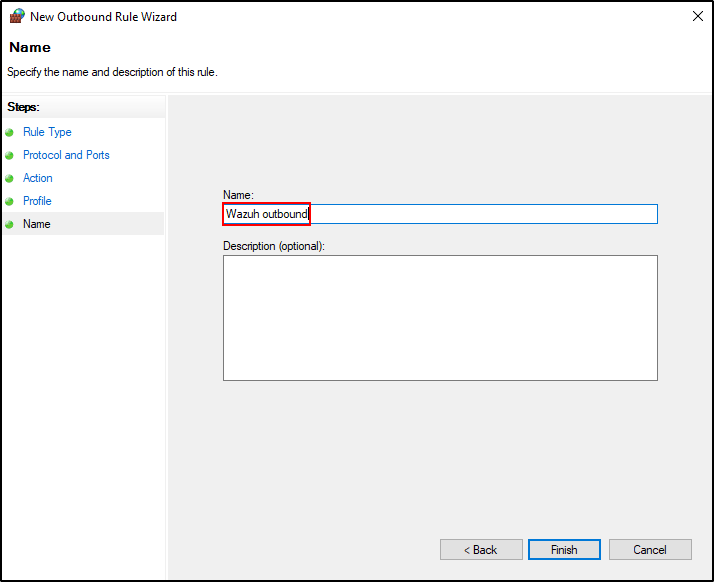
Name the New Outbound Rule as Wazuh outbound and click Finish.
Installing Wazuh agent on Windows
The agent runs on the endpoint you want to monitor and communicates with the Wazuh server, sending data in near real-time through an encrypted and authenticated channel.
Note To perform the installation, administrator privileges are required.
To start the installation process, download the Windows installer.
Open PowerShell as Administrator and change directory to where Windows installer is located. Run the following command:
The installation process is now complete, and the Wazuh agent is successfully installed and configured. You can start the Wazuh agent from the GUI or by running:
Once started, the Wazuh agent will start the enrollment process and register with the manager.
Troubleshooting Windows Wazuh Agent
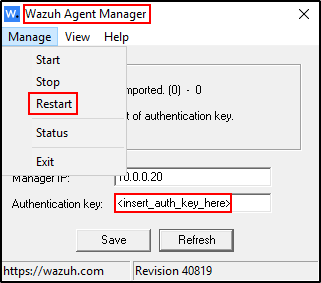
If Wazuh agent on Windows is unable to connect to Wazuh server, open Wazuh Agent Manager
If Authentication key show as
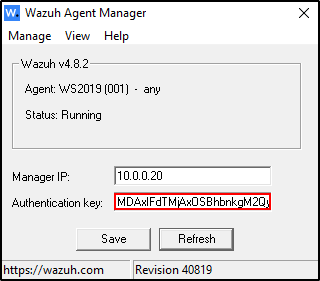
Click Save then Refresh
You should be able to see Authentication key. The Authentication key is used to encrypt the traffic from the agent to the Wazuh server.
If issues still persist, refer to the log file located at C:\Program Files (x86)\ossec-agent\ossec.log
Alternatively, refer to the Troubleshooting guide.
On Wazuh web UI, go to Server management, then Endpoints Summary.
Verify that the Windows agent is active.
Sysmon Integration
Perform the steps below to install and configure Sysmon on the Windows endpoint.
Download Sysmon from the Microsoft Sysinternals page.
Download the Sysmon configuration file: sysmonconfig.xml. Note this is a modified version of sysmonconfig.xml recommended for integration with Wazuh.
Install Sysmon with the downloaded configuration file using PowerShell as an administrator:
Open notepad as Administrator and open ossec.conf.
Add the following configuration within the <ossec_config> block to the Wazuh agent C:\Program Files (x86)\ossec-agent\ossec.conf file to specify the location to collect Sysmon logs:
<localfile>
  <location>Microsoft-Windows-Sysmon/Operational</location>
  <log_format>eventchannel</log_format>
</localfile>
Restart the Wazuh agent to apply the changes by running the following PowerShell command as an administrator:
Monitoring Network Devices with Wazuh
Configuring Syslog Logging on FortiGate
On FortiGate Command-Line Interface (CLI), run the following commands to configure Syslog Server Settings:
config log syslogd setting
    set status enable
    set server <syslog-ng IP>
    set source-ip <FortiGate IP>
    # set port <port number>  (Default port is 514)
    # Verify settings by running "show"
end
Configure Log Memory Filter:
config log memory filter
    set forward-traffic enable
    set local-traffic enable
    set sniffer-traffic disable
    set anomaly enable
    set voip disable
    set multicast-traffic enable
    # Verify settings by running "show full-configuration"
end
Configure Global System Settings:
config system global
    set cli-audit-log enable
    # Verify settings by running "show"
    # Ensure the timezone is correct, e.g., "Pacific/Auckland"
end
Enable Logging for Neighbour Events:
Configuring Log Rotation
By default, the logrotate service is configured to rotate logs in directories like /var/log/
For rsyslog, the rotation of its default log files (e.g., /var/log/syslog) is managed by the configuration file located at /etc/logrotate.d/rsyslog.
Open the /etc/logrotate.d/rsyslog file in a text editor:
Add the path to your fortigate.log file under the existing log files.
/var/log/syslog
/var/log/fortigate.log
...
{
    rotate 4
    weekly
    missingok
    notifempty
    compress
    delaycompress
    sharedscripts
    postrotate
        /usr/lib/rsyslog/rsyslog-rotate
    endscript
}
Key Settings:
- rotate 4: Keeps 4 log files before deleting the oldest one.
- weekly: Rotates logs once per week.
- missingok: If the log file is missing, no error will be raised.
- notifempty: Only rotates logs if they are not empty.
- compress: Compresses old log files (e.g., to
.gz). - delaycompress: Compresses the logs on the second rotation cycle, meaning the most recent rotated file is not compressed immediately.
- sharedscripts: Runs the
postrotatescript only once, even if multiple logs are rotated. - postrotate: After log rotation, it runs
/usr/lib/rsyslog/rsyslog-rotateto ensure thatrsyslogreopens its log files (so it doesn't keep writing to the old rotated file).
Configuring Syslog on Wazuh Server (Optional)
The Wazuh server can collect logs via syslog from endpoints such as firewalls, switches, routers, and other devices that don’t support the installation of Wazuh agents. More details can be found here.
If you have a central logging server like Syslog or Logstash in place, you can install the Wazuh agent on that server to streamline log collection. This setup enables seamless forwarding of logs from multiple sources to the Wazuh server, facilitating comprehensive analysis.
Configure Rsyslog on Ubuntu endpoint (Recommended)
Rsyslog is a preinstalled utility in Ubuntu 22.04 for receiving syslog events. The following section shows the steps for enabling Rsyslog on the Ubuntu endpoint and configuring the Wazuh agent to send the syslog log data to the Wazuh server.
Edit /etc/rsyslog.conf.
Uncomment udp/514. Add allowed sender and configure log file format. Save changes.
#provides UDP syslog reception
module(load=”imudp”)
input(type=”imudp” port=”514")

#Add allowed sender and configure log file format
$AllowedSender UDP, 10.0.0.1/24
$template remote-incoming-logs, "/var/log/%HOSTNAME%.log"
*.* ?remote-incoming-logs
Permit udp/514 through the firewall (if firewall is configured and enabled).
Edit permissions on /var/log as Rsyslog may encounter permission error on relaunch.
Add any hosts you are receiving logs from to /etc/hosts
Restart and check status of rsyslog.
Configure the syslog clients (network devices) to send logs to our syslog server. Check /var/log to see that new log files are updating.
#Example output
2024-09-13T08:13:46.806479+12:00 fortigate date=2024-09-12 time=15:44:50 devname="Fortigate" devid="FGVMEVUEOETC5XC8" eventtime=1726112689938988753 tz="+1200" logid="0001000014" type="traffic" subtype="local" level="notice" vd="root" srcip=192.168.1.64 srcport=14712 srcintf="root" srcintfrole="undefined" dstip=38.21.192.5 dstport=443 dstintf="port1" dstintfrole="wan" srccountry="Reserved" dstcountry="United States" sessionid=44992 proto=6 action="close" policyid=0 service="HTTPS" trandisp="noop" app="HTTPS" duration=1 sentbyte=441 rcvdbyte=223 sentpkt=5 rcvdpkt=4
Installing Wazuh agent on Linux (Ubuntu)
Configure firewall:
Download Wazuh agent from the packages list.
Transfer the Wazuh agent to Ubuntu endpoint. Install the package using dpkg
After installing, set the Wazuh manager's IP address by editing the configuration file. Look for the <server> section and update it with the Wazuh manager's IP address.
<ossec_config>
  <client>
    <server>
      <address>10.0.0.20</address>
      <port>1514</port>
      <protocol>tcp</protocol>
    </server>
    <config-profile>ubuntu, ubuntu22, ubuntu22.04</config-profile>
    <notify_time>10</notify_time>
    <time-reconnect>60</time-reconnect>
    <auto_restart>yes</auto_restart>
    <crypto_method>aes</crypto_method>
  </client>
Start and enable the Wazuh agent. Verify Wazuh agent is active and running.
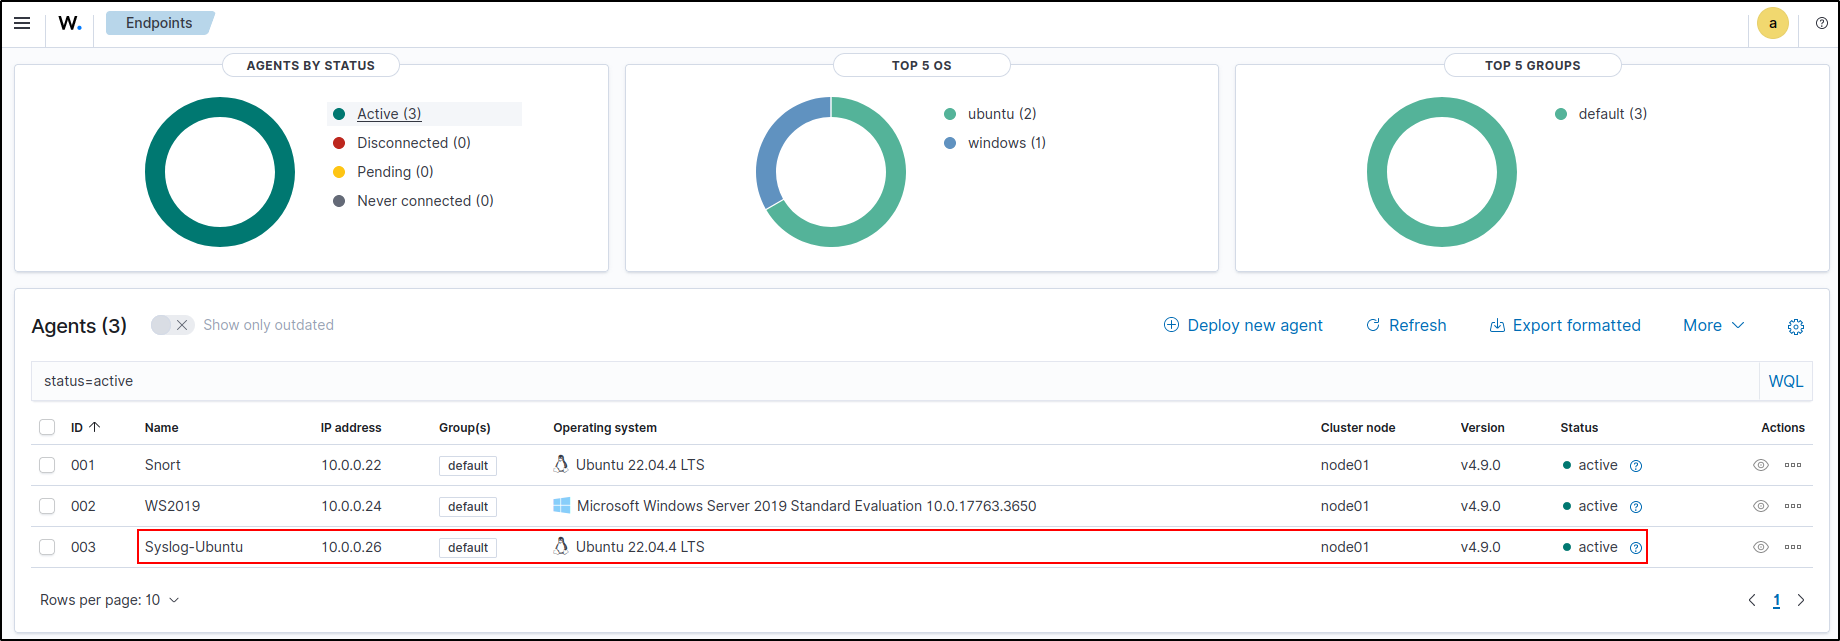
On Wazuh server UI, verify Ubuntu agent is active
Configuring Wazuh to Monitor Fortigate Log
Add the following to /var/ossec/etc/ossec.conf file on Wazuh manager and agent.
#On both Wazuh manager and agent
<localfile>
  <log_format>syslog</log_format>
  <location>/var/log/fortigate.log</location>
</localfile>
Restart the manager and agent after adding this setting:
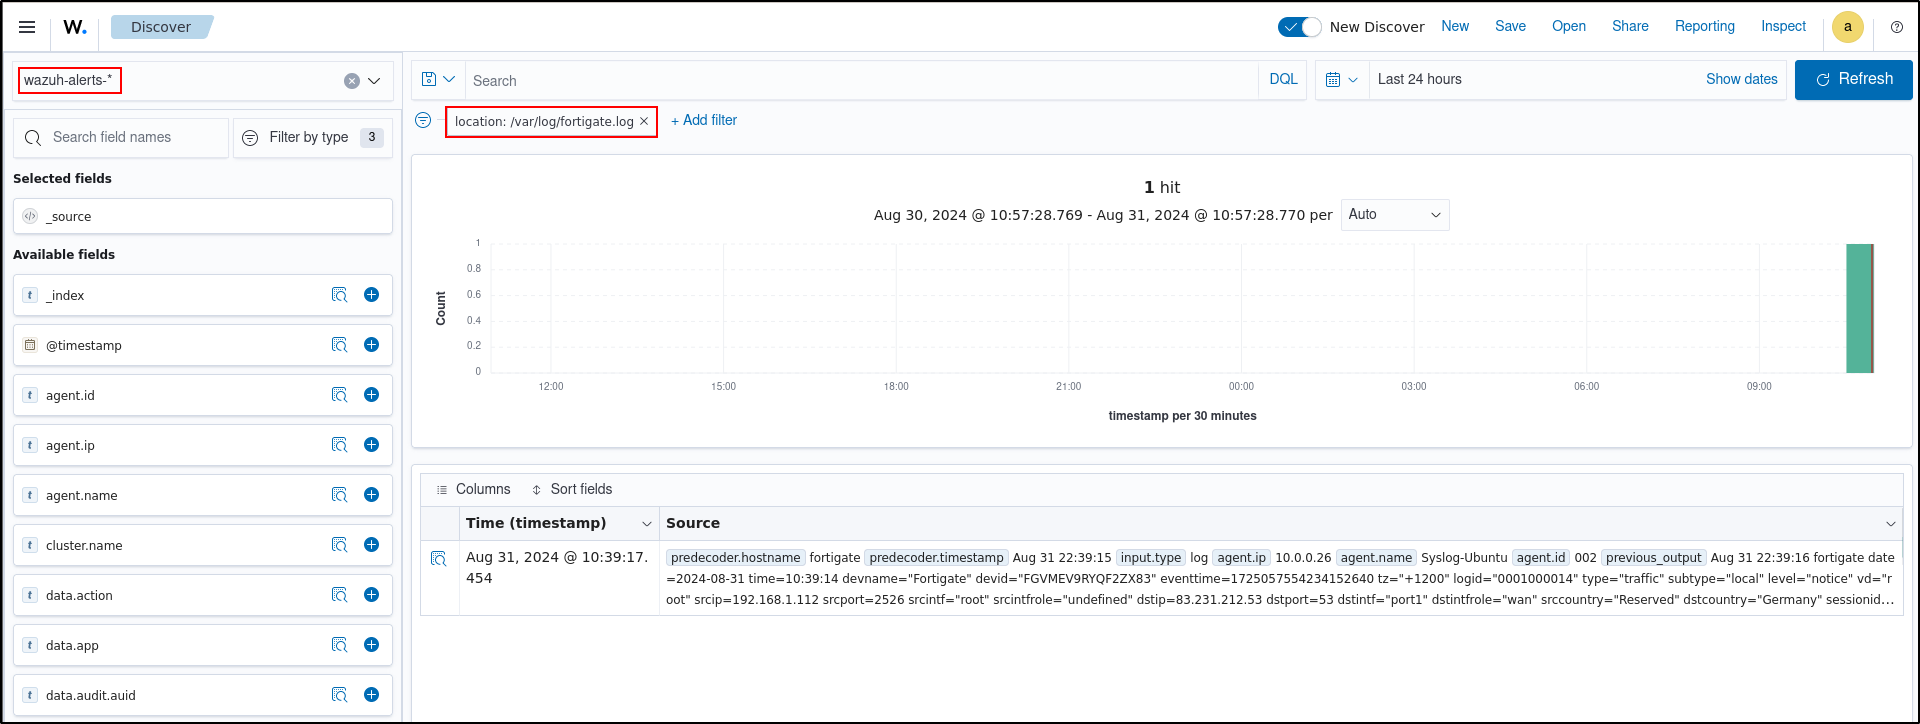
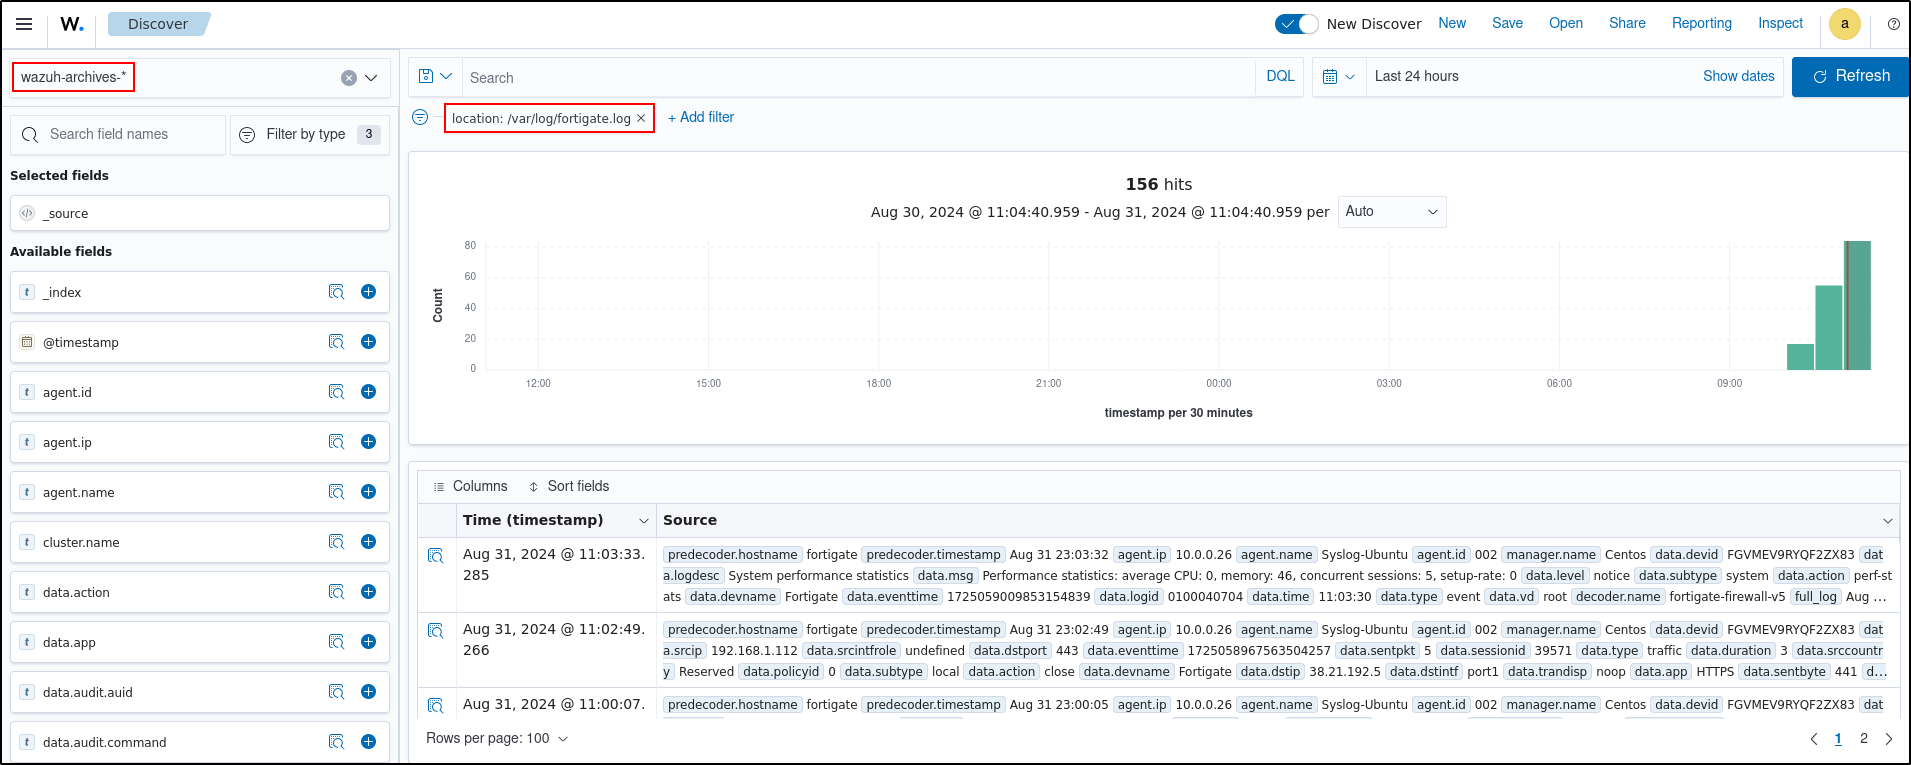
Verify fortigate logs are being ingested. Follow the steps below to enable archiving and set up wazuh-archives-* index. Search wazuh-alerts- and wazuh-archives- index. Add filter for location is /var/log/fortigate.log.
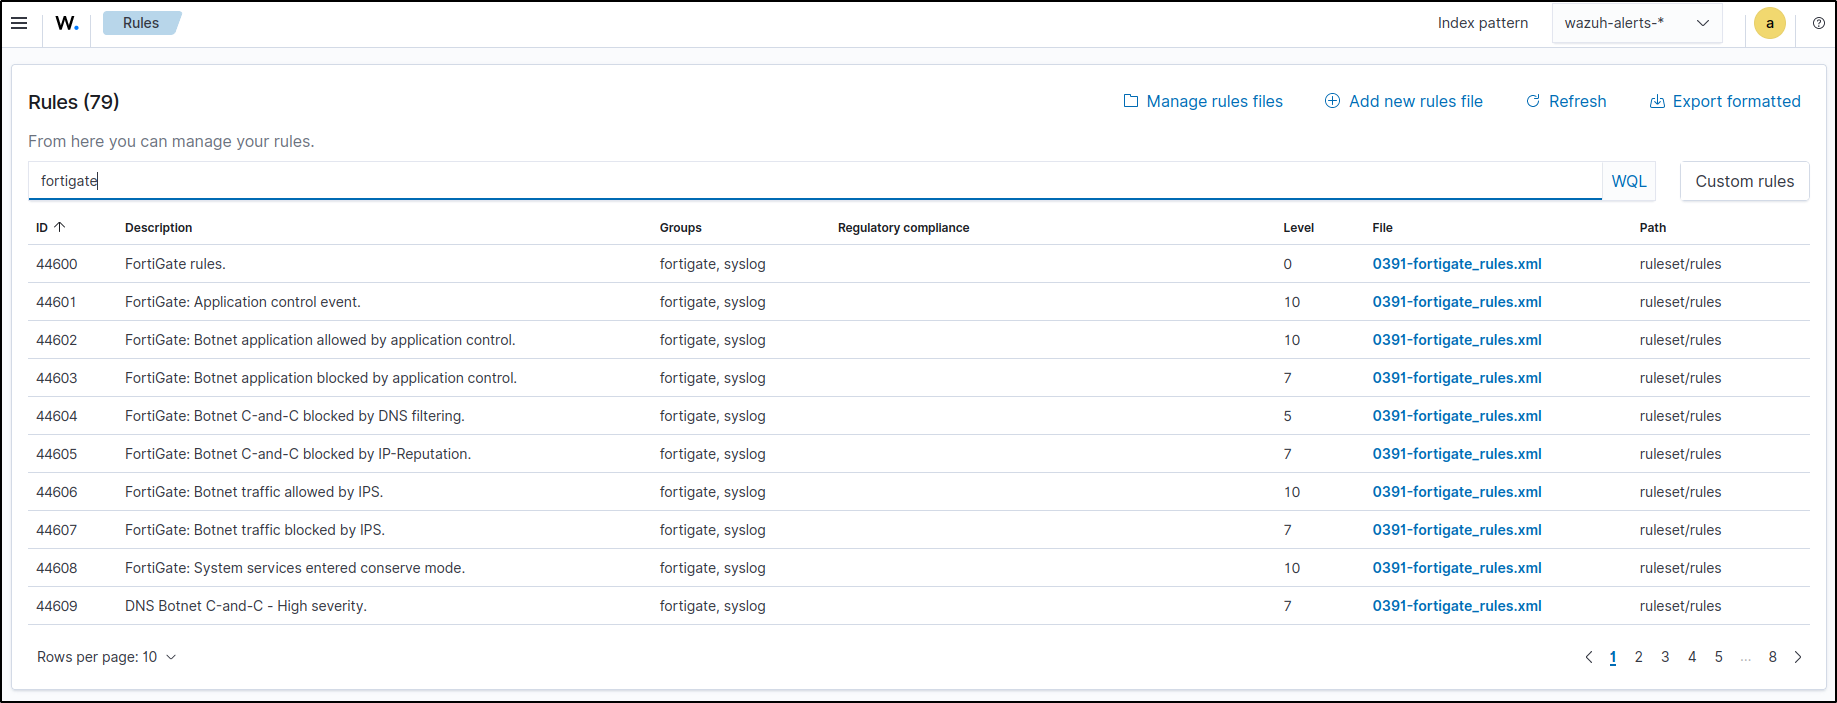
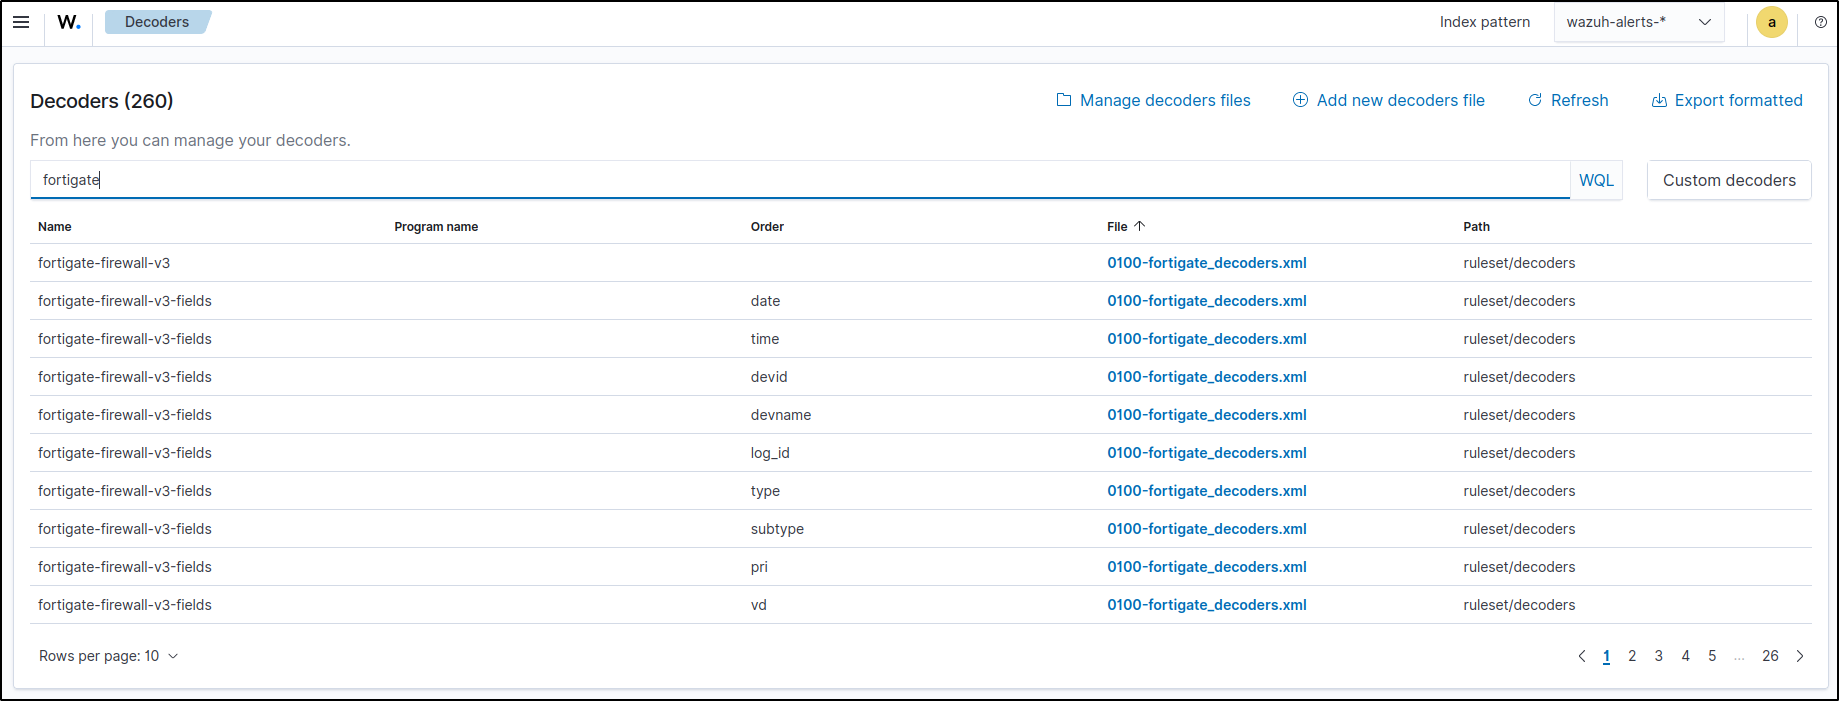
Default Decoders and Rules for FortiGate
By default, Wazuh has pre-installed decoders and rules for FortiGate. This can be checked in Wazuh server UI under Rules and Decoders
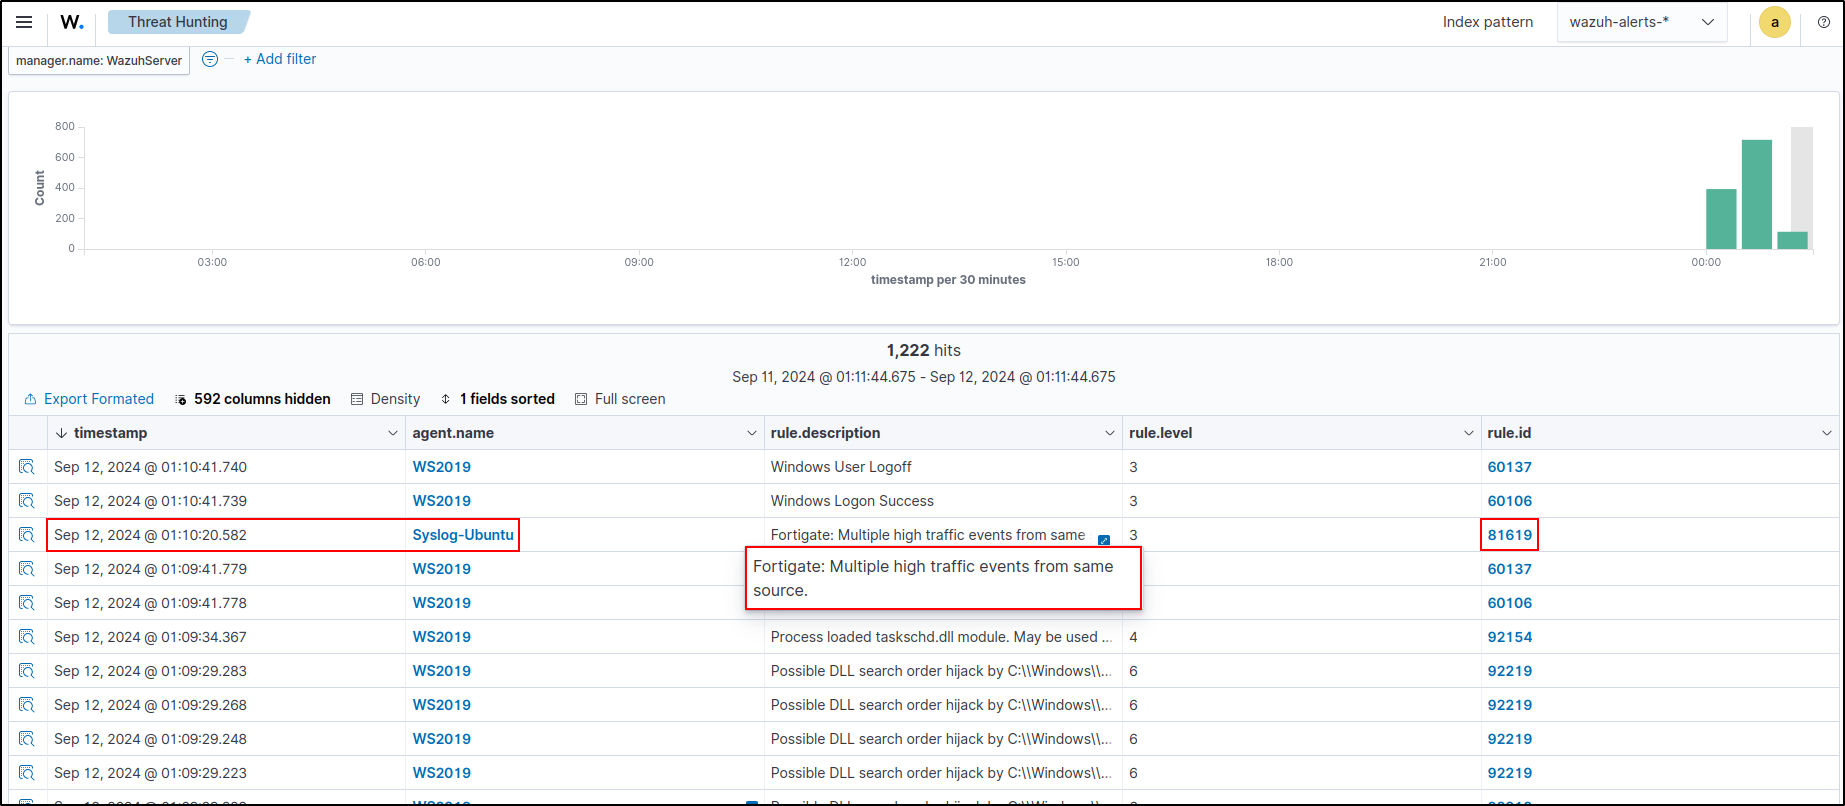
To test the default rule for FortiGate, SSH brute force attack was executed from Kali machine.
The alert from the rule “Fortigate: Multiple high traffic events from same source” was generated.
This can be verified in Threat Intelligent, Events section on the web UI.
Event Logging
Log Compression and Rotation
Log files can quickly accumulate and consume significant disk space in a system. To prevent this, the Wazuh manager compresses logs during its rotation process, helping to manage disk usage efficiently and maintain system performance. The Wazuh manager compresses log files daily or when they reach a certain threshold (file size, age, time, and more) and archives them. In the log rotation process, Wazuh creates a new log file with the original name to continuously write new events.
Log files are compressed daily and digitally signed using MD5, SHA1, and SHA256 hashing algorithms. The compressed log files are stored in the /var/ossec/logs/ directory
Archiving Event Logs
Events are logs generated by applications, endpoints, and network devices. The Wazuh server stores all events it receives, whether or not they trigger a rule. These events are stored in the Wazuh archives located at /var/ossec/logs/archives/archives.log and /var/ossec/logs/archives/archives.json. Security teams use archived logs to review historical data of security incidents, analyze trends, and generate reports to hunt threats.
By default, the Wazuh archives are disabled because it stores logs indefinitely on the Wazuh server. When enabled, the Wazuh manager creates archived files to store and retain security data for compliance and forensic purposes.
Note: The Wazuh archives retain logs collected from all monitored endpoints, therefore consuming significant storage resources on the Wazuh server over time. So, it is important to consider the impact on disk space and performance before enabling them.
Enabling archiving
Edit the Wazuh manager configuration file /var/ossec/etc/ossec.conf and set the value of the highlighted fields below to yes:
<ossec_config>
  <global>
    <jsonout_output>yes</jsonout_output>
    <alerts_log>yes</alerts_log>
    <logall>yes</logall>
    <logall_json>yes</logall_json>
</ossec_config>
<logall> enables or disables archiving of all log messages. When enabled, the Wazuh server stores the logs in a syslog format. The allowed values are yes and no.<logall_json> enables or disables logging of events. When enabled, the Wazuh server stores the events in a JSON format. The allowed values are yes and no.
Depending on the format you desire, you can set one or both values of the highlighted fields to yes. However, only the <logall_json>yes</logall_json> option allows you to create an index that can be used to visualize the events on the Wazuh dashboard.
Restart the Wazuh manager to apply the configuration changes:
Depending on your chosen format, the file archives.log, archives.json, or both will be created in the /var/ossec/logs/archives/ directory on the Wazuh server. Wazuh uses a default log rotation policy. It ensures that available disk space is conserved by rotating and compressing logs on a daily, monthly, and yearly basis.
Visualising Events on Dashboard
Edit the Filebeat configuration file /etc/filebeat/filebeat.yml and change the value of archives: enabled from false to true:
Restart Filebeat to apply the configuration changes:
Configuring Wazuh Dashboard
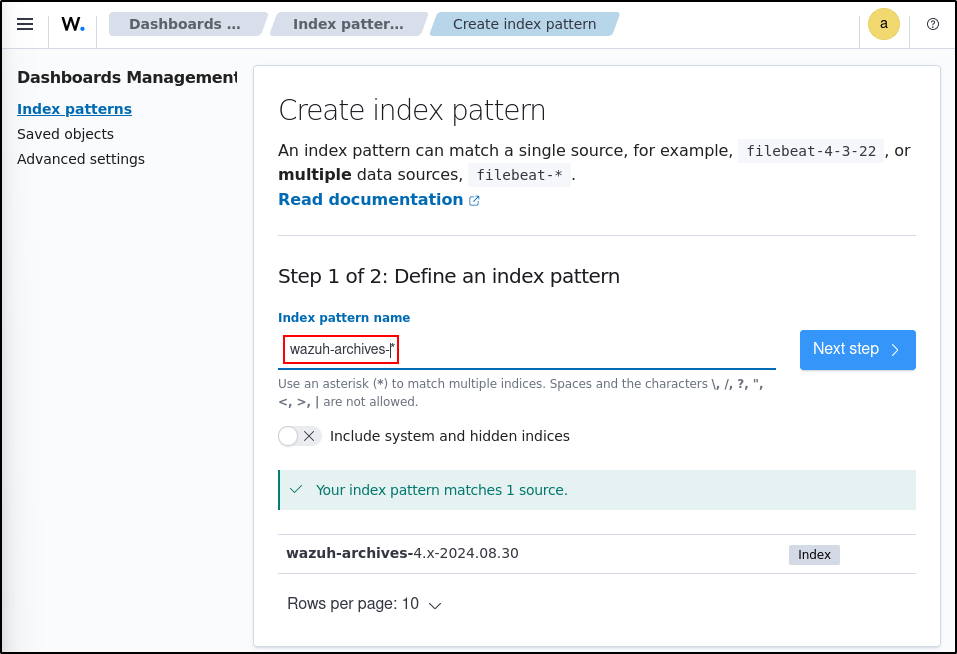
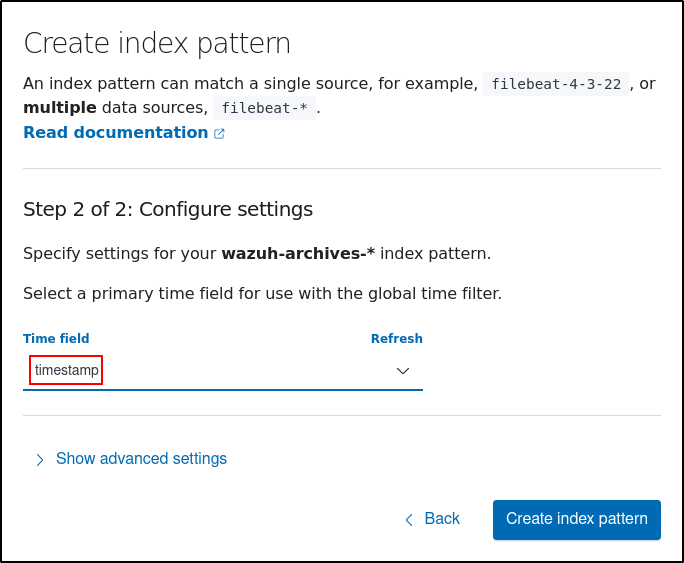
Click the upper-left menu icon and navigate to Dashboard management > Index patterns > Create index pattern. Use wazuh-archives-* as the index pattern name, and set timestamp in the Time field drop-down list.
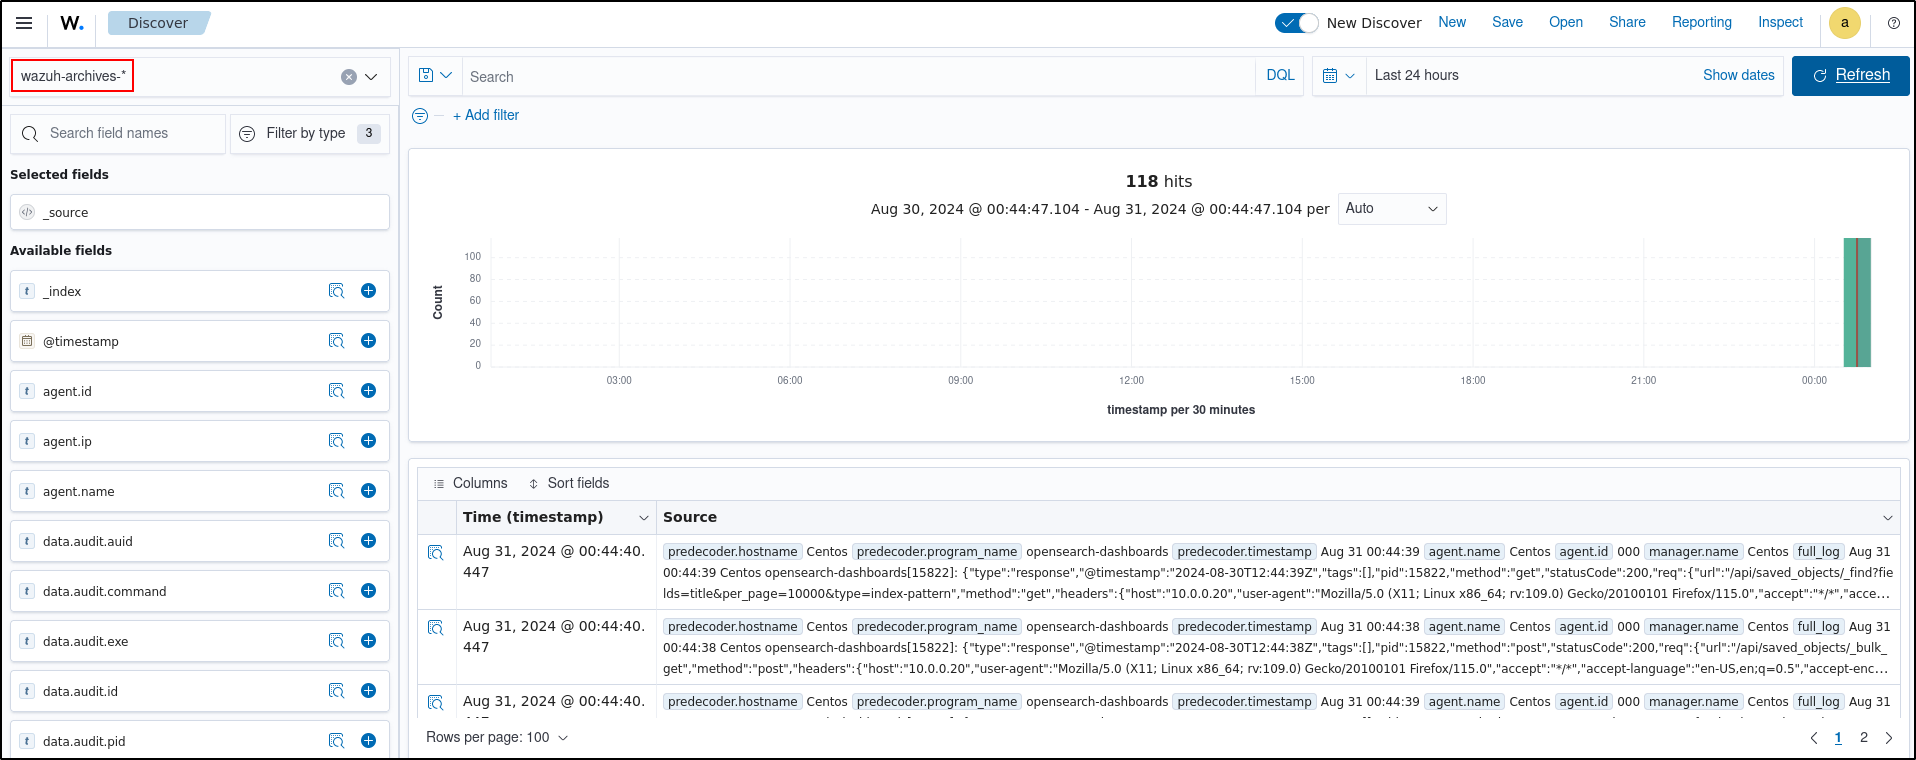
To view the events on the dashboard, click the upper-left menu icon and navigate to Discover. Change the index pattern to wazuh-archives-*.
Introduction to Wazuh
Use case: Detecting Signed Binary Proxy Execution
Signed binary proxy execution is a technique threat actors use to bypass application whitelisting by using trusted binaries to run malicious code. This technique is identified as T1218.010 based on the MITRE ATT&CK framework.
In this use case, we show how to abuse the Windows utility, regsvr32.exe, to bypass application controls. We then analyse events in the Wazuh archives to detect suspicious activity related to this technique.
Atomic Red Team Installation
Note: this has been tested in an isolated Unclassified environment. Perform the following steps to install the Atomic Red Team PowerShell module on a Windows endpoint using PowerShell as an administrator. By default, PowerShell restricts the execution of running scripts. Run the command below to change the default execution policy to RemoteSigned:
Install the ART execution framework:
IEX (IWR 'https://raw.githubusercontent.com/redcanaryco/invoke-atomicredteam/master/install-atomicredteam.ps1' -UseBasicParsing);
Install-AtomicRedTeam -getAtomics
Import the ART module to use Invoke-AtomicTest function
Use Invoke-AtomicTest function to show details of the technique T1218.010
#Example output
PathToAtomicsFolder = C:\AtomicRedTeam\atomics

T1218.010-1 Regsvr32 local COM scriptlet execution
T1218.010-2 Regsvr32 remote COM scriptlet execution
T1218.010-3 Regsvr32 local DLL execution
T1218.010-4 Regsvr32 Registering Non DLL
T1218.010-5 Regsvr32 Silent DLL Install Call DllRegisterServer
Attack Emulation
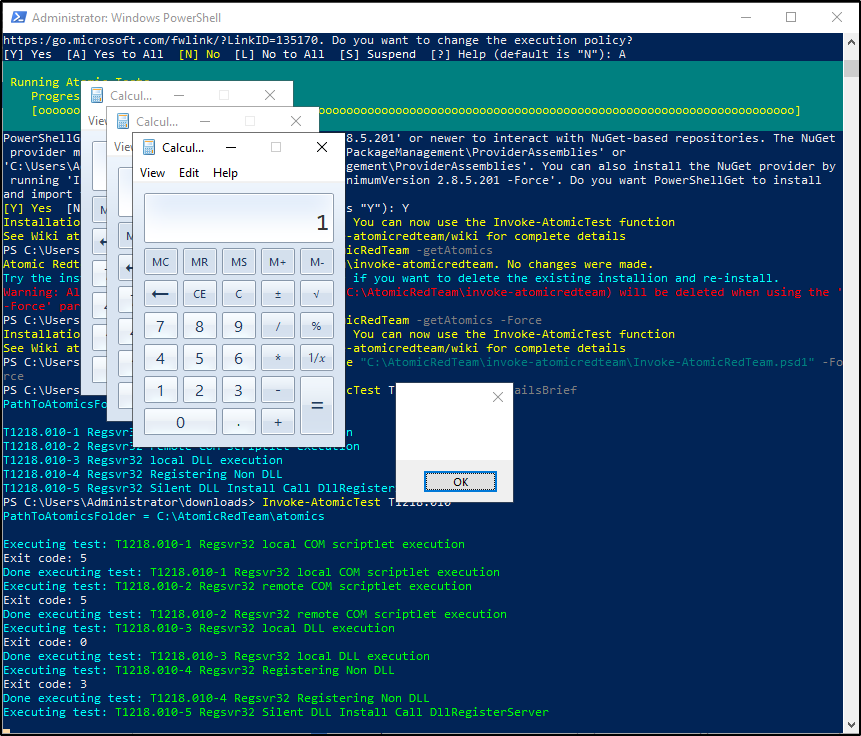
Emulate the signed binary proxy execution technique on the Windows endpoint. Run the command below with Powershell as an administrator to perform the T1218.010 test.
#Example output
PathToAtomicsFolder = C:\AtomicRedTeam\atomics

Executing test: T1218.010-1 Regsvr32 local COM scriptlet execution
Done executing test: T1218.010-1 Regsvr32 local COM scriptlet execution
Executing test: T1218.010-2 Regsvr32 remote COM scriptlet execution
Done executing test: T1218.010-2 Regsvr32 remote COM scriptlet execution
Executing test: T1218.010-3 Regsvr32 local DLL execution
Done executing test: T1218.010-3 Regsvr32 local DLL execution
Executing test: T1218.010-4 Regsvr32 Registering Non DLL
Done executing test: T1218.010-4 Regsvr32 Registering Non DLL
Executing test: T1218.010-5 Regsvr32 Silent DLL Install Call DllRegisterServer
Done executing test: T1218.010-5 Regsvr32 Silent DLL Install Call DllRegisterServer
Several calculator instances will pop up after a successful execution of the exploit.
Wazuh Dashboard
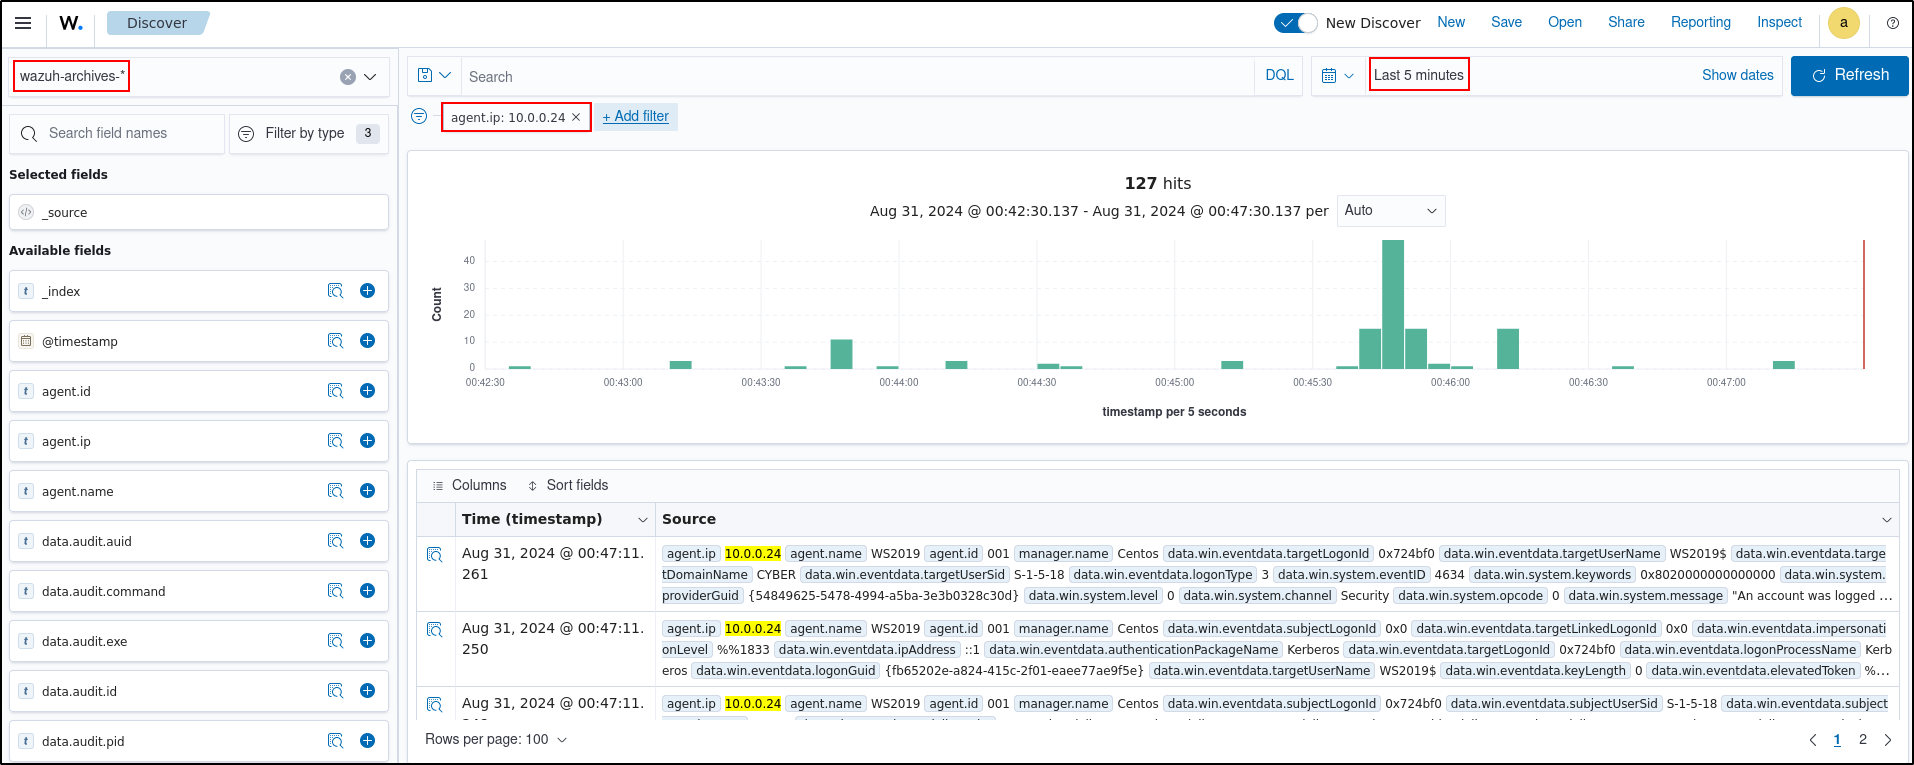
Use the Wazuh archives to query and display events related to the technique being hunted. It's important to note that while consulting the archives, some events might already be captured as alerts on the Wazuh dashboard. You can use information from the Wazuh archives, including alerts and events that have no detection to create custom rules based on your specific requirements.
Apply a time range filter to view events that occurred within the last five minutes of when the test was performed. Filter to view logs from the specific Windows endpoint using agent.id, agent.ip or agent.name.
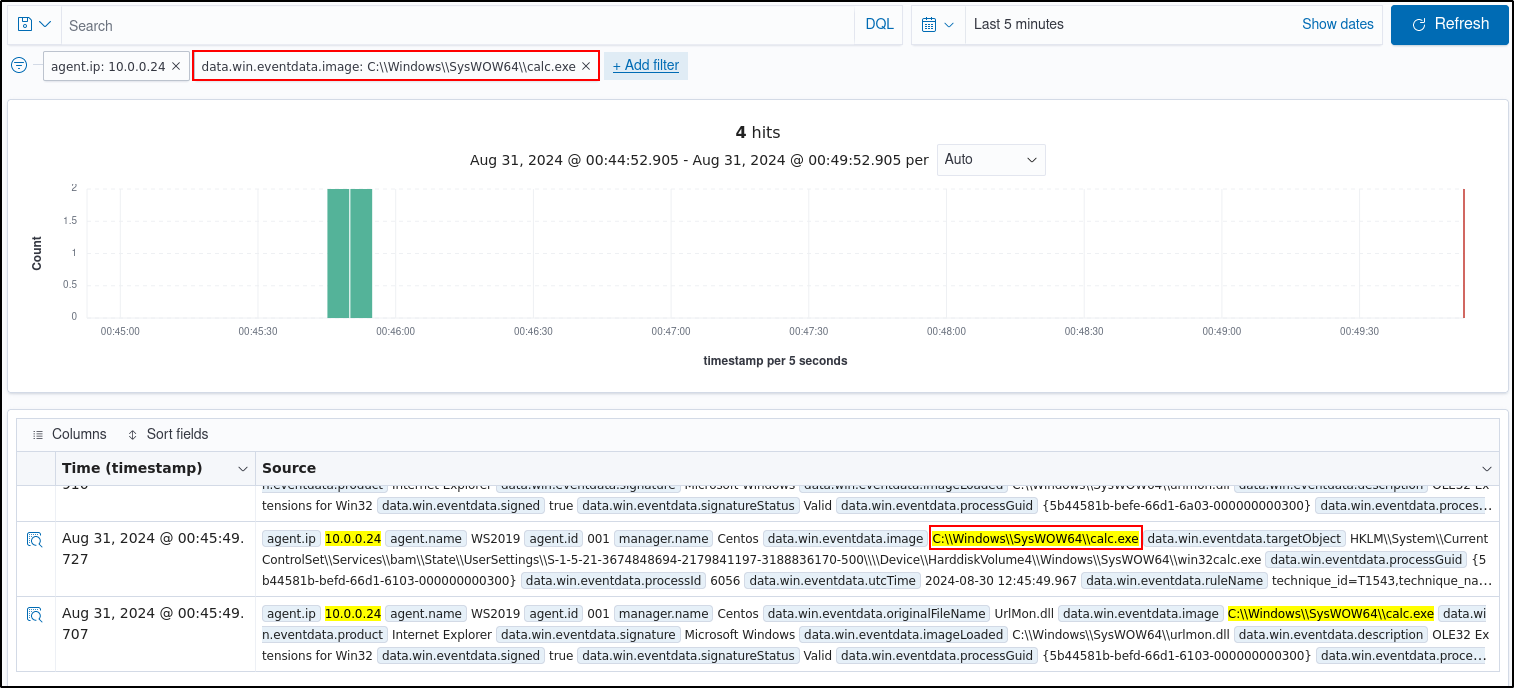
There are multiple hits that you can investigate to determine a correlation with the earlier attack emulation. For instance, you may notice a calculator spawning event similar to the one observed on the Windows endpoint during the test.
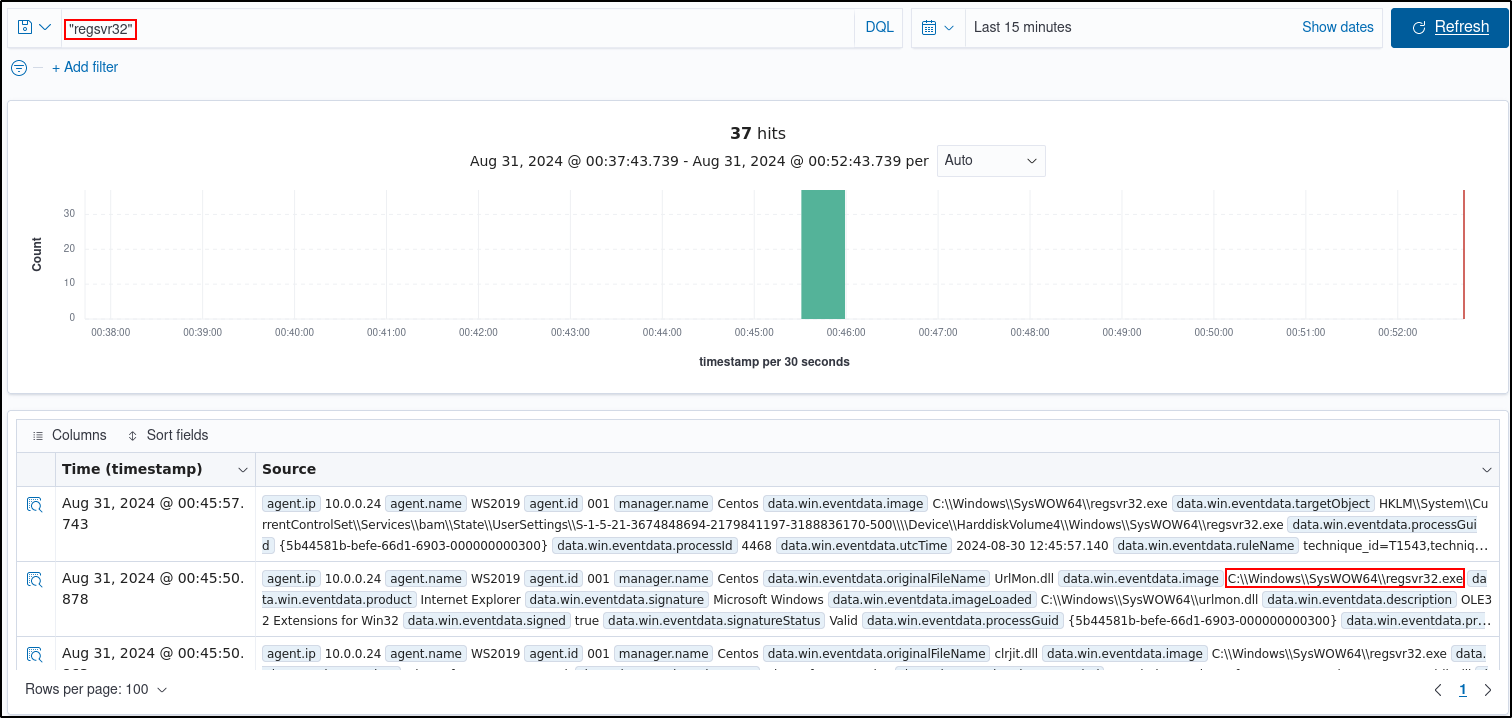
Type regsvr32 in the search bar to streamline and investigate events related to the regsvr32 utility.
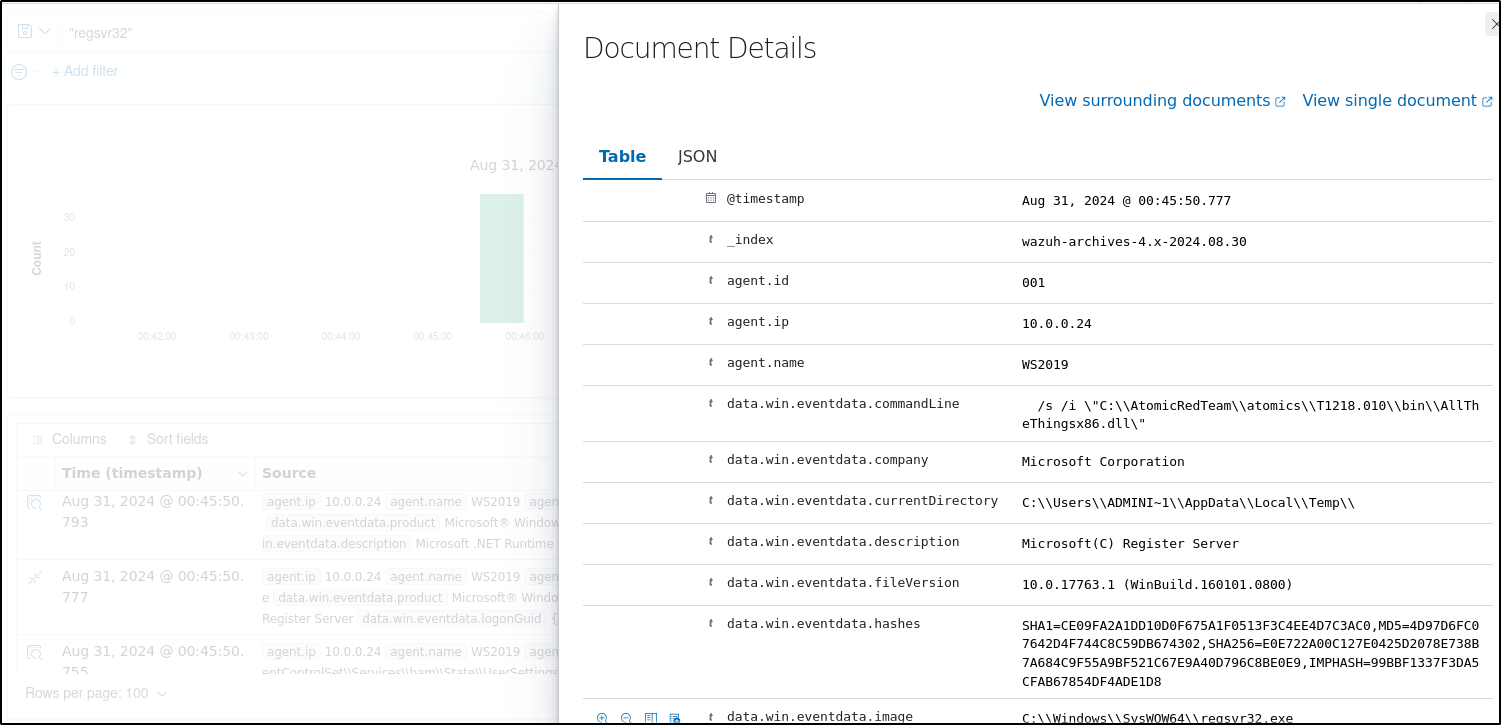
Expand any of the events to view their associated fields.
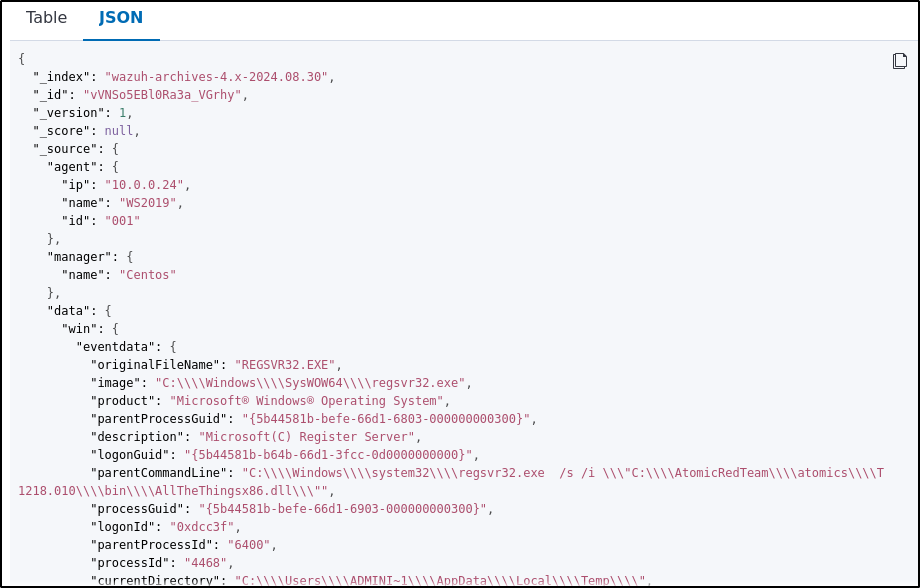
Click on the JSON tab to view the JSON format of the archived logs.
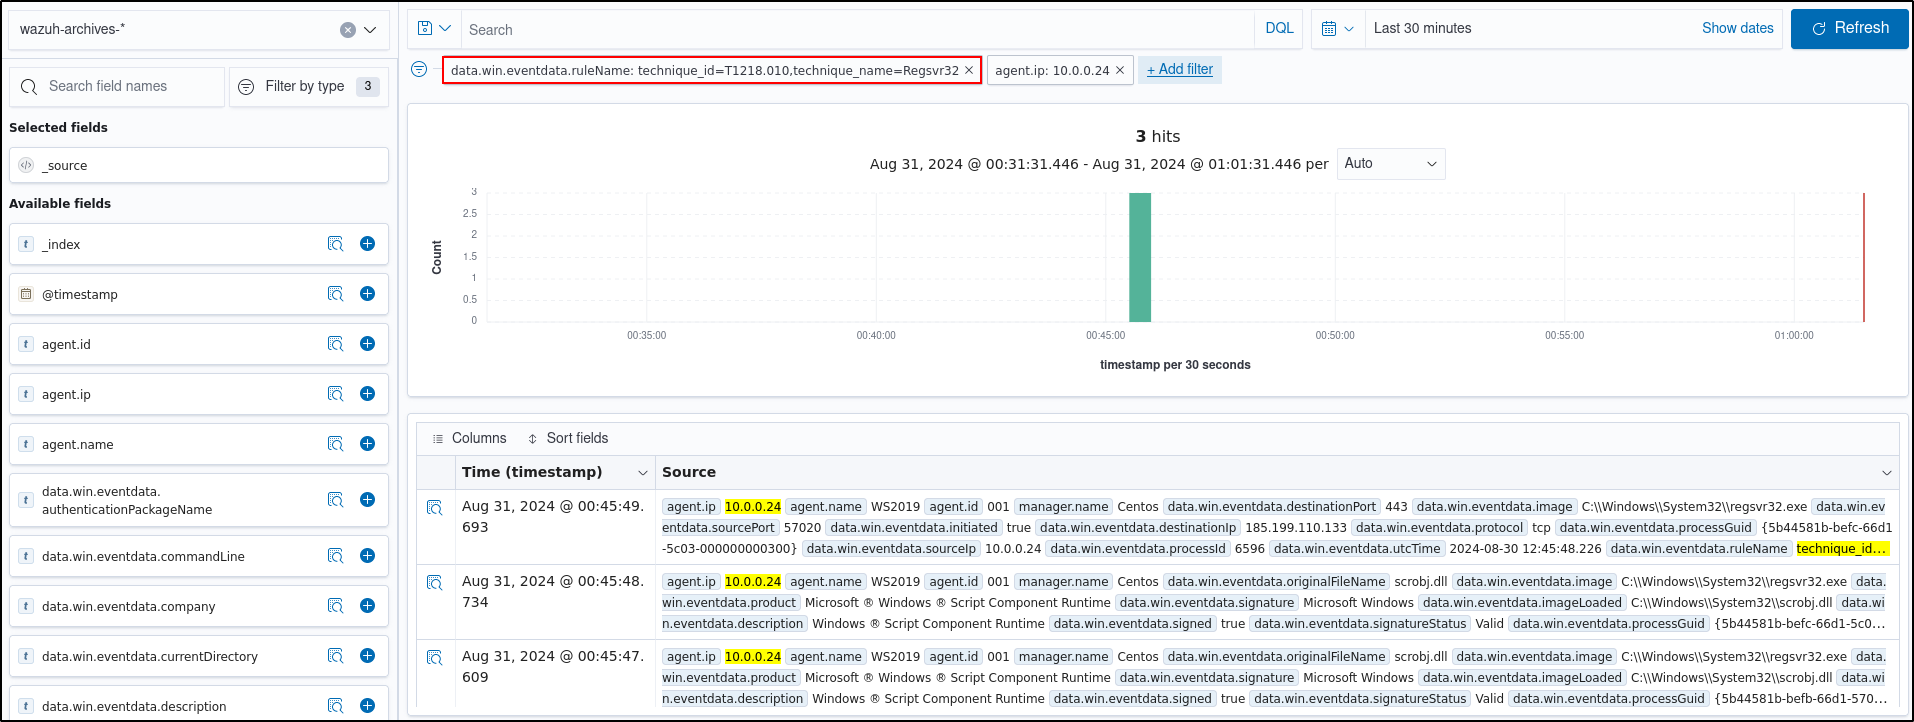
Apply the data.win.eventdata.ruleName:technique_id=T1218.010,technique_name=Regsvr32 filter to see the technique ID as shown below.
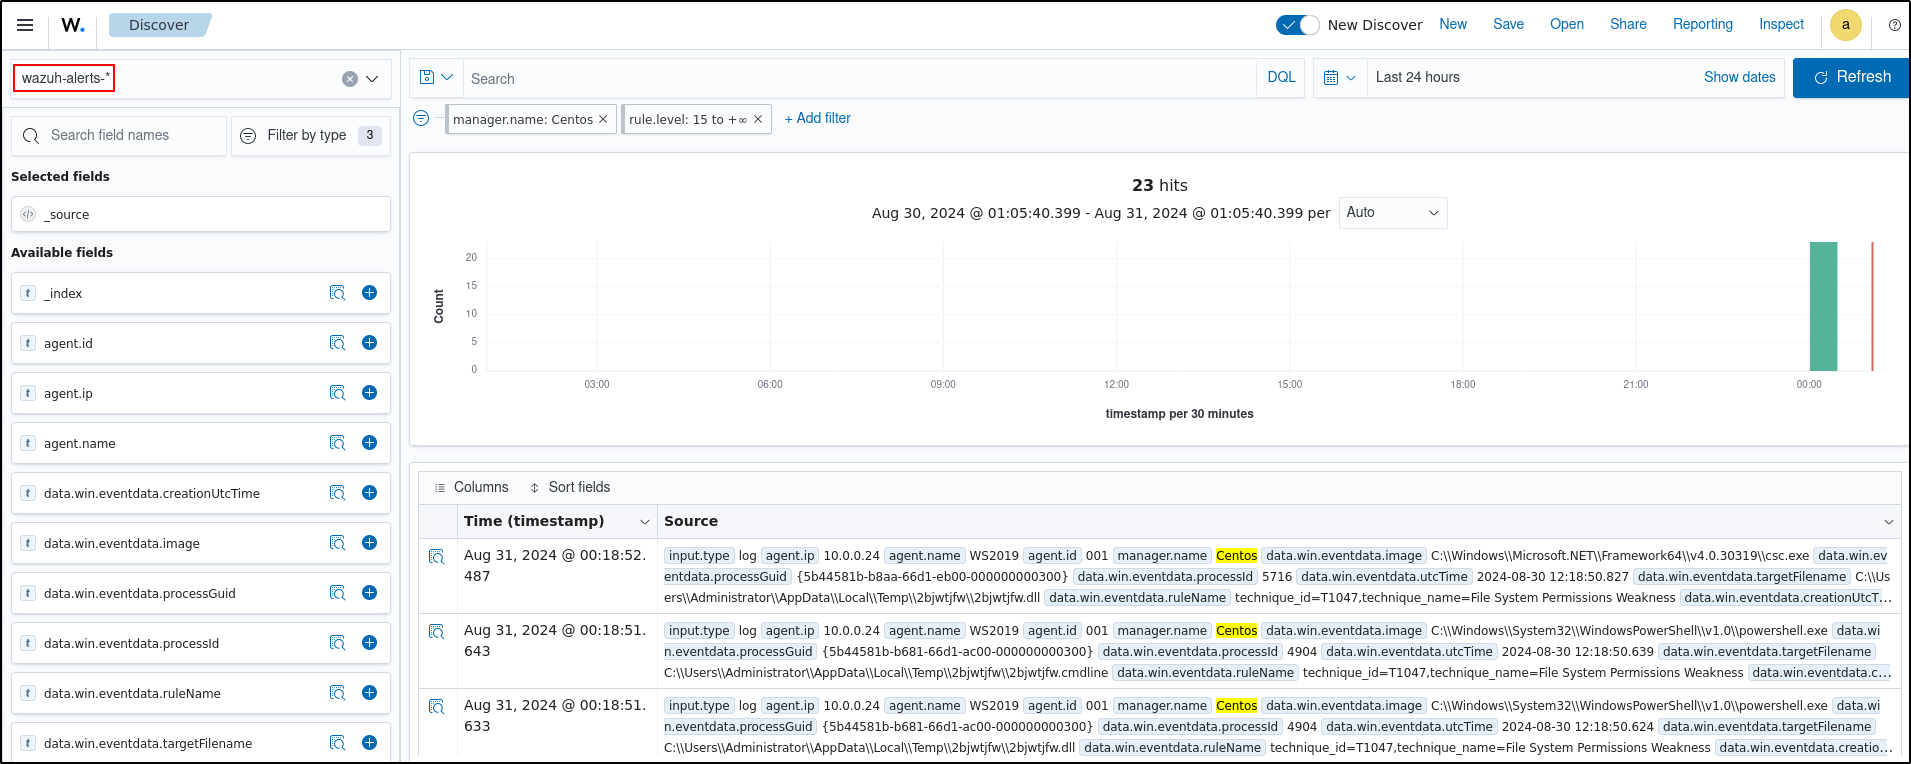
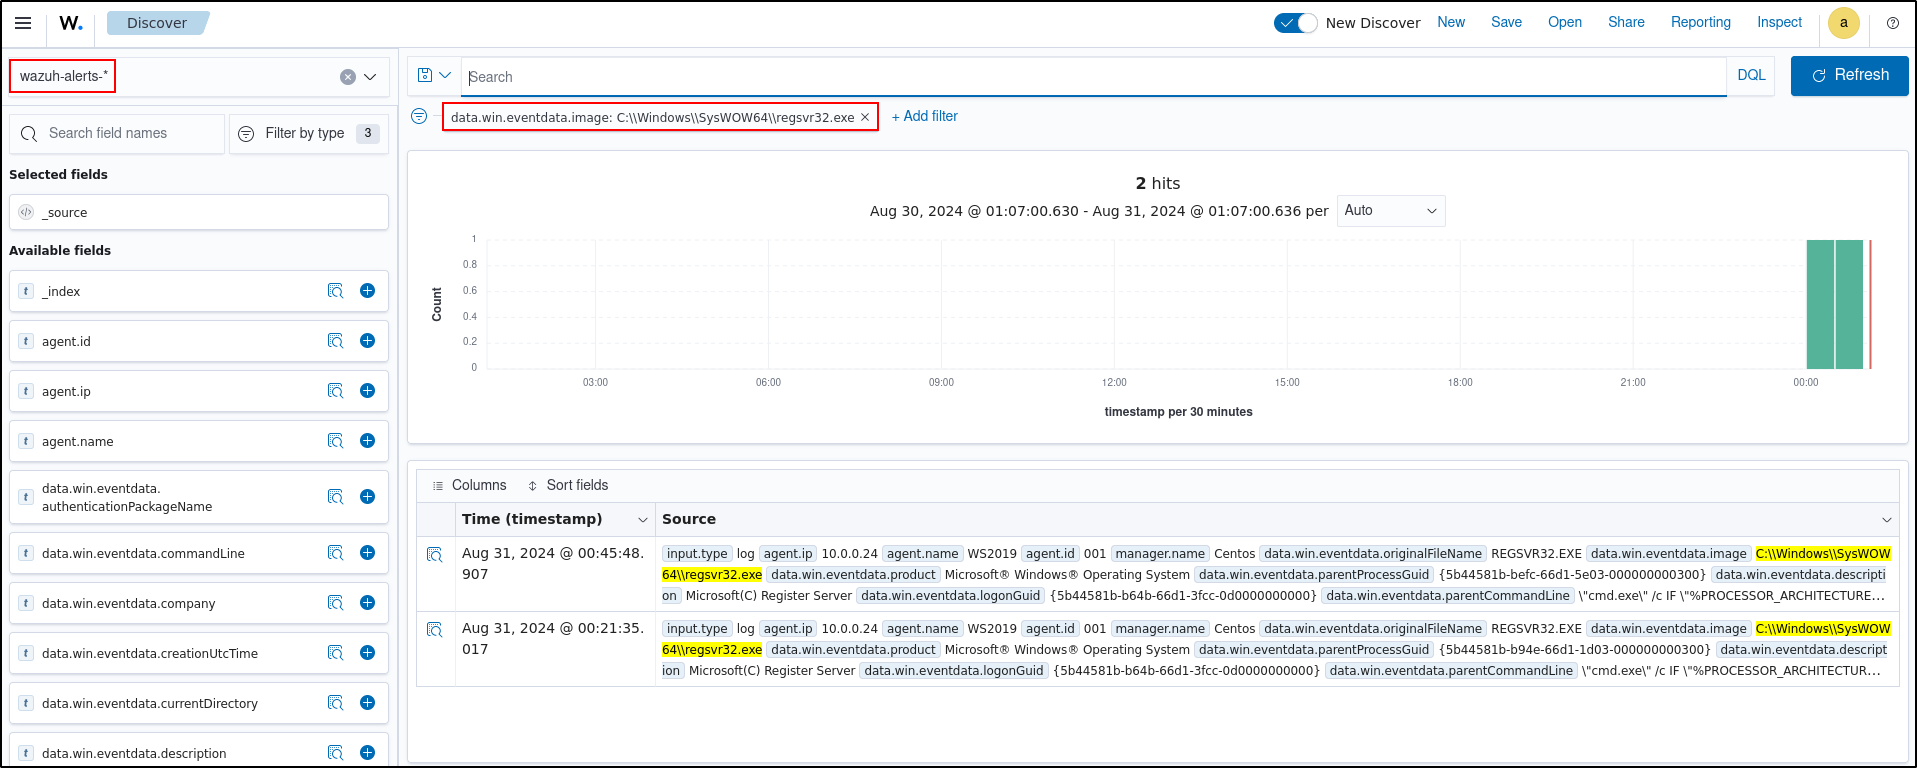
It is recommended to enable archiving as it allows users to view logs from network devices. However, if you prefer not to enable archiving, similar search can be performed on wazuh-alerts- (default) index instead of wazuh-archives- index.
Navigate to Home, then Overview on the web UI
Select number displayed on the Critical severity
Clear all filters then add the filter data.wineventda.image is C:\Windows\SYSWOW64\regsvr32.exe
Troubleshooting Index Patterns
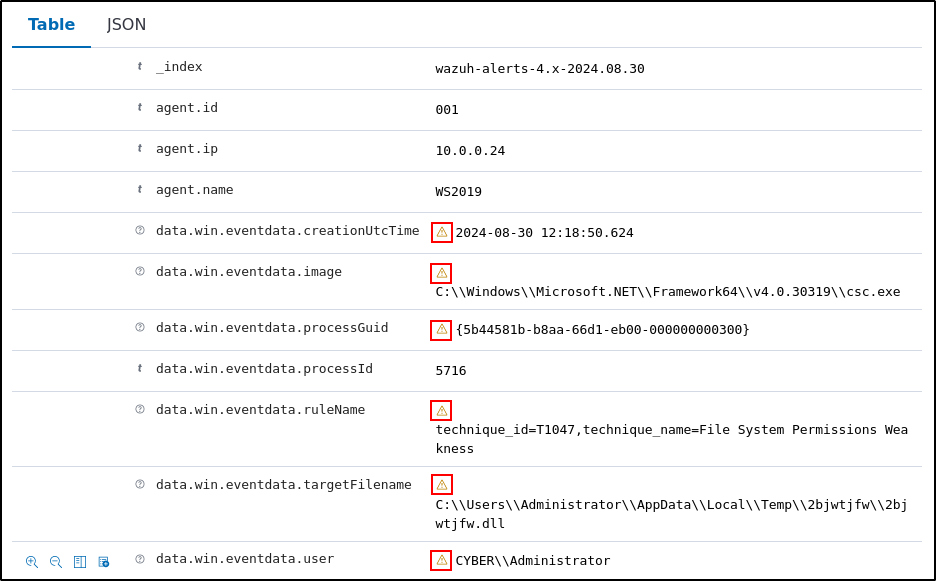
If search results displays the error icon and the message “No cached mapping for this field. Refresh field list from the index patterns page,” go to Dashboard Management, Index patterns and select each index. Click refresh button.
Detecting Suspicious Binaries (Testing Endpoint Security)
Wazuh has anomaly and malware detection capabilities that detect suspicious binaries on an endpoint. Binaries are executable code written to perform automated tasks. Malicious actors use them mostly to carry out exploitation to avoid being detected.
In this use case, we demonstrate how the Wazuh rootcheck module can detect a trojan system binary on an Ubuntu endpoint. You perform the exploit by replacing the content of a legitimate binary with malicious code to trick the endpoint into running it as the legitimate binary.
The Wazuh rootcheck module also checks for hidden processes, ports, and files.
Configuration
Take the following steps on the Ubuntu endpoint to enable the Wazuh rootcheck module and perform anomaly and malware detection.
By default, the Wazuh rootcheck module is enabled in the Wazuh agent configuration file. Check the <rootcheck> block in the /var/ossec/etc/ossec.conf configuration file of the monitored endpoint and make sure that it has the configuration below:
<rootcheck>
    <disabled>no</disabled>
    <check_files>yes</check_files>

    <!-- Line for trojans detection -->
    <check_trojans>yes</check_trojans>

    <check_dev>yes</check_dev>
    <check_sys>yes</check_sys>
    <check_pids>yes</check_pids>
    <check_ports>yes</check_ports>
    <check_if>yes</check_if>

    <!-- Frequency that rootcheck is executed - every 12 hours -->
    <frequency>43200</frequency>
    <rootkit_files>/var/ossec/etc/shared/rootkit_files.txt</rootkit_files>
    <rootkit_trojans>/var/ossec/etc/shared/rootkit_trojans.txt</rootkit_trojans>
    <skip_nfs>yes</skip_nfs>
</rootcheck>
Attack Emulation
Create a copy of the original system binary:
Replace the original system binary /usr/bin/w with the following shell script:
sudo tee /usr/bin/w << EOF
!/bin/bash
echo "`date` this is evil" > /tmp/trojan_created_file
echo 'test for /usr/bin/w trojaned file' >> /tmp/trojan_created_file
Now running original binary
/usr/bin/w.copy
EOF
The rootcheck scan runs every 12 hours by default. Force a scan by restarting the Wazuh agent to see the relevant alert:
Visualising Alerts
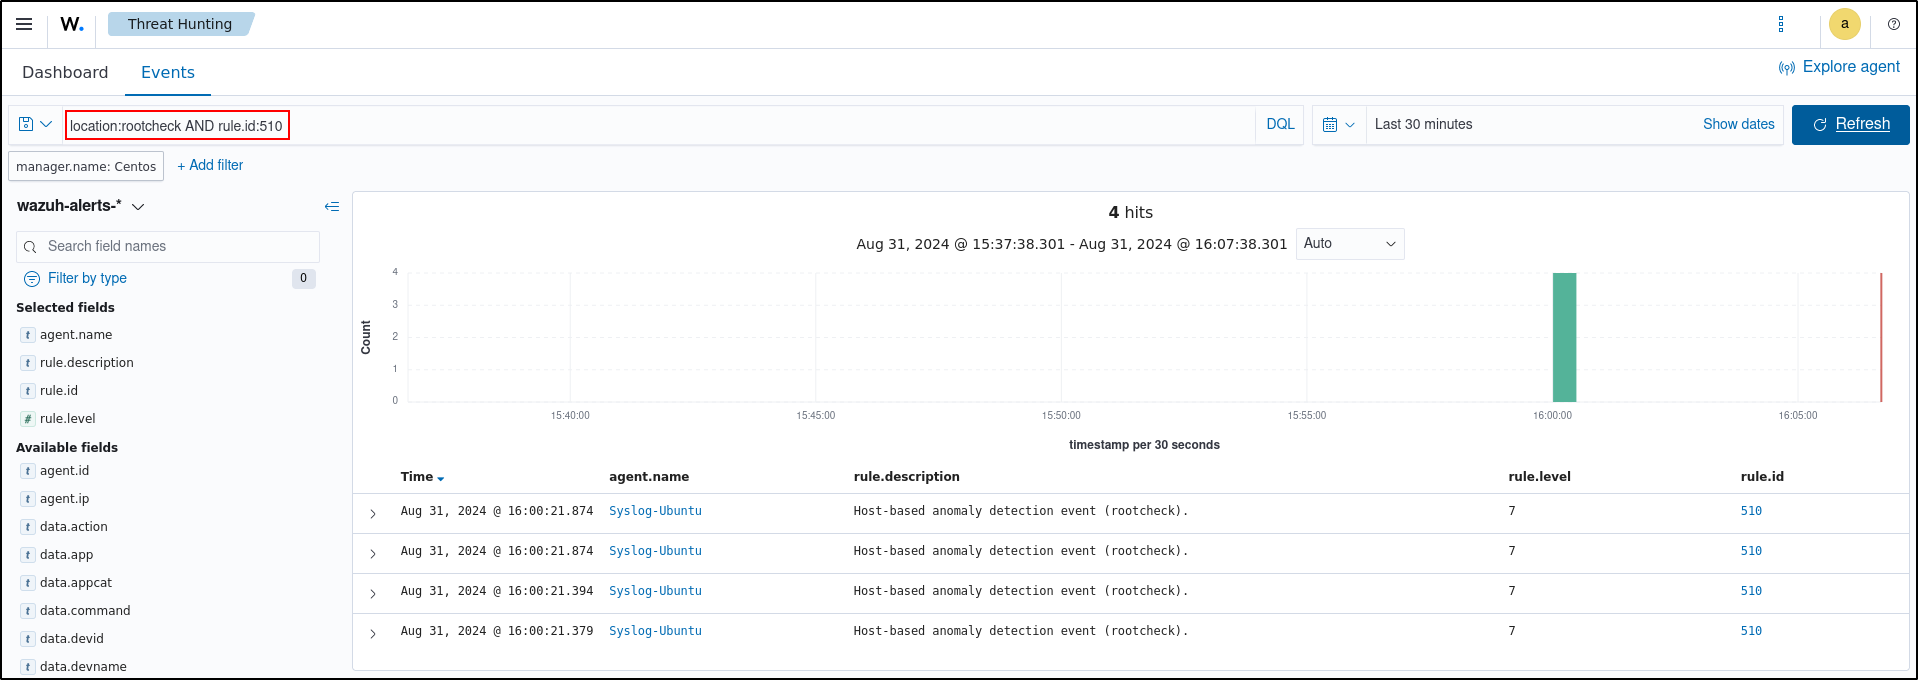
You can visualise the alert data in the Wazuh dashboard. To do this, go to the Threat Hunting module and add the filters in the search bar to query the alerts.
location:rootcheck AND rule.id:510
File Integrity Monitoring (Testing Endpoint Security)
File Integrity Monitoring (FIM) helps in auditing sensitive files and meeting regulatory compliance requirements. Wazuh has an inbuilt FIM module that monitors file system changes to detect the creation, modification, and deletion of files.
Configuring Ubuntu Endpoint
Edit the Wazuh agent /var/ossec/etc/ossec.conf configuration file. Add the directories for monitoring within the <syscheck> block. For this use case, you configure Wazuh to monitor the /root directory.
Restart the Wazuh agent to apply the configuration changes:
Testing Configuration
- Create a text file in the monitored directory then wait for 5 seconds.
- Add content to the text file and save it. Wait for 5 seconds.
- Delete the text file from the monitored directory.
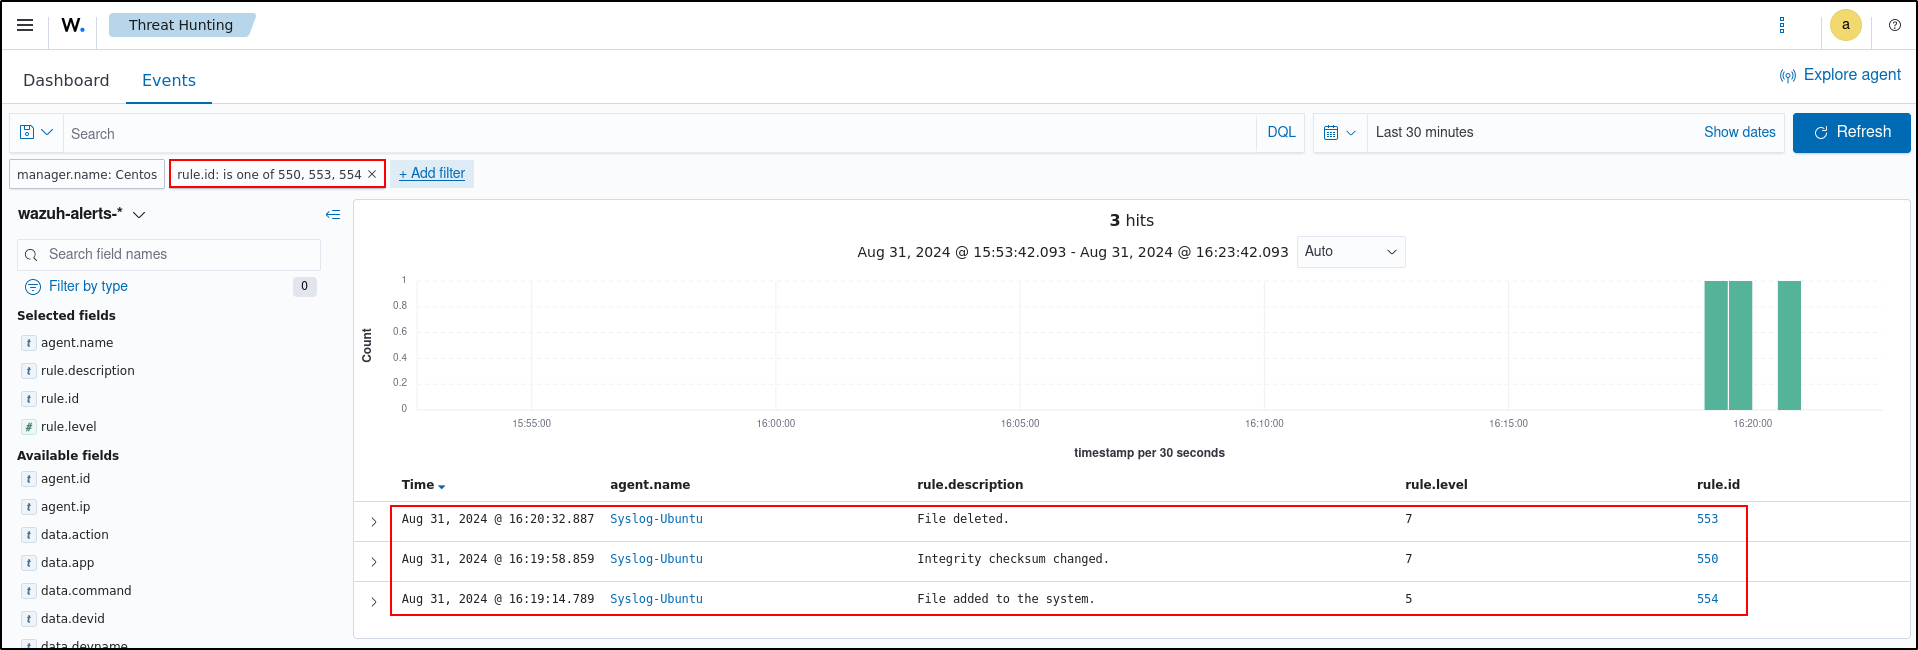
Visualising Alerts
You can visualise the alert data in the Wazuh dashboard. To do this, go to the File Integrity Monitoring module and add the filters in the search bar to query the alerts:rule.id: is one of 550,553,554
Vulnerability Detection (Testing Threat Intelligence)
Wazuh uses the Vulnerability Detection module to identify vulnerabilities in applications and operating systems running on endpoints.
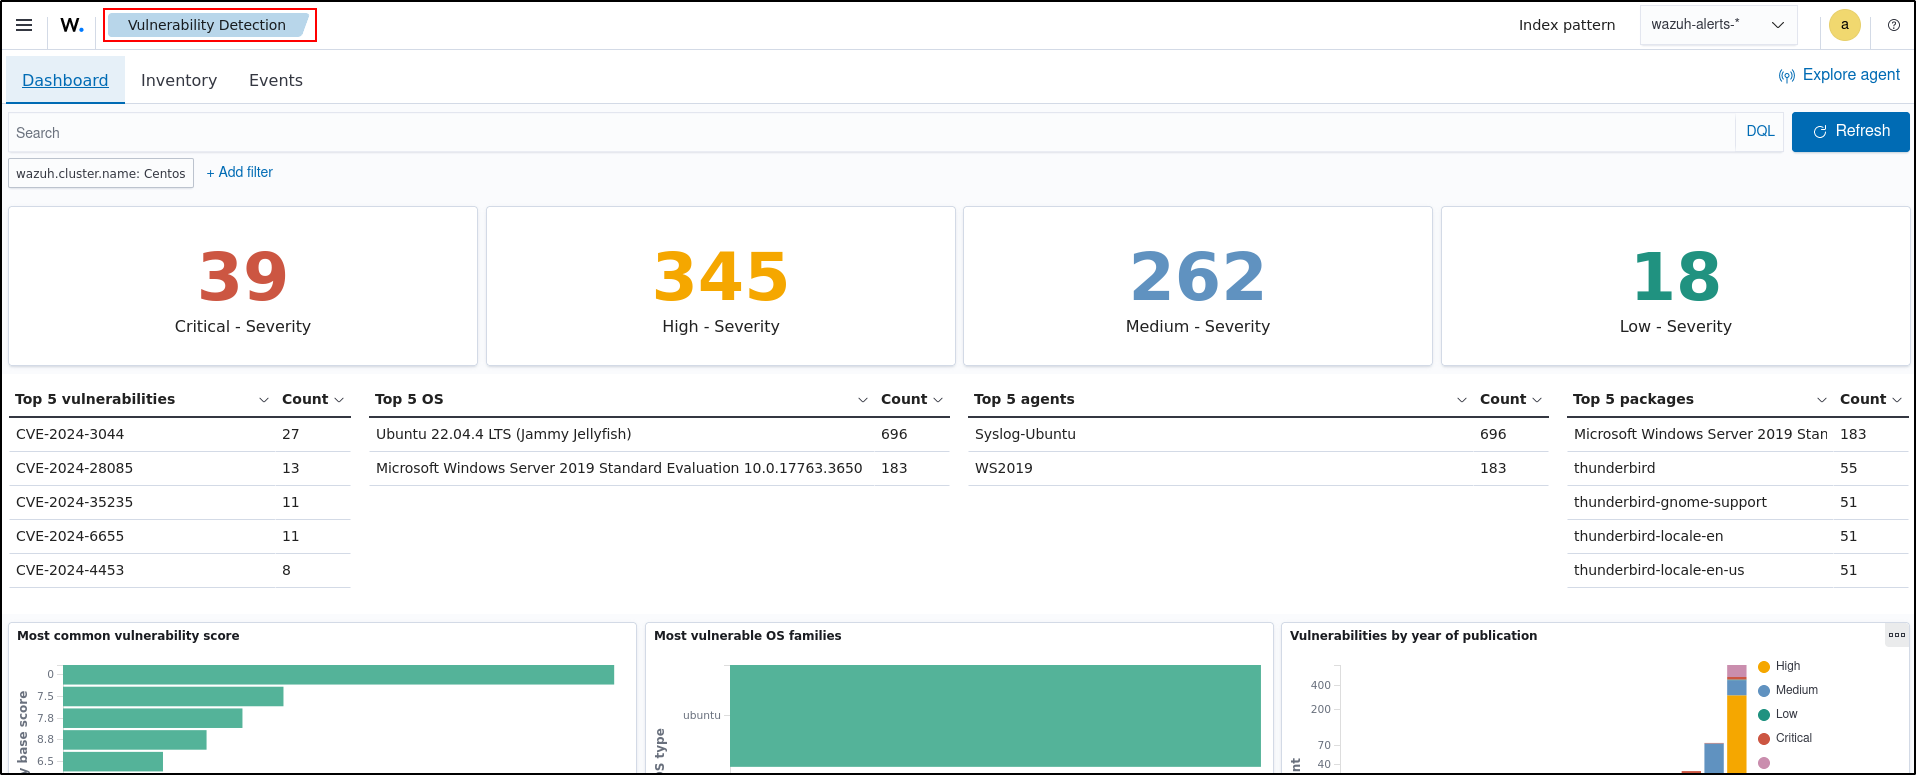
This use case shows how Wazuh detects unpatched Common Vulnerabilities and Exposures (CVEs) in the monitored endpoint.
Configuration
The Vulnerability Detection module is enabled by default. You can perform the following steps on the Wazuh server to ensure that the Wazuh Vulnerability Detection module is enabled and properly configured.
Open the /var/ossec/etc/ossec.conf file on the Wazuh server. Check the following settings.
Vulnerability Detection is enabled:
<vulnerability-detection>
   <enabled>yes</enabled>
   <index-status>yes</index-status>
   <feed-update-interval>60m</feed-update-interval>
</vulnerability-detection>
The indexer connection is properly configured. By default, the indexer settings have one host configured. It's set to 0.0.0.0 as highlighted below.
<indexer>
  <enabled>yes</enabled>
  <hosts>
    <host>https://0.0.0.0:9200</host>
  </hosts>
  <ssl>
    <certificate_authorities>
      <ca>/etc/filebeat/certs/root-ca.pem</ca>
    </certificate_authorities>
    <certificate>/etc/filebeat/certs/filebeat.pem</certificate>
    <key>/etc/filebeat/certs/filebeat-key.pem</key>
  </ssl>
</indexer>
Replace 0.0.0.0 with your Wazuh indexer node IP address or hostname. You can find this value in the Filebeat config file /etc/filebeat/filebeat.yml. Ensure the Filebeat certificate and key name match the certificate files in /etc/filebeat/certs. If you made changes to the configuration, restart the Wazuh manager.
Visualising Alerts
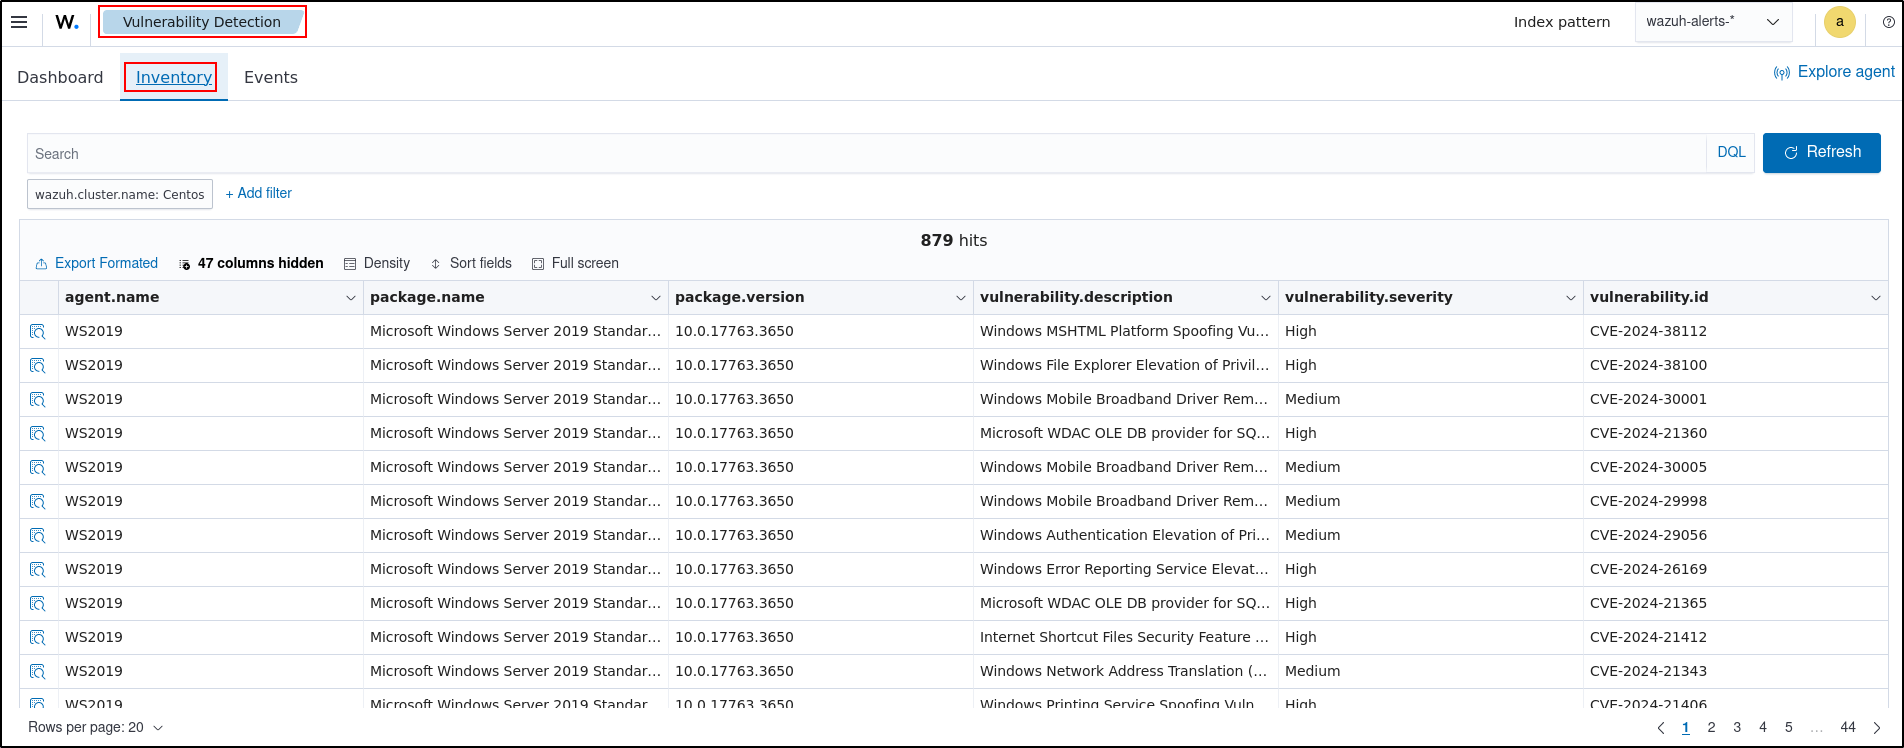
You can visualise the detected vulnerabilities in the Wazuh dashboard. To see a list of active vulnerabilities, go to Vulnerability Detection and select Inventory.
Incident Response
The goal of incident response is to effectively handle a security incident and restore normal business operations as quickly as possible. As organizations’ digital assets continuously grow, managing incidents manually becomes increasingly challenging, hence the need for automation.
Wazuh Active Response module
The Wazuh Active Response module allows users to run automated actions when incidents are detected on endpoints. This improves an organization's incident response processes, enabling security teams to take immediate and automated actions to counter detected threats.
Default Active Response Actions
Out-of-the-box scripts are available on every operating system that runs the Wazuh agents. Some of the default active response scripts include
| Name of script | Description |
|---|---|
| disable-account | Disables a user account |
| firewall-drop | Adds an IP address to the iptables deny list. |
| firewalld-drop | Adds an IP address to the firewalld drop list. |
| restart.sh | Restarts the Wazuh agent or server. |
| netsh.exe | Blocks an IP address using netsh. |
Custom Active Response Actions
One of the benefits of the Wazuh Active Response module is its adaptability. Wazuh allows security teams to create custom active response actions in any programming language, tailoring them to their specific needs.
Disabling User Account After a Brute-Force Attack (Testing Default Active Response)
Account lockout is a security measure used to defend against brute force attacks by limiting the number of login attempts a user can make within a specified time. We use the Wazuh Active Response module to disable the user account whose password is being guessed by an attacker.
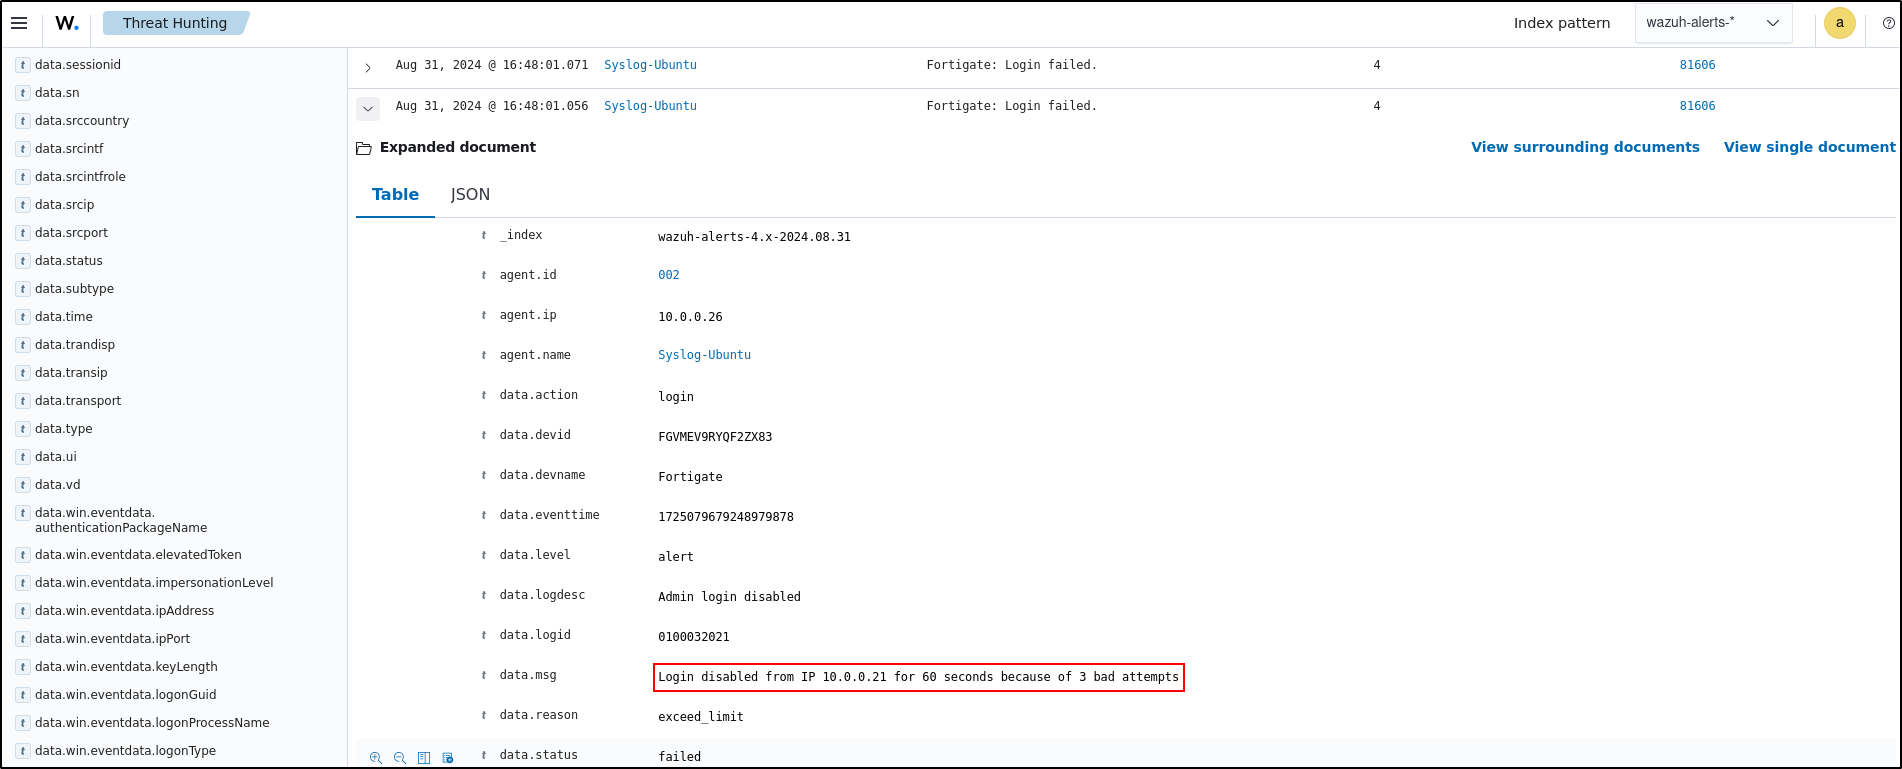
In the image below, the Wazuh Active Response module disables the account on a Linux endpoint and re-enables it again after 5 minutes.
After SSH Brute Force attack was launched from Kali machine, the login was disabled for 60 seconds because of 3 bad attempts
Blocking a Known Malicious Actor (Testing Custom Active Response)
In this use case, we demonstrate how to block malicious IP addresses from accessing web resources on a web server.
Configuring Ubuntu endpoint
Update local packages and install the Apache web server:
If the firewall is enabled, modify the firewall to allow external access to web ports. Skip this step if the firewall is disabled:
Check the status of the Apache service to verify that the web server is running:
Use the curl command or open http://<UBUNTU_IP> in a browser to view the Apache landing page and verify the installation:
Add the following to /var/ossec/etc/ossec.conf file to configure the Wazuh agent and monitor the Apache access logs:
<localfile>
  <log_format>syslog</log_format>
  <location>/var/log/apache2/access.log</location>
</localfile>
Restart the Wazuh agent to apply the changes:
Configuring the Wazuh server
Download the utilities and configure the CDB list. Download the Alienvault IP reputation database:
sudo wget https://raw.githubusercontent.com/firehol/blocklist-ipsets/master/alienvault_reputation.ipset -O /var/ossec/etc/lists/alienvault_reputation.ipset
Append the IP address of the attacker endpoint to the IP reputation database. Replace <ATTACKER_IP> with the Kali IP address in the command below:
Download a script to convert from the .ipset format to the .cdb list format:
Convert the alienvault_reputation.ipset file to a .cdb format using the previously downloaded script:
sudo /var/ossec/framework/python/bin/python3 /tmp/iplist-to-cdblist.py /var/ossec/etc/lists/alienvault_reputation.ipset /var/ossec/etc/lists/blacklist-alienvault
Assign the right permissions and ownership to the generated file:
Configure the active response module to block the malicious IP address
Add a custom rule to trigger a Wazuh active response script. Do this in the Wazuh server /var/ossec/etc/rules/local_rules.xml custom ruleset file:
<group name="attack,">
  <rule id="100100" level="10">
    <if_group>web|attack|attacks</if_group>
    <list field="srcip" lookup="address_match_key">etc/lists/blacklist-alienvault</list>
    <description>IP address found in AlienVault reputation database.</description>
  </rule>
</group>
Edit the Wazuh server /var/ossec/etc/ossec.conf configuration file and add the etc/lists/blacklist-alienvault list to the <ruleset> section:
<ossec_config>
  <ruleset>
    <!-- Default ruleset -->
    <decoder_dir>ruleset/decoders</decoder_dir>
    <rule_dir>ruleset/rules</rule_dir>
    <rule_exclude>0215-policy_rules.xml</rule_exclude>
    <list>etc/lists/audit-keys</list>
    <list>etc/lists/amazon/aws-eventnames</list>
    <list>etc/lists/security-eventchannel</list>
    <list>etc/lists/blacklist-alienvault</list>

    <!-- User-defined ruleset -->
    <decoder_dir>etc/decoders</decoder_dir>
    <rule_dir>etc/rules</rule_dir>
  </ruleset>

</ossec_config>
Add the active response block to the Wazuh server /var/ossec/etc/ossec.conf file:
The firewall-drop command integrates with the Ubuntu local iptables firewall and drops incoming network connection from the attacker endpoint for 60 seconds:
Remember to uncomment the code block (remove <!-- and --> )
<ossec_config>
  <active-response>
    <command>firewall-drop</command>
    <location>local</location>
    <rules_id>100100</rules_id>
    <timeout>60</timeout>
  </active-response>
</ossec_config>
Restart the Wazuh manager to apply the changes:
Attack Emulation
Access any of the web servers from the Kali endpoint using the corresponding IP address. Replace <WEBSERVER_IP> with the appropriate value and execute the following command from the attacker endpoint:
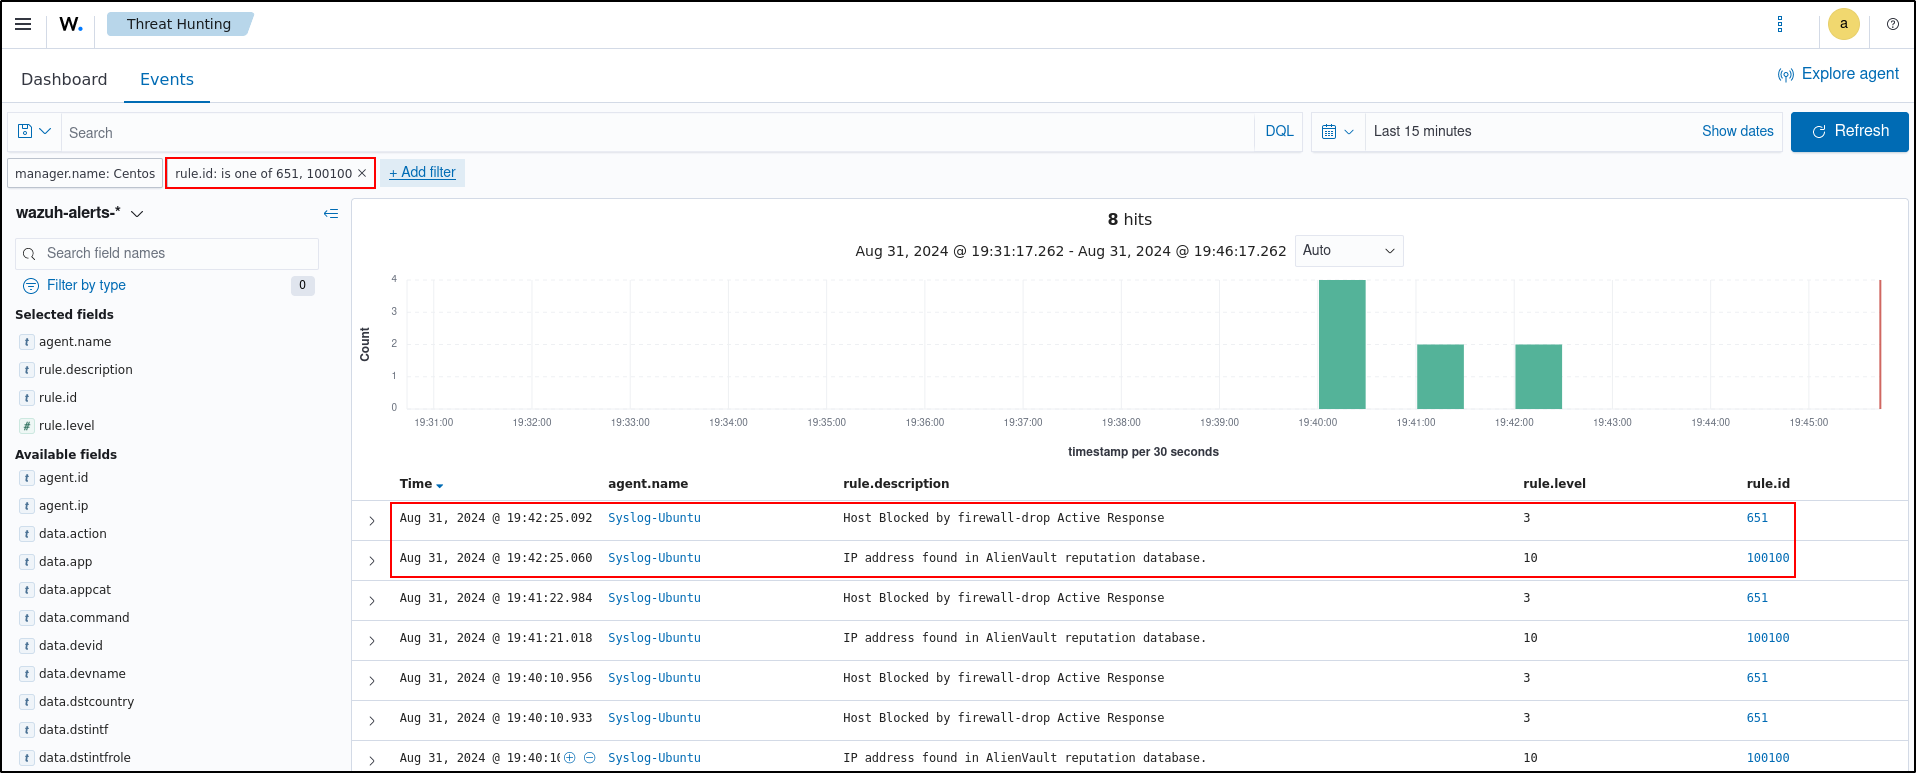
The attacker endpoint connects to the victim's web servers the first time. After the first connection, the Wazuh active response module temporarily blocks any successive connection to the web servers for 60 seconds.
Visualising Alerts
You can visualize the alert data in the Wazuh dashboard. To do this, go to the Threat Hunting module and add the filters in the search bar to query the alerts: rule.id is one of 651, 100100
Network IDS integration
Snort3
Install Wazuh agent on a Linux host where Snort3 is installed. Edit Snort’s configuration:
Uncomment alert_full and add file=true
---------------------------------------------------------------------------
-- 7. configure outputs
---------------------------------------------------------------------------

-- event logging
-- you can enable with defaults from the command line with -A <alert_type>
-- uncomment below to set non-default configs
--alert_csv = { }
--alert_fast = {file=true}
alert_full = {file=true}
--alert_sfsocket = { }
--alert_syslog = { }
--unified2 = { }
Edit the /var/ossec/etc/ossec.conf file of Wazuh agent and add the new localfile entry:
Make sure indentation is correct.
<localfile>
  <log_format>snort-full</log_format>
  <location>/var/log/snort/alert_full.txt</location>
</localfile>
Restart the Wazuh agent.
Run Snort3 with the following parameters:
Note: Snort3 is currently configured to read local.rules for demonstration purposes.
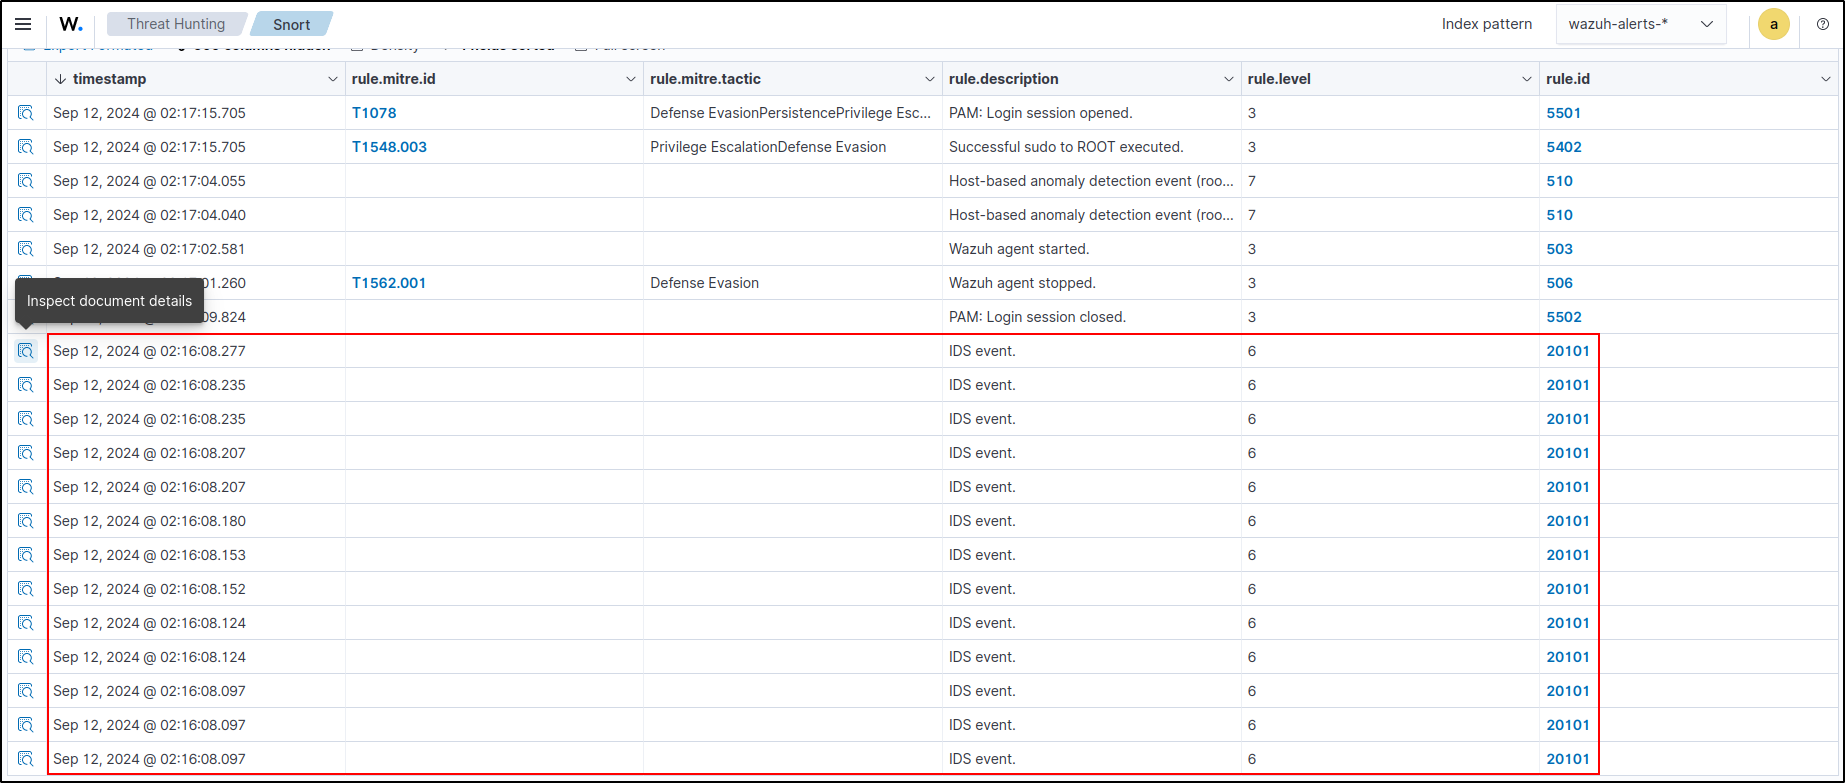
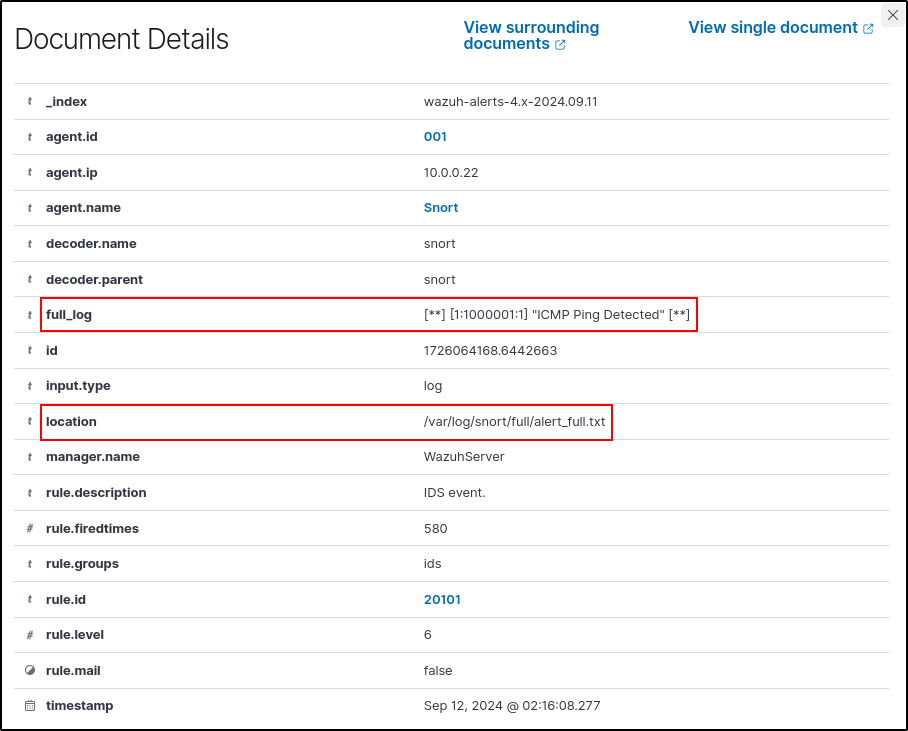
Execute ping to 10.0.0.22 (Snort3 VM) from another host. Verify alert_full.txt is generated
On Wazuh dashboard, verify IDS Event alerts are generated and it points to alert_full.txt
Suricata
Install Wazuh agent on a Linux host where Suricata is installed. Changes the permissions of all files in the Suricata’s /rules/ directories:
Modify Suricata settings in the /etc/suricata/suricata.yaml file and set the following variables:
vars:
  # more specific is better for alert accuracy and performance
  address-groups:
    HOME_NET: "[10.0.0.0/24]"
...
community-id: true
...
af-packet:
    - interface: ens32
      cluster-id: 99
      cluster-type: cluster_flow
      defrag: yes
      use-mmap: yes
...
# Cross platform libpcap capture support
pcap:
  - interface: ens32
interface represents the network interface you want to monitor. Replace the value with the interface name of the Ubuntu endpoint. For example, ens32
Restart the Suricata service:
Add the following configuration to the /var/ossec/etc/ossec.conf file of the Wazuh agent. This allows the Wazuh agent to read the Suricata logs file:
<ossec_config>
  <localfile>
    <log_format>json</log_format>
    <location>/var/log/suricata/eve.json</location>
  </localfile>
</ossec_config>
Restart the Wazuh agent to apply the changes:
Attack Emulation
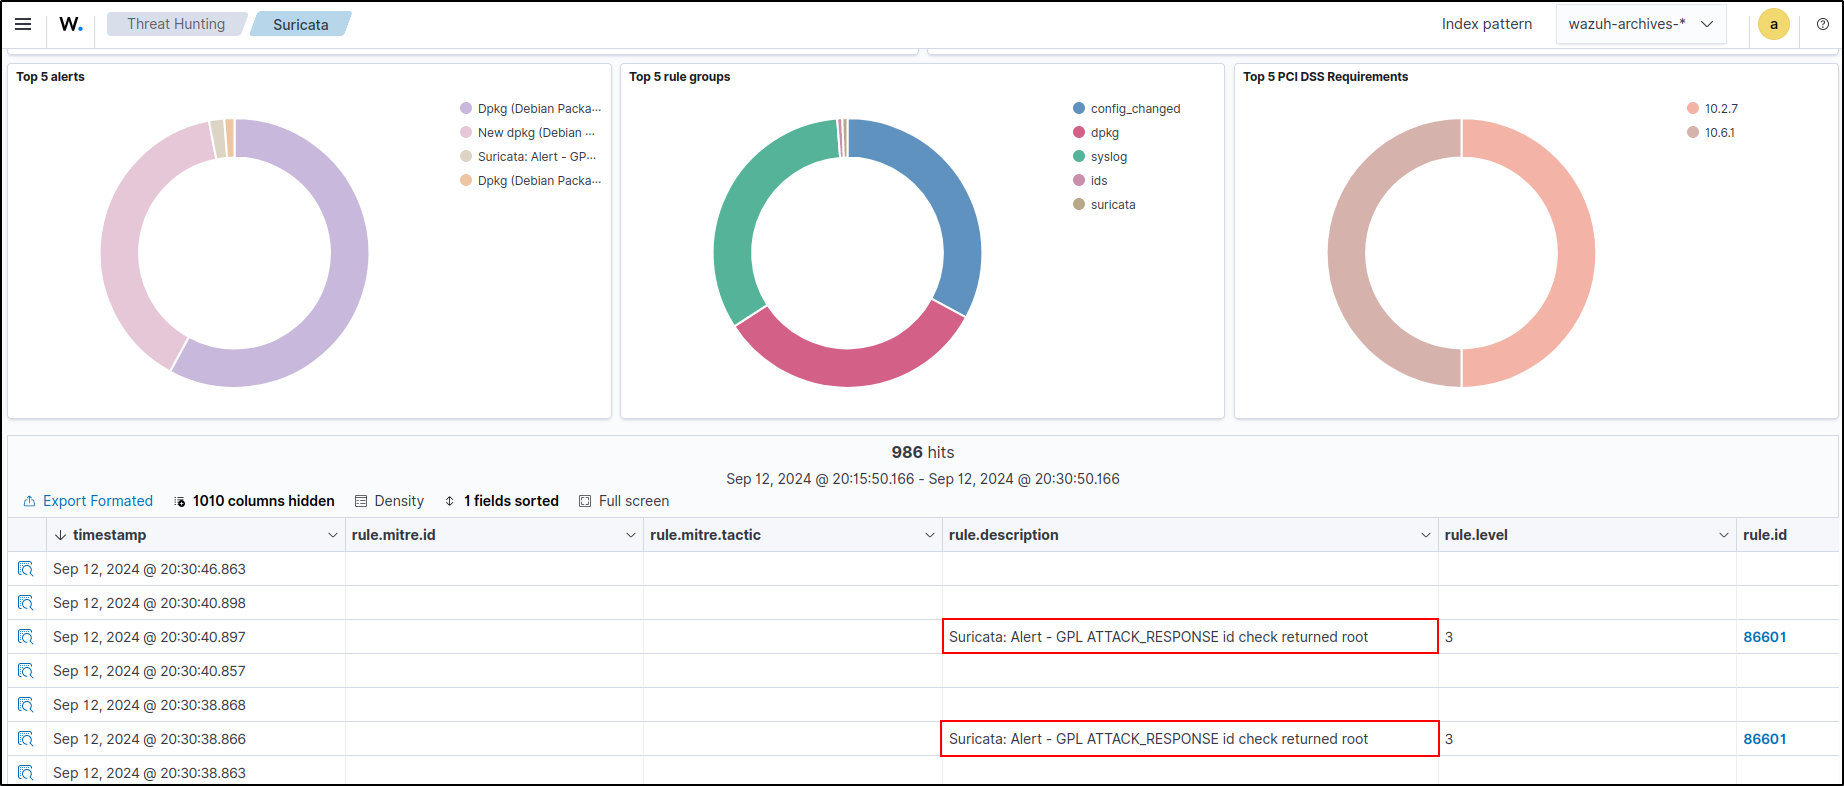
Wazuh automatically parses data from /var/log/suricata/eve.json and generates related alerts on the Wazuh dashboard. From the Ubuntu host, run:
Expected response should be similar to:
09/12/2024-13:51:32.520238 [**] [1:2100498:7] GPL ATTACK_RESPONSE id check returned root [**] [Classification: Potentially Bad Traffic] [Priority: 2] {TCP} 65.9.141.53:80 -> 10.0.0.25:34606Alerts:
Verify the results in Wazuh dashboard. Naviage to Threat Hunting > Suricata
References
- https://www.youtube.com/watch?v=Lb_ukgtYK_U&list=PLG6KGSNK4PuBWmX9NykU0wnWamjxdKhDJ&index=5
- https://documentation.wazuh.com/current/deployment-options/offline-installation.html
- https://wazuh.com/blog/monitoring-network-devices/?highlight=network device
- https://dorian5.medium.com/rsyslog-setup-on-ubuntu-for-fortigate-log-data-9d6c651acbd0
- https://wazuh.com/blog/monitoring-network-devices/?highlight=network device
- https://wazuh.com/blog/creating-decoders-and-rules-from-scratch/?highlight=fortigate
