Suricata
Suricata is an open-source network threat detection engine developed by the Open Information Security Foundation (OISF). It provides capabilities for real-time intrusion detection (IDS), inline intrusion prevention (IPS), network security monitoring (NSM), and offline packet capture (pcap) processing.
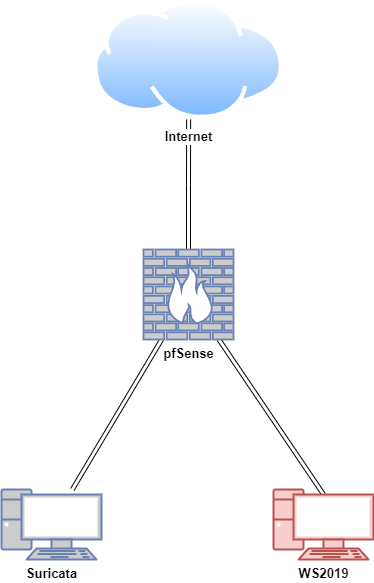
Lab Setup for Proof of Concept
In this proof of concept, instead of simulating attacks, the Windows host acted as a compromised machine where malicious websites were visited to trigger alerts in a safe and controlled setting.
| Host | OS | Role | IP Address |
|---|---|---|---|
| pfsense | FreeBSD (pfSense v2.7.2) | Firewall/Router (Gateway IDS/IPS) | 192.168.1.200 (WAN) / 10.0.0.2 (LAN) |
| Suricata | Ubuntu 22.04 LTS | Host IDS/IPS | 10.0.0.27 |
| WS2019 | Windows Server 2019 | Compromised machine | 10.0.0.24 |
Install Suricata on Host
In this demonstration, we will be installing Suricata on the Ubuntu virtual machine. We will be simulating install in an air-gapped environment but note that some parts of the step requires internet connection.
On a Ubuntu machine with internet access Add the necessary repository for Suricata:
sudo apt-get install software-properties-common
sudo add-apt-repository ppa:oisf/suricata-stable
sudo apt-get update
Create a directory to store Suricata. Adjust the directory permissions:
Download the Suricata package and all its dependencies:
Download the Emerging Threats Open rule set:
sudo apt-get download suricata
sudo wget https://rules.emergingthreats.net/open/suricata-7.0.6/emerging.rules.tar.gz
Create a directory to store dependencies. Adjust the directory permissions:
Download the required dependencies
sudo apt-get download autoconf automake build-essential cargo cbindgen \
    libjansson-dev libpcap-dev libpcre2-dev libtool libyaml-dev make \
    pkg-config rustc zlib1g-dev libc6-dev gcc g++ dpkg-dev binutils \
    libpcre2-16-0 libpcre2-posix3 libdpkg-perl libstd-rust-dev libssh2-1 \
    libpcap0.8-dev m4 autotools-dev binutils-common libbinutils \
    binutils-x86-64-linux-gnu g++-11 gcc-11 libc-dev-bin linux-libc-dev \
    libcrypt-dev rpcsvc-proto libtirpc-dev libnsl-dev libdbus-1-dev \
    libstd-rust-1.75 libctf-nobfd0 libctf0 lto-disabled-list libstdc++-11-dev \
    libcc1-0 libgcc-11-dev libsigsegv2 libc6=2.35-0ubuntu3.8 libitm1 \
    libasan6 liblsan0 libtsan0 libubsan1 libquadmath0 \
    libevent-pthreads-2.1-7 libhiredis0.14 libhtp2 libhyperscan5 \
    libluajit-5.1-2 libnet1 libnetfilter-queue1 libluajit-5.1-common \
    liblzma-dev libevent-core-2.1-7 curl jq libcurl4=7.81.0-1ubuntu1.17 libjq1=1.6-2.1ubuntu3 libonig5 libc6-dbg libc6 zlib1g
Transfer suricata-offline folder to /opt directory in Ubuntu machine without internet access.
Install dependencies and suricata
Install Suricata
After installing Suricata, you can check which version of Suricata you have running and with what options, as well as the service state:
Suricata is running in exited state, which typically indicates that the service started successfully and then exited without issues because it's running in IDS mode.
Basic setup
First, determine the interface(s) and IP address(es) on which Suricata should be inspecting network packets:
ip a
...
2: ens32: <BROADCAST,MULTICAST,UP,LOWER_UP> mtu 1500 qdisc fq_codel state UP group default qlen 1000
    link/ether 00:0c:29:51:ef:1b brd ff:ff:ff:ff:ff:ff
    altname enp2s0
    inet 10.0.0.25/24 brd 10.0.0.255 scope global noprefixroute ens32
Use that information to configure Suricata:
Specify internal network in the HOME_NET
Specify network interface in af-packet and pcap.
Set use-mmap to yes.
Set community-id to true
vars:
  # more specific is better for alert accuracy and performance
  address-groups:
    HOME_NET: "[10.0.0.0/24]"
...
community-id: true
...
af-packet:
    - interface: ens32
      cluster-id: 99
      cluster-type: cluster_flow
      defrag: yes
      use-mmap: yes
...
# Cross platform libpcap capture support
pcap:
  - interface: ens32

 checksum-validation: no
Suricata-update offline
Run suricata-update to update rules and create /var/lib/suricata folder
Note it is expected to get the error “Failed to fetch https://rules.emergingthreats.net/open/suricata-7.0.6/emerging.rules.tar.gz:”
Make a folder called suricata-rules and extract emerging.rules.tar.gz to that directory
sudo mkdir suricata-rules
sudo tar -xvzf emerging.rules.tar.gz -C /opt/suricata-offline/suricata-rules/
Append the rules from the file to the main /var/lib/suricata/rules/suricata.rules file
sudo bash -c 'find /opt/suricata-offline/suricata-rules/rules/ -name "*.rules" -exec cat {} + >> /var/lib/suricata/rules/suricata.rules'
Suricata-update online (recommended)
Running suricata-update with internet connection simplifies the process of downloading and installing rulesets.
You can also list sources and download rules from a specific source
Summary of different license types:
- MIT is very permissive, allowing almost any use, even commercial.
- Commercial requires you to pay or subscribe for usage rights, often with strict terms.
- CC-BY-SA-4.0 requires you to give credit and share any modifications under the same license.
- GPL-3.0 requires sharing modifications under the same open-source license and offering the source code.
- Non-Commercial restricts usage to personal or non-commercial contexts.
To download the ruleset from a specific source, run:
If required, update sources
Test Suricata configuration file by running
#Example output

Notice: suricata: This is Suricata version 7.0.6 RELEASE running in SYSTEM mode
Info: cpu: CPUs/cores online: 2
Info: suricata: Running suricata under test mode
Info: suricata: Setting engine mode to IDS mode by default
Info: exception-policy: master exception-policy set to: auto
Info: logopenfile: fast output device (regular) initialized: fast.log
Info: logopenfile: eve-log output device (regular) initialized: eve.json
Info: logopenfile: stats output device (regular) initialized: stats.log
Info: detect: 1 rule files processed. 39802 rules successfully loaded, 0 rules failed, 0
Info: threshold-config: Threshold config parsed: 0 rule(s) found
Info: detect: 39805 signatures processed. 1158 are IP-only rules, 4116 are inspecting packet payload, 34321 inspect application layer, 108 are decoder event only
Notice: suricata: Configuration provided was successfully loaded. Exiting.
Note the difference in number of signatures processed, inspecting packet payload and inspect application layers when suricata-update was executed without internet access:
Info: detect: 39669 signatures processed. 1158 are IP-only rules, 4110 are inspecting packet payload, 34193 inspect application layer, 108 are decoder event only
Notice: suricata: Configuration provided was successfully loaded. Exiting.
Running Suricata
With the rules installed, Suricata can run properly and thus we restart it:
To make sure Suricata is running check the Suricata log:
The last line will be similar to this:
5933 - Suricata-Main] 2024-09-12 13:26:11 Notice: threads: Threads created -> W: 2 FM: 1 FR: 1 Engine started.
The actual thread count will depend on the system and the configuration.
To see statistics, check the stats.log file:
By default, it is updated every 8 seconds to show updated values with the current state, like how many packets have been processed and what type of traffic was decoded.
Alerting
To test the IDS functionality of Suricata it's best to test with a signature. The signature with ID 2100498 from the ET Open ruleset is written specific for such test cases.
2100498:
alert ip any any -> any any (msg:"GPL ATTACK_RESPONSE id check returned root"; content:"uid=0|28|root|29|"; classtype:bad-unknown; sid:2100498; rev:7; metadata:created_at 2010_09_23, updated_at 2010_09_23;)
The syntax and logic behind those signatures is covered in other chapters. This will alert on any IP traffic that has the content within its payload. This rule can be triggered quite easy. Before we trigger it, start tail to see updates to fast.log.
The following output should now be seen in the log:
09/12/2024-13:51:32.520238 [**] [1:2100498:7] GPL ATTACK_RESPONSE id check returned root [**] [Classification: Potentially Bad Traffic] [Priority: 2] {TCP} 65.9.141.53:80 -> 10.0.0.25:34606Alerts:
This should include the timestamp and the IP of your system.
Custom rules
Stop Suricata service:
Create local.rules
Write following rule to alert on ping to internal network (note syntax is very similar to Snort)
Edit suricata.yml
Add local.rules to rule-files
default-rule-path: /var/lib/suricata/rules

rule-files:
  - suricata.rules
  - /usr/share/suricata/rules/local.rules
Test Suricata configuration:
Start Suricata and verify it is running and active.
Execute ping to Suricata host from another host in internal network
Verify that the alerts have been logged
09/12/2024-14:14:31.052314  [**] [1:1:1] ICMP Ping Detected [**] [Classification: (null)] [Priority: 3] {ICMP} 10.0.0.25:0 -> 10.0.0.20:0
09/12/2024-14:14:57.907164  [**] [1:1:1] ICMP Ping Detected [**] [Classification: (null)] [Priority: 3] {ICMP} 10.0.0.20:3 -> 10.0.0.1:3
EVE JSON
The more advanced output is the EVE JSON output which is explained in detail in Eve JSON Output. To see what this looks like it's recommended to use jq to parse the JSON output.
Alerts:
This will display more detail about each alert with a better readability, including meta-data.
{
  "timestamp": "2024-09-12T14:21:18.932116+1200",
  "flow_id": 1750955545135946,
  "in_iface": "ens32",
  "event_type": "alert",
  "src_ip": "10.0.0.25",
  "src_port": 0,
  "dest_ip": "10.0.0.20",
  "dest_port": 0,
  "proto": "ICMP",
  "icmp_type": 0,
  "icmp_code": 0,
  "pkt_src": "wire/pcap",
  "community_id": "1:7Z0C1taw8mzKweAktDBR9AYDoBA=",
  "alert": {
    "action": "allowed",
    "gid": 1,
    "signature_id": 1,
    "rev": 1,
    "signature": "ICMP Ping Detected",
    "category": "",
    "severity": 3
  },
  "direction": "to_client",
  "flow": {
    "pkts_toserver": 1,
    "pkts_toclient": 1,
    "bytes_toserver": 98,
    "bytes_toclient": 98,
    "start": "2024-09-12T14:21:18.931964+1200",
    "src_ip": "10.0.0.20",
    "dest_ip": "10.0.0.25"
  }
}
Stats:
sudo tail -f /var/log/suricata/eve.json | jq 'select(.event_type=="stats")|.stats.capture.kernel_packets'
sudo tail -f /var/log/suricata/eve.json | jq 'select(.event_type=="stats")'
The first example displays the number of packets captured by the kernel; the second examples shows all of the statistics.
Setting up IPS inline for Linux
Setting up IPS with Netfilter
To check if you have NFQ enabled in your Suricata build, enter the following command:
and make sure that NFQueue support: yes is listed in the output.
Edit local.rules to add a sample rule for IPS mode:
#IDS Mode
alert icmp any any -> $HOME_NET any (msg: "ICMP Ping Detected"; sid:1; rev:1;)

#IPS Mode
drop icmp any any -> 1.1.1.1 any (msg:"ICMP Detected and Blocked to 1.1.1.1"; sid:2; rev:1;)
Run Suricata with the NFQ mode and use the -q option. This option tells Suricata which queue numbers it should use.
In this scenario, you are sending traffic that is generated by your computer to Suricata. Run:
If Suricata is installed on the gateway (e.g. Firewall), you can send traffic that passes through Suricata by running:
Execute ping 1.1.1.1 and check Suricata alerts:
09/14/2024-16:11:08.050136 [Drop] [**] [1:2:1] ICMP Detected and Blocked to 1.1.1.1 [**] [Classification: (null)] [Priority: 3] {ICMP} 10.0.0.27:8 -> 1.1.1.1:0
To see if you have set your iptables rules correct make sure Suricata is running and enter:
In the example you can see if packets are being logged.
Chain INPUT (policy ACCEPT 0 packets, 0 bytes)
 pkts bytes target     prot opt in     out     source               destination
 1032 1101K NFQUEUE    all  --  *      *       0.0.0.0/0            0.0.0.0/0            NFQUEUE num 0

Chain FORWARD (policy ACCEPT 0 packets, 0 bytes)
 pkts bytes target     prot opt in     out     source               destination

Chain OUTPUT (policy ACCEPT 0 packets, 0 bytes)
 pkts bytes target     prot opt in     out     source               destination
 1469  126K NFQUEUE    all  --  *      *       0.0.0.0/0            0.0.0.0/0            NFQUEUE num 0
Install Suricata on Gateway
While Suricata can be installed on a host, it can also be installed on a gateway such as pfSense. The pfSense is a free and open source firewall and router. For installing and configuring pfSense, refer to pfSense documentation and instruction video. pfSense can be downloaded from here.
Full demonstration video on configuring Suricata on pfSense can be found here.
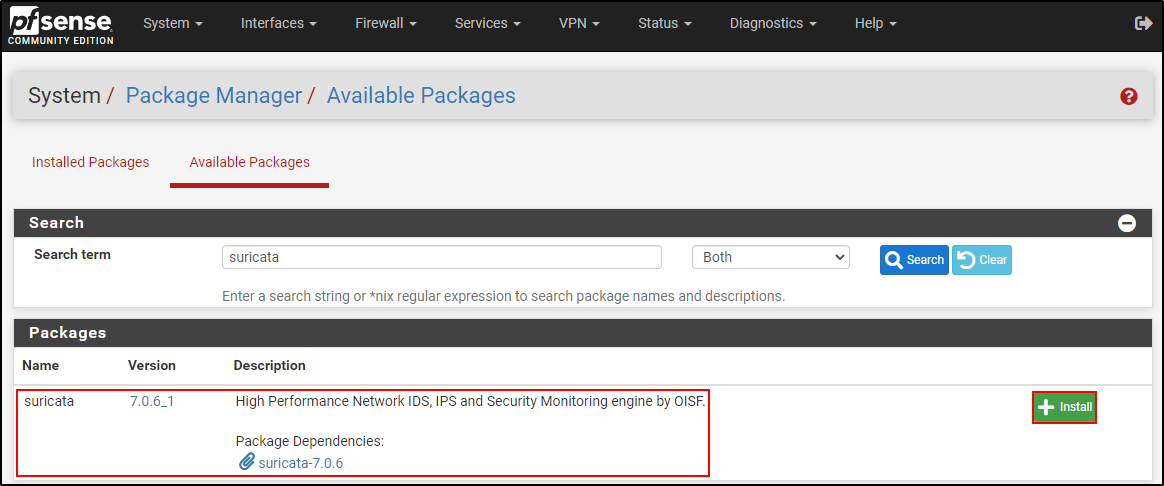
After competing basic configuration on pfSense, navigate to System > Package Manager > Available Packages on pfSense web UI.
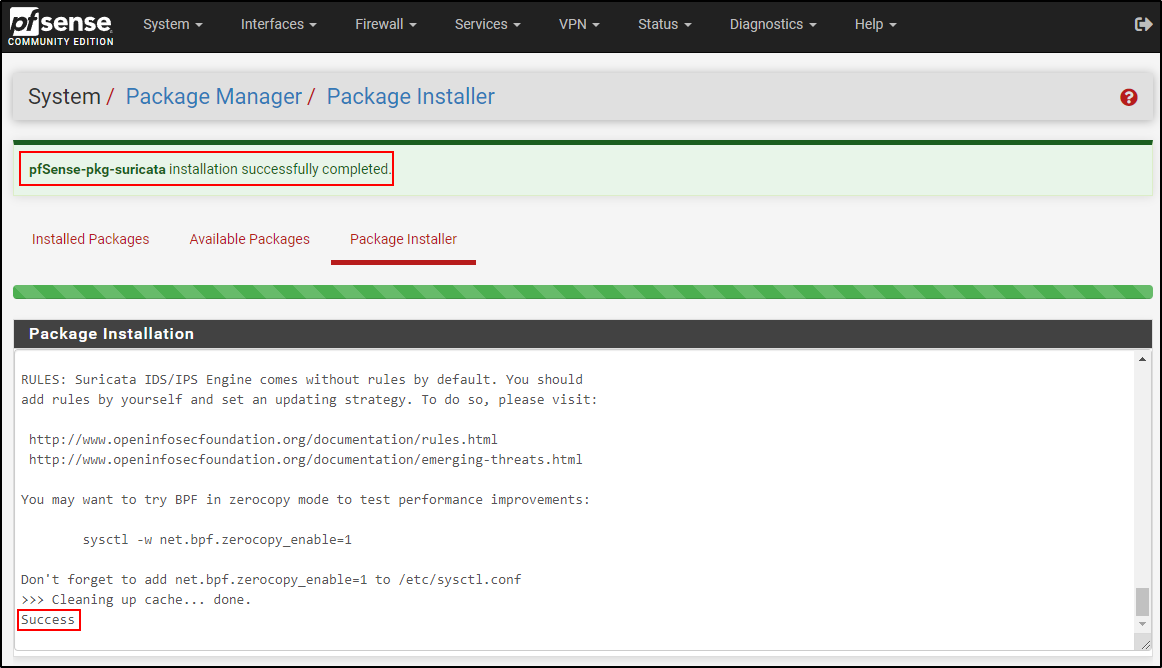
Search for suricata and click install (confirm when prompted). Internet connection is required.
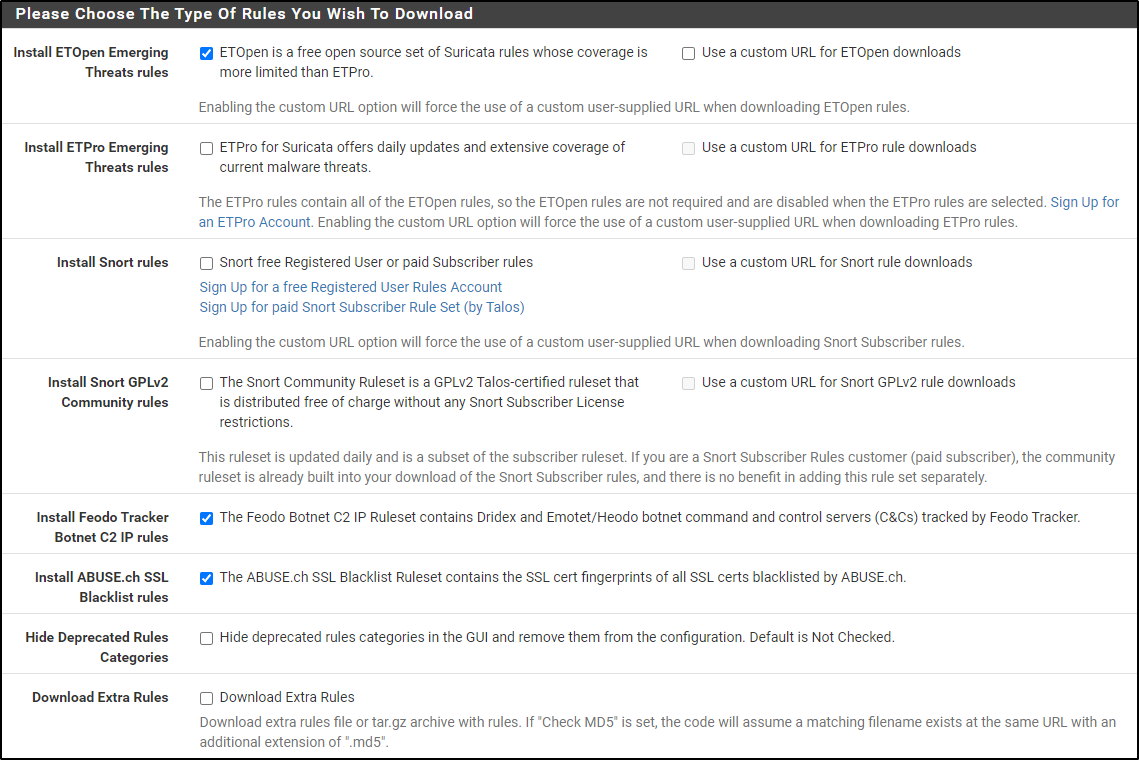
Once install is complete, navigate to Services > Suricata > Global Settings.
Select Install ETOpen Emerging Threats rules, Install Feodo Tracker Botnet C2 IP rules and Install ABUSE.ch SSL Blacklist rules.
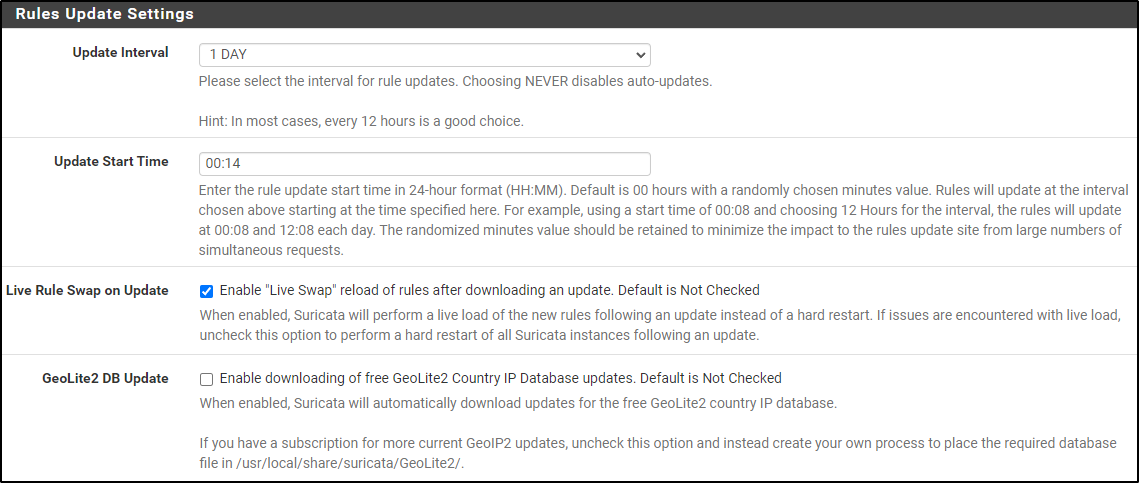
Select 1 Day for Update Interval and select Live Rule Swap on Update.
Leave rest of settings default and click save.
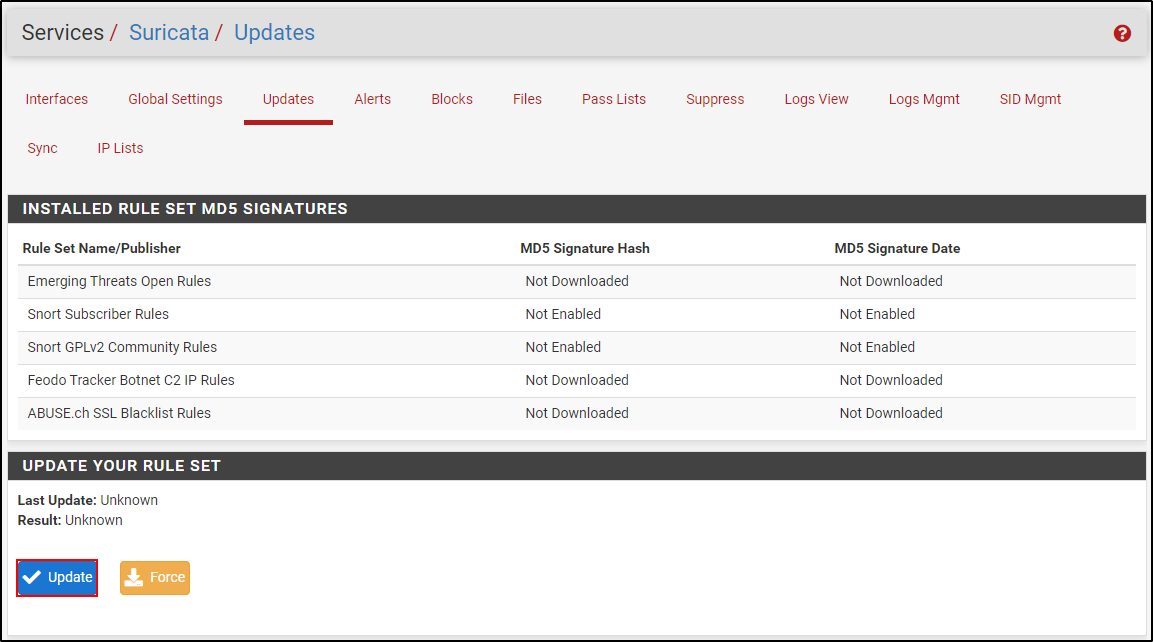
Navigate to Update section and click Update.
Once rule set update is complete, you will see timestamps of recent update.
Navigate to Interfaces section and click Add.
Select interface to run Suricata. In this demonstration, Suricata is installed on the LAN interface.
For the EVE Output Settings, select EVE JSON Log and Output Type as FILE. Leave rest of the settings as default values and click Save.
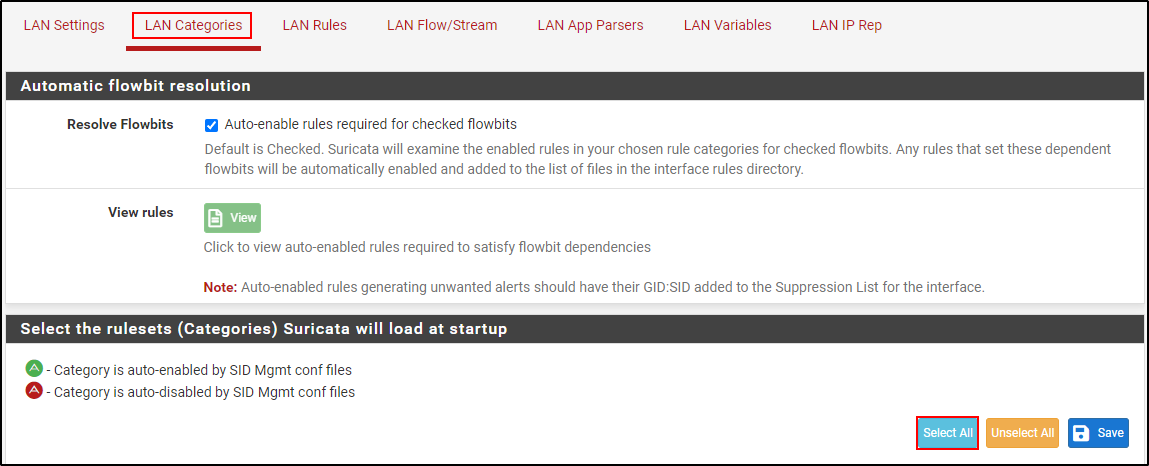
Within the Interface section, navigate to LAN Categories and Select All rulesets and click Save.
You can read about each rule in the LAN Rules section and enable certain rule instead of enabling all rules. Pointproof documentation explains about the emerging rules.
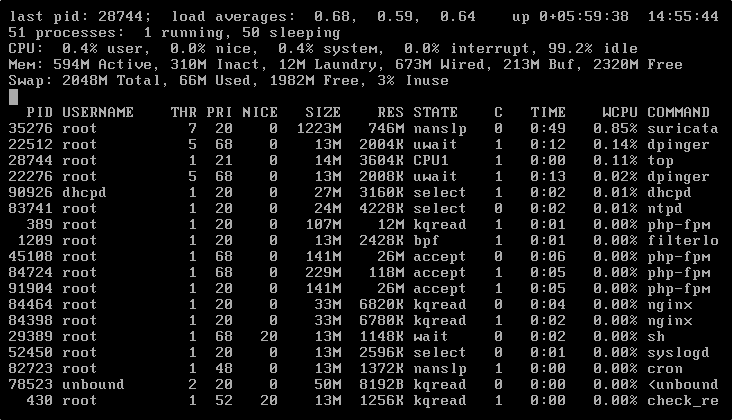
On pfSense VM, selection option 8 for shell and run top -s 1 to monitor CPU
Navigate back to Interfaces section and run Suricata by clicking the play button.
After a while, you will see a green tick box on Suricata Status, but CPU usage is still at 99%. Wait until CPU usage drops below 30% of pfSense VM CLI.
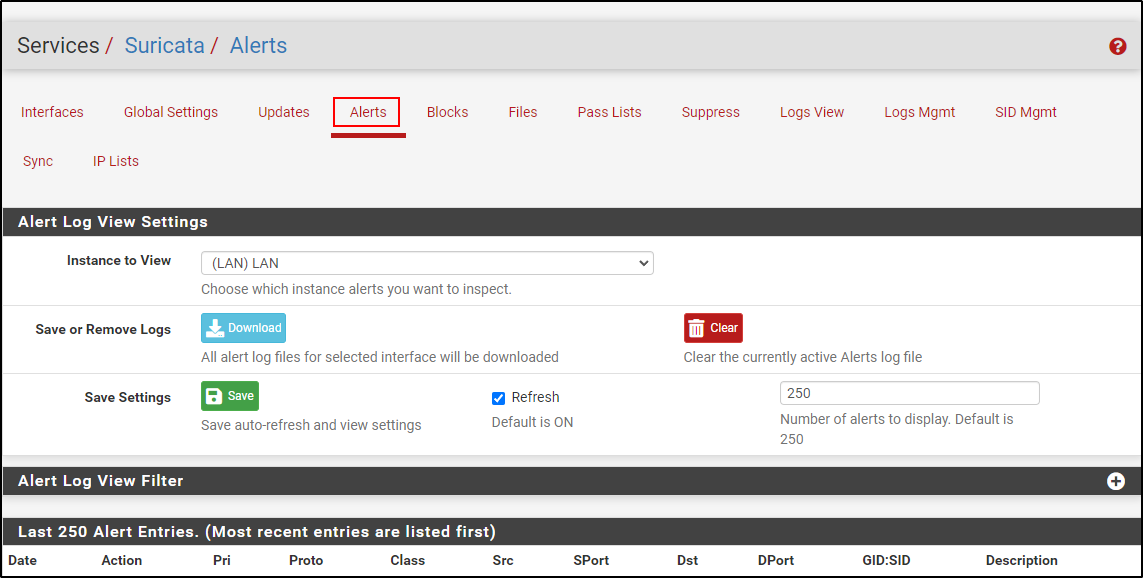
Navigate to the Alerts tab, and verify that there are no alerts.
Testing IDS
Suricata by default generates alert when a user access .to domain. From the Windows host connected to pfSense on an internal network, navigate to https://amzn.to/3xPjJbS on a web browser.
Note that the alerts have been generated but these are false positives.
Finetuning rules to reduce false positives
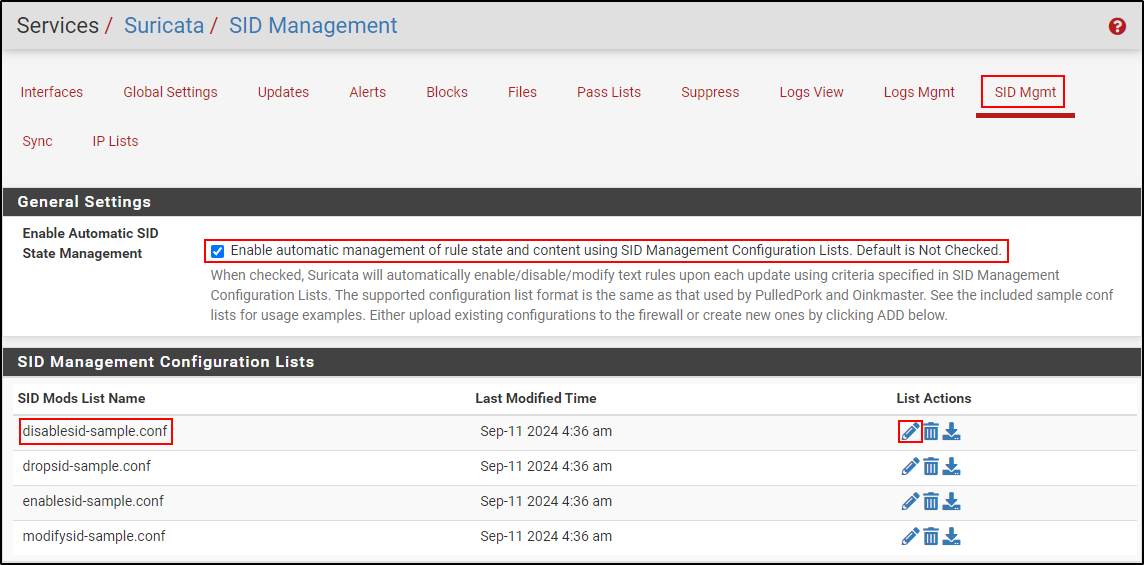
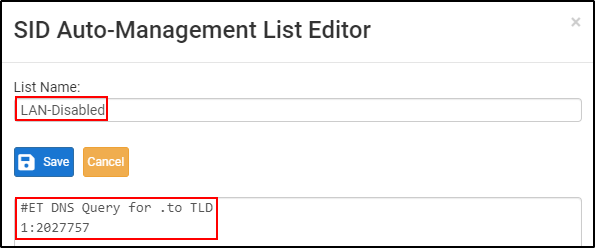
Copy GID:SID 1:2027757 . Navigate to SID Mgmt tab, select Enable Automatic SID State Management. Edit the disablesid-sample.conf
Edit the List Name as LAN-Disabled. Delete the existing content and copy and paste the following:
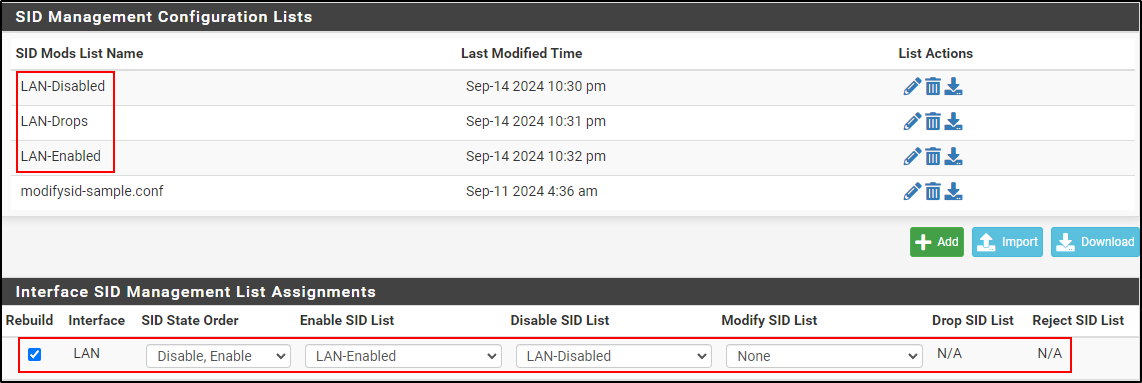
Repeat the same process for dropsid-sample.conf and enablesid-sample.conf. Change the List Name of dropsid-sample.conf to LAN-Drops and enablesid-sample.conf to LAN-Enabled. Make sure they each have nothing in the content.
For Interface SID Management List Assignments, select Rebuild. Select LAN-Enabled for Enable SID List, LAN-Disabled for Disable SID List.
Navigate back to Alerts tab and clear alerts
From the Windows host connected to pfSense on an internal network. Wait for CPU percentage to drop. Navigate to https://amzn.to/3xPjJbS on a web browser. Verify that alerts have not been generated.
Navigate to Interface Settings > LAN Rules. Select emerging-dns.rules.
Search for .to . Verify that ET DNS Query for .to TLD is Auto-disabled by settings on SID Mgmt tab.
Testing IPS
Disable Hardware Checksum Offloading. Navigate to System > Advanced > Networking.
Select Disable hardware checksum offload and save. pfSense will reboot to apply changes.
Navigate to Suricata > LAN Interface settings
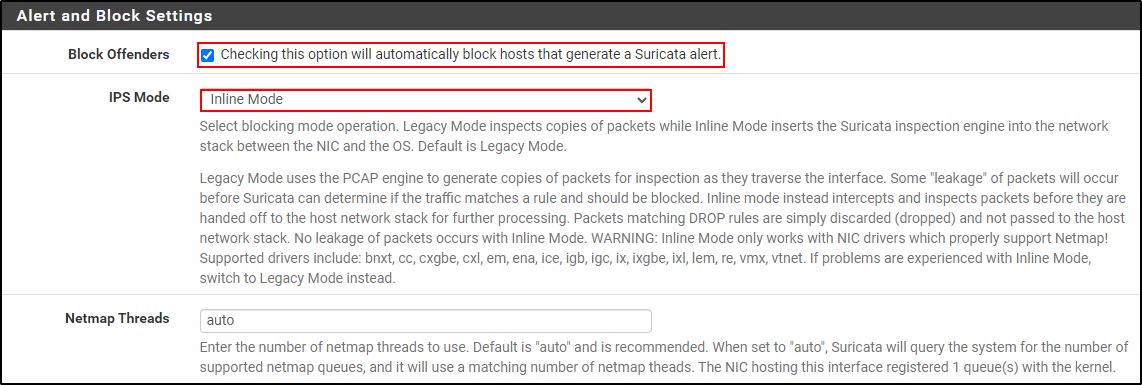
In the Alert and Block Settings, select Block Offenders and Inline mode for IPS mode.
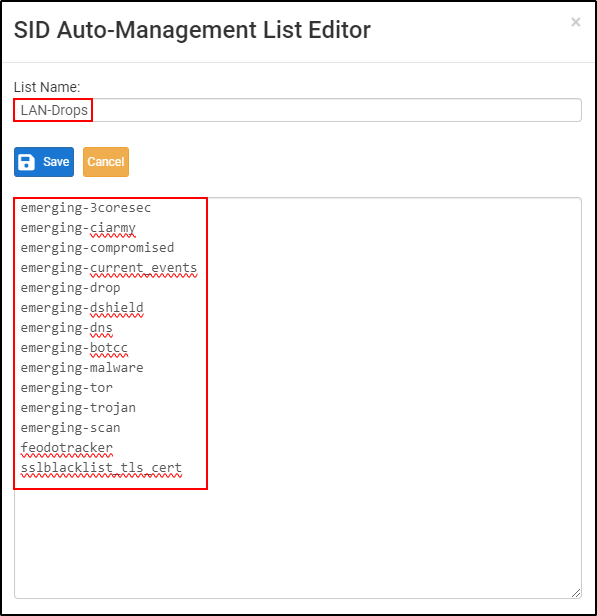
Navigate to SID Mgmt and edit LAN-Drops. Copy and paste the following list:
emerging-3coresec
emerging-ciarmy
emerging-compromised
emerging-current_events
emerging-drop
emerging-dshield
emerging-dns
emerging-botcc
emerging-malware
emerging-tor
emerging-trojan
emerging-scan
feodotracker
sslblacklist_tls_cert
For Interface SID Management List Assignments, select Rebuild and select LAN-Drops for Drop SID LIst. Click Save.
Navigate to Interface tab and restart Suricata
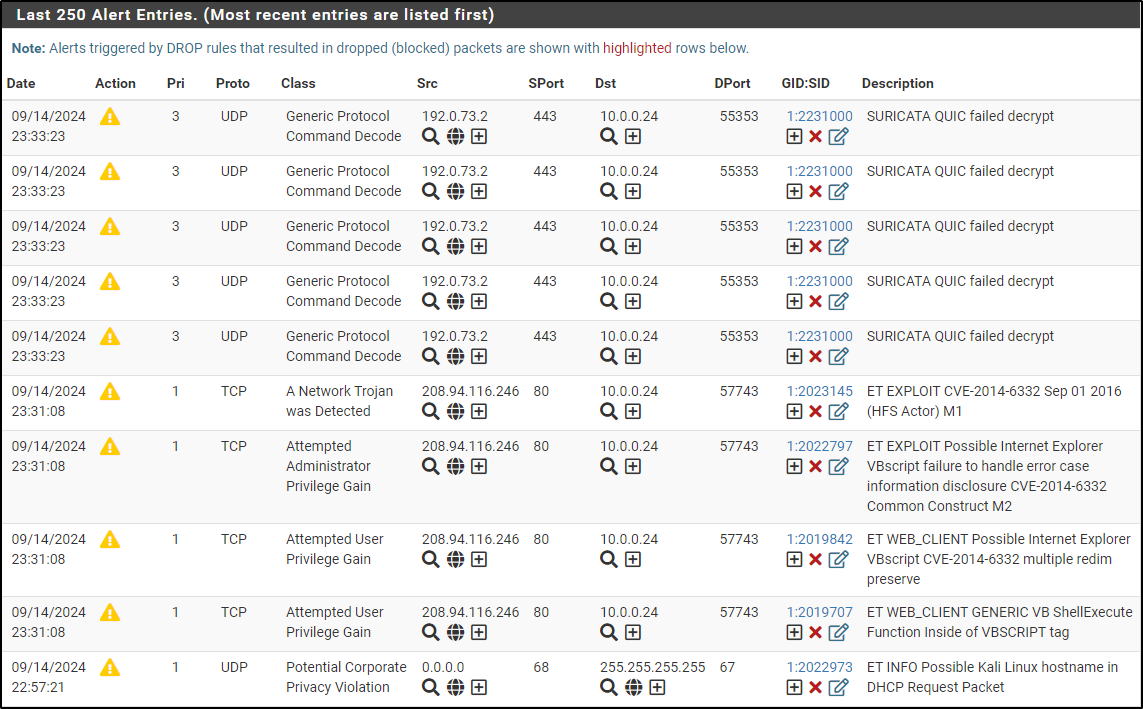
On Windows host, browse through http://malware.wicar.org/: This site hosts files and URLs that trigger IPS/IDS signatures without actually hosting real malware.
Verify that the alerts have been generated.
Part of our LAN-Drops includes a rule that will drop a traffic when a user visits .cc TLD
From Windows host, run nslookup something.cc
PS C:\Users\Administrator\Downloads> nslookup something.cc
Server:  UnKnown
Address:  ::1

DNS request timed out.
    timeout was 2 seconds.
DNS request timed out.
    timeout was 2 seconds.
*** Request to UnKnown timed-out
Alerts log shows that DNS query to .cc TLD has been dropped
References
- https://docs.suricata.io/en/latest/index.html
- https://documentation.wazuh.com/current/proof-of-concept-guide/integrate-network-ids-suricata.html
- https://youtu.be/UXKbh0jPPpg?si=9_Ry4dN7_X7HHpvH
- https://github.com/nn-df/suricata-installation-ips-mode
- https://tools.emergingthreats.net/docs/ETPro Rule Categories.pdf
