Security Onion
Security Onion is a free and open-source platform developed to help defenders monitor and investigate both network and host activity. It includes tools for packet capture, intrusion detection, log management, and case tracking.
Lab Setup for Proof of Concept
In this proof of concept, Security Onion was installed in Standalone mode, and the Elastic Agent was installed on the Windows virtual machine (VM). Test data was ingested, and threat hunting was carried out in a safe, controlled environment.
| Hostname | OS | Role | IP Address |
|---|---|---|---|
| Fortigate | Fortios 7.6.0 | Firewall/Router | 192.168.1.18 (WAN) / |
| 10.0.0.1 (LAN) | |||
| so-standalone | Oracle Linux Server 9.6 | Security Onion Manager (Standalone) | 10.0.0.100 |
| WS2019 | Windows Server 2019 | Elastic Agent (Security Onion Client) | 10.0.0.35 |

Installing Security Onion Manager (Standalone)
This section explains how to set up the Security Onion Manager in Standalone mode using VMware Workstation.
Head over to the official Security Onion download page and download the ISO file for the latest release.
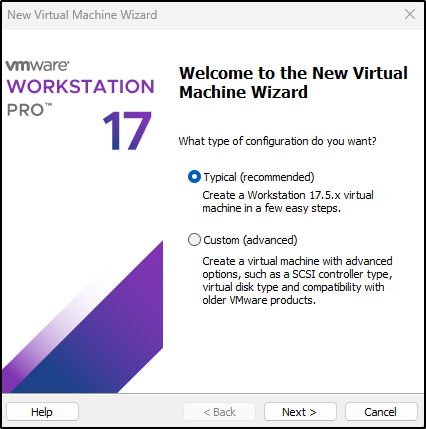
Open VMware Workstation and select Create New Virtual Machine. Choose Typical and click Next.
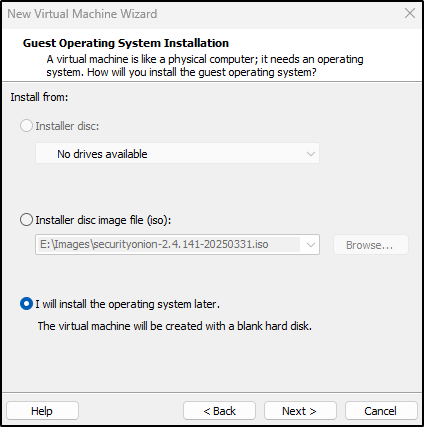
Select I will install the Operating System (OS) later.
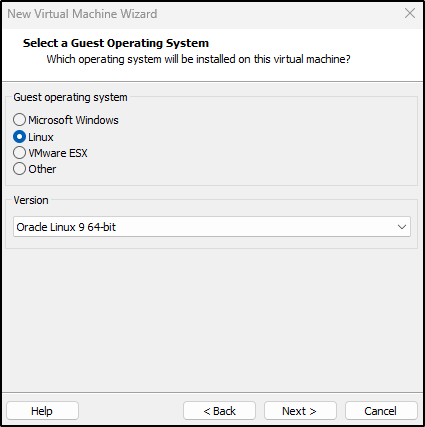
For Guest operating system, select Linux and Oracle Linux 9 (64-bit).
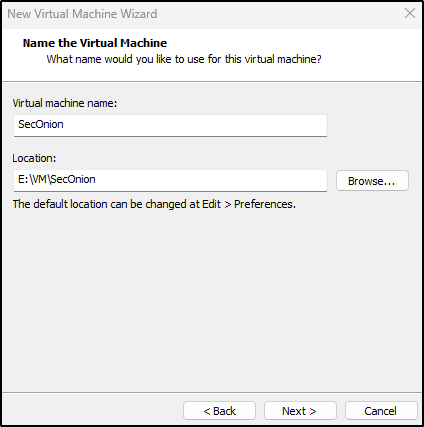
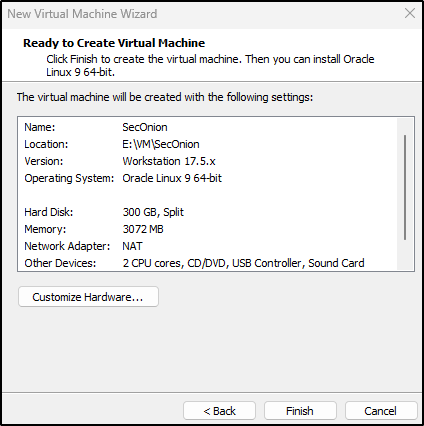
Enter the Virtual machine name (e.g., SecOnion) and choose where to save it.
Set the disk size to at least 200 GB.
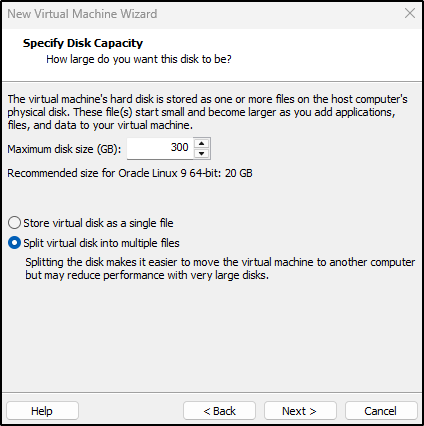
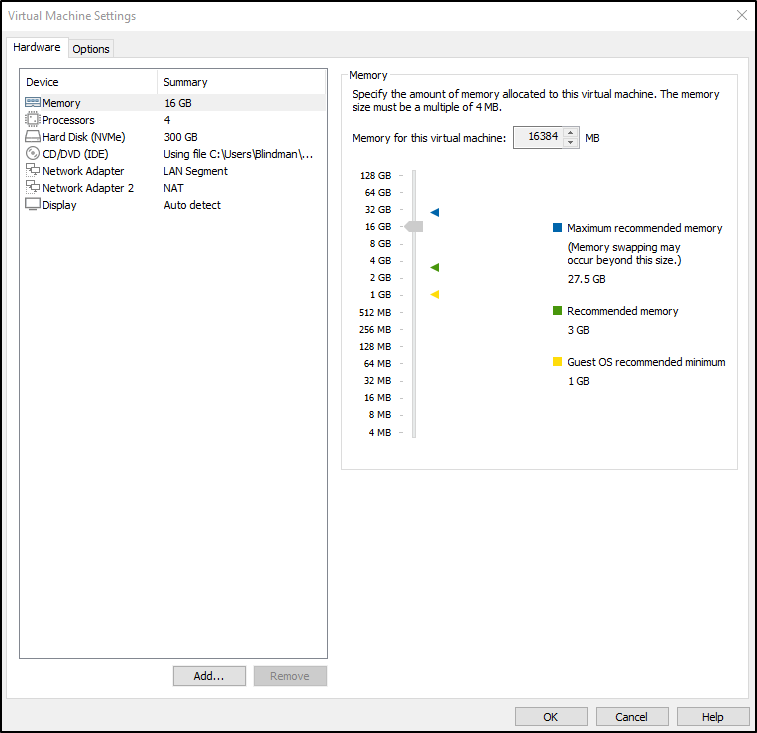
Click Customise Hardware:
- Memory: Set to 16 GB
- Processors: Set to 4
- Under CD/DVD, choose Use ISO image file and browse to the Security Onion ISO you downloaded.
- Add two network adapters:
- One connected to your FortiGate VM or LAN (e.g., LAN Segment)
- One for NAT or Bridged (this gives access to Internet to download required packages)
- Click Close and then Finish to create the VM.
Refer to the Hardware Requirements page and select network adapters appropriate for your setup.
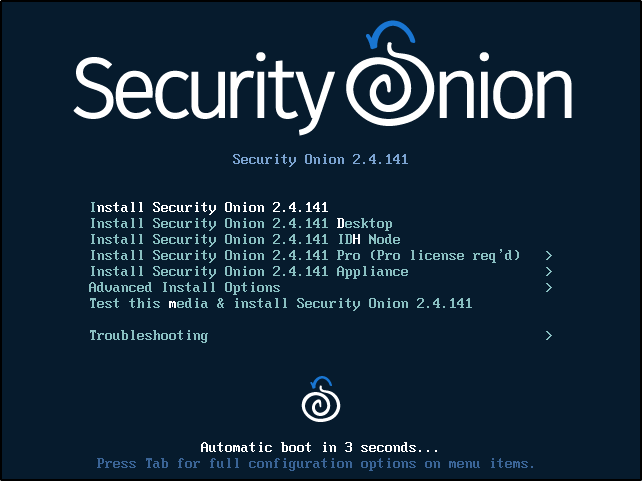
Power on the VM. When the menu appears, select Install Security Onion (top option).
The VM will go through initialisation process (automated script).
When prompted for warning, type yes to proceed. When prompted to create administrator account, create a username and password. For example:
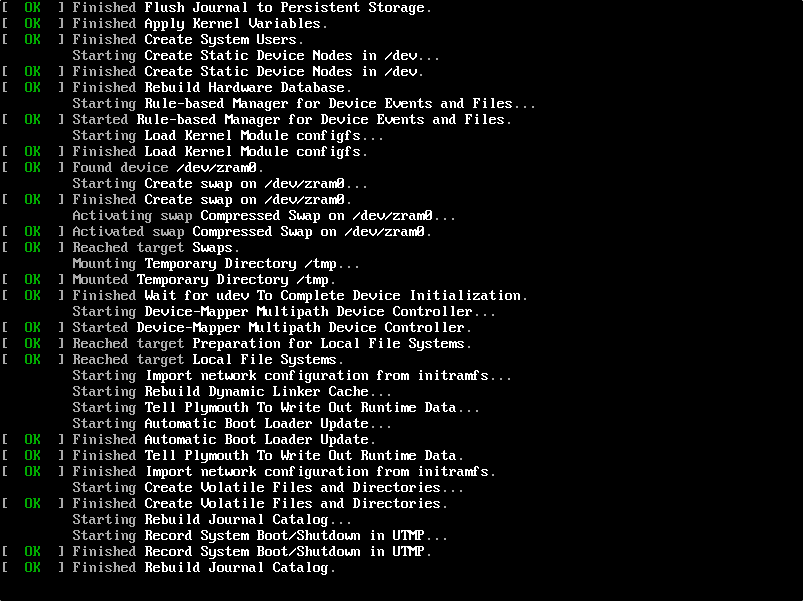
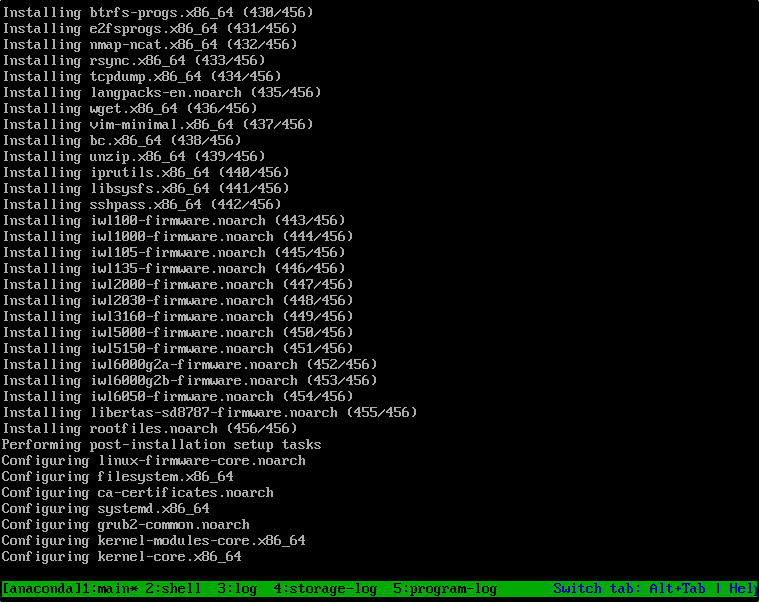
Security Onion will continue with the installation.
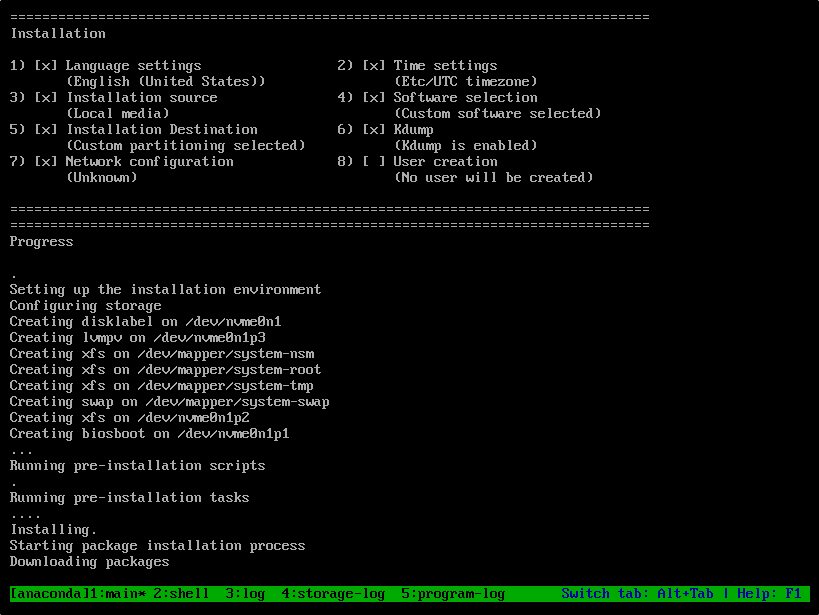
If Security Onion install is stuck at Downloading packages, it may be due to a network issue. To check, navigate to the shell:
Check your network interface (e.g., ens160). If it has no IP, it is not connected.
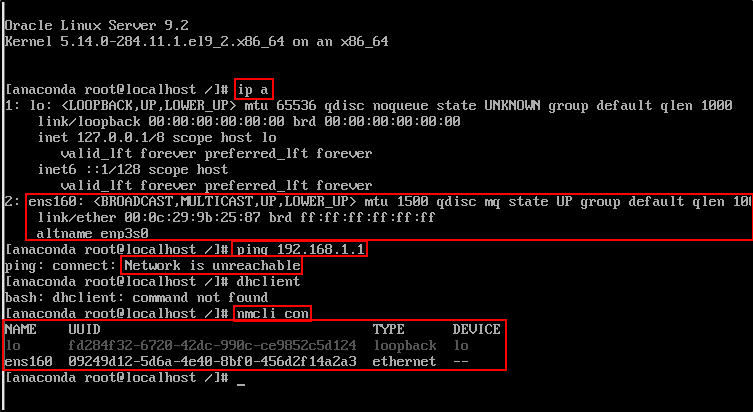
In this case:
- My VM interface
ens160is detected and up, but it has no IP address assigned. dhclientis not available (missing in this minimal Oracle Linux install).- The
nmclioutput showsens160is not attached to any connection profile, which means no network configuration is active.
To manually set up networking:
nmcli con add type ethernet ifname ens160 con-name ens160 autoconnect yes ipv4.method auto
nmcli con up ens160
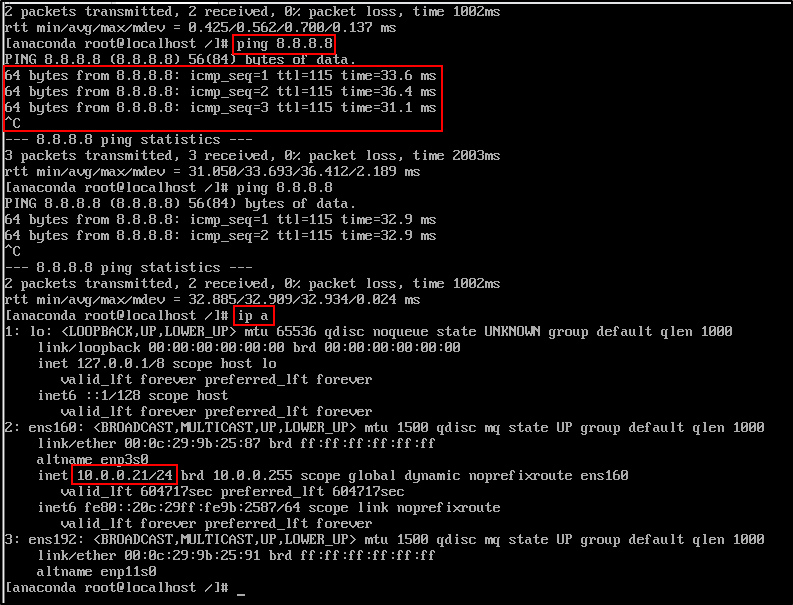
Then check IP and test internet connectivity:
To return to the installer screen, switch back to the main screen
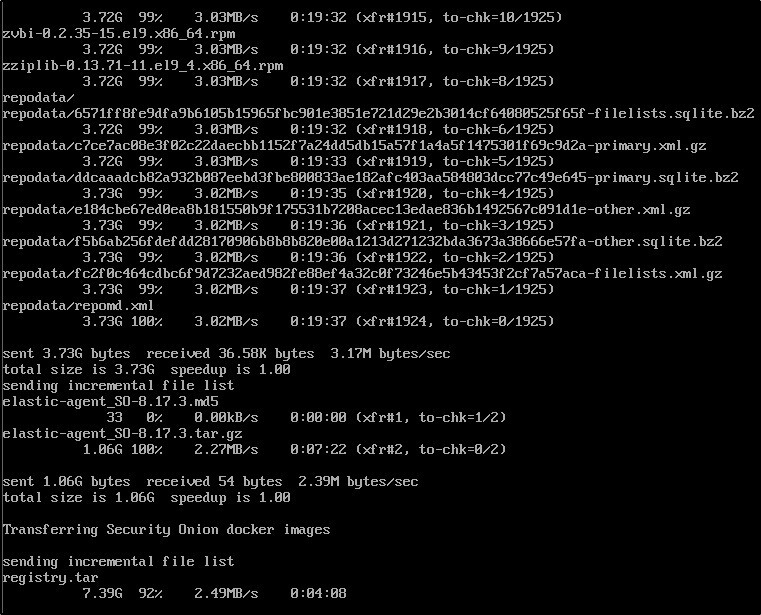
Once network access is working, the installer will proceed with downloading necessary packages. This part can take a while depending on your connection.
When prompted, press Enter to reboot.

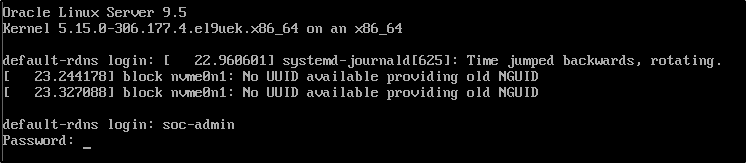
After reboot, login using the administrator credentials you created earlier.
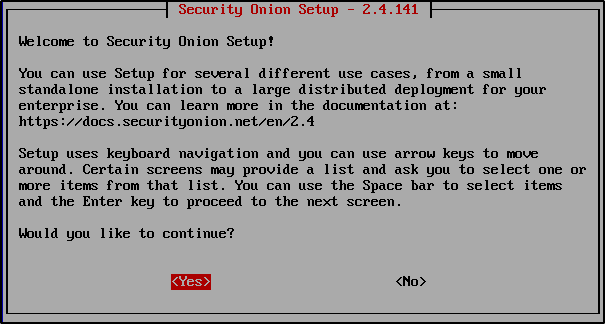
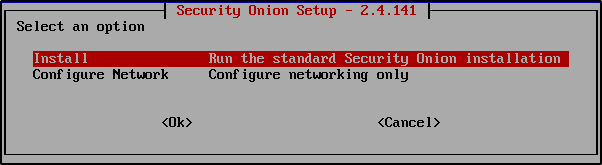
After logging in, you will see a prompt asking if you want to proceed. Select Yes.
Choose Install to begin the configuration process.
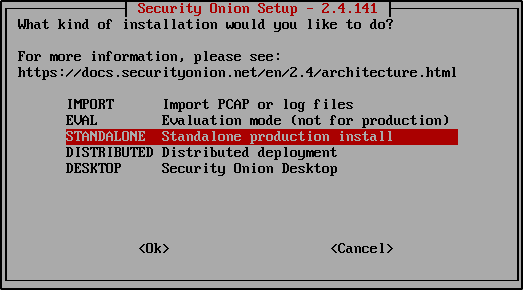
Select Standalone when asked for deployment type.
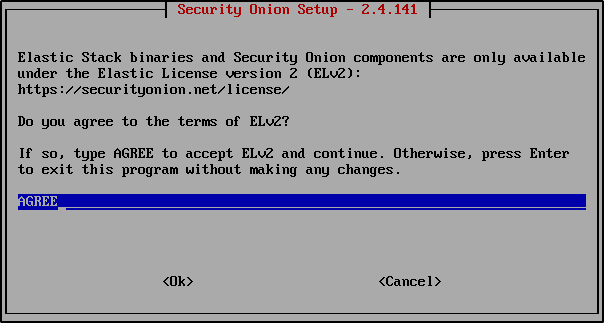
Type AGREE to accept the Elastic Licence version 2.
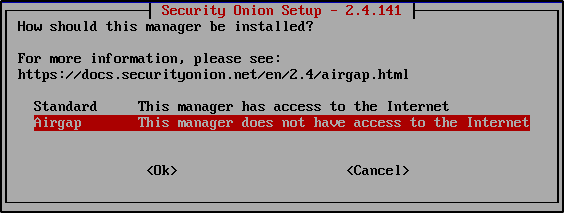
If your VM can access the internet, choose Standard. If you are installing in an offline or air-gapped environment, choose Airgap (as used in this guide).
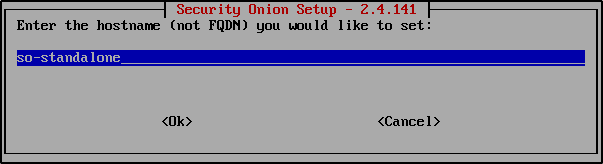
Give your system a hostname. This will identify your Security Onion node. For example:
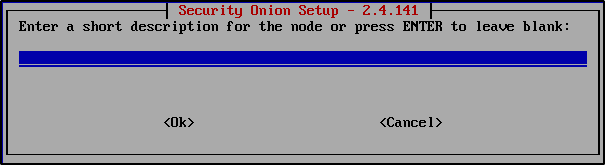
You can add a short description for this node, but it is not required. Feel free to leave it blank.
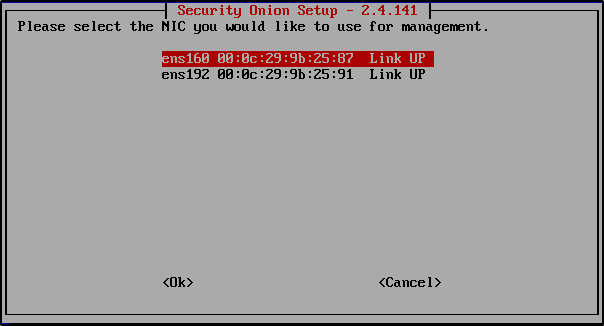
Choose the network adapter that connects to your LAN or firewall. In this example, it is ens160.
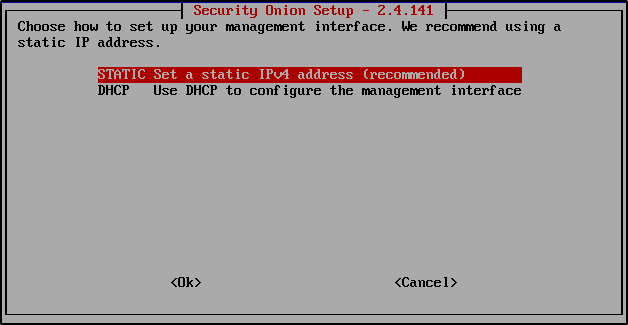
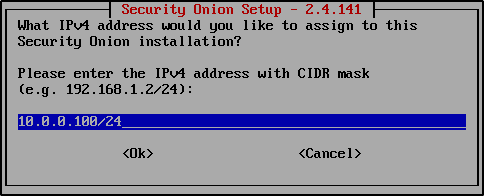
Select Static IP address for your management interface.
Note that this is the static IP address for your network interface not the VM itself. Earlier, the VM was assigned DHCP IP address of 10.0.0.21. The static IP address must be in the same subnet but the last octet can be different.
Assign 10.0.0.100/24 to the network interface.
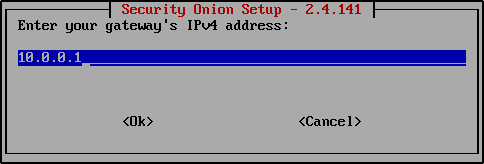
Enter your gateway’s IP address. Note this will be different in your setup.
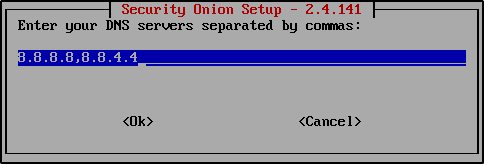
Enter your DNS servers. This will be automatically populated.
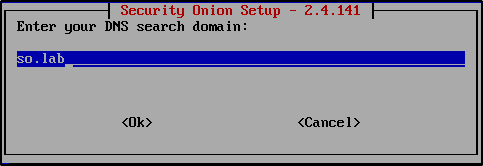
Enter a generic value like so.lab for your DNS search domain.
When asked whether to keep the default Docker IP range, select Yes.

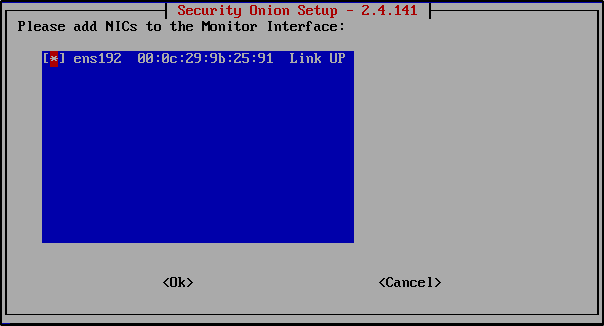
Choose the second network adapter for packet monitoring. In this case, ens192 (NAT network).
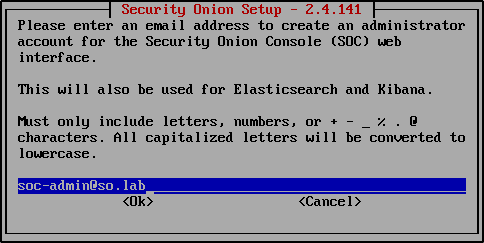
Create an administrator account in email address format for the Security Onion Console (SOC) web interface. It can be a made up email address. Take a note of this email address.
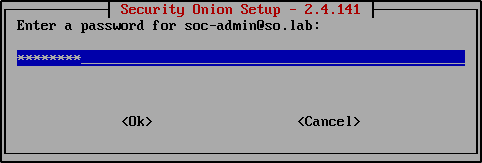
Enter a password for the administrator account.
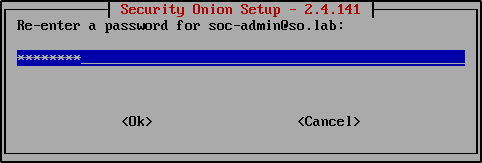
Re-enter the password.
Select IP to access the web interface.
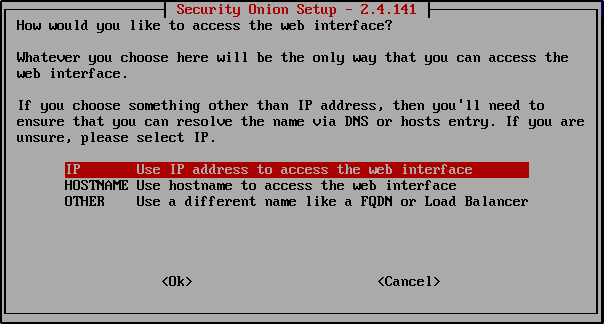
Select Yes to allow access to this Security Onion installation via the web interface.

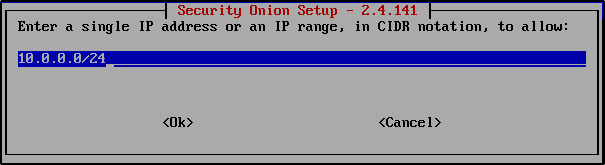
Enter the 10.0.0.0/24 to allow access from this subnet. Note your network setup may be different so verify your subnet.
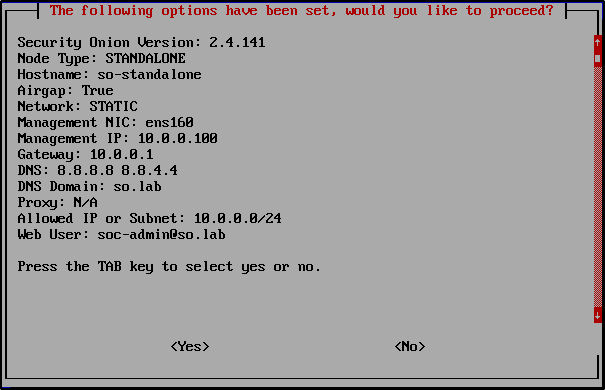
Review your settings. If everything looks right, select Yes to proceed.
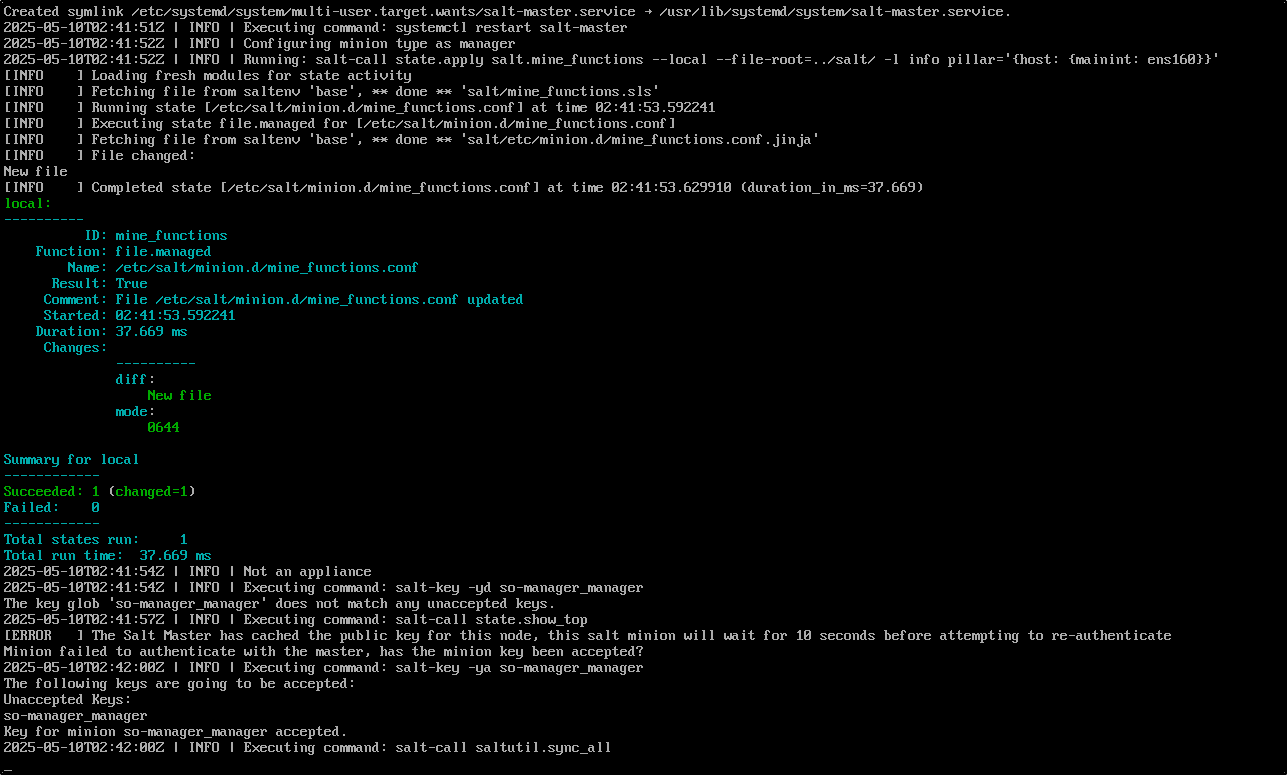
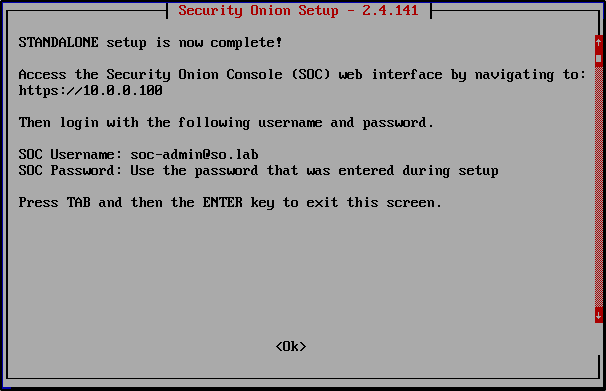
Security Onion will now run an automated configuration script. This may take 10–30 minutes depending on your system.
After installation is complete, you can access the SOC web interface by navigating to https://10.0.0.100.
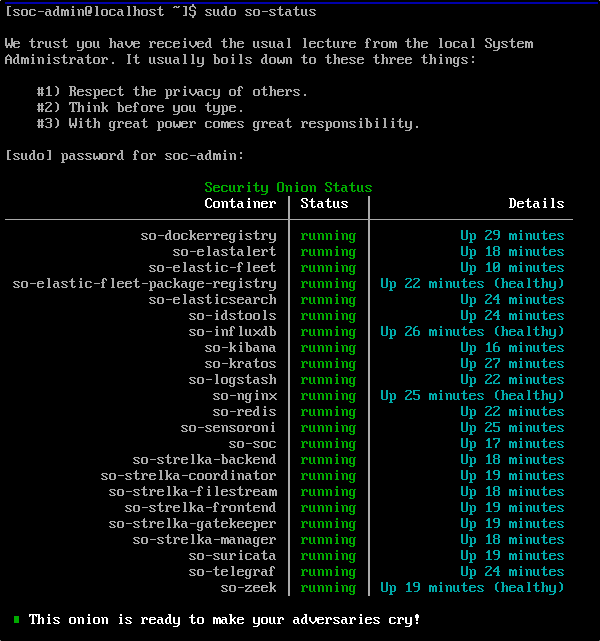
Verify that all containers are running by entering the following command on the terminal of the Security Onion VM:
Accessing SOC Web Interface
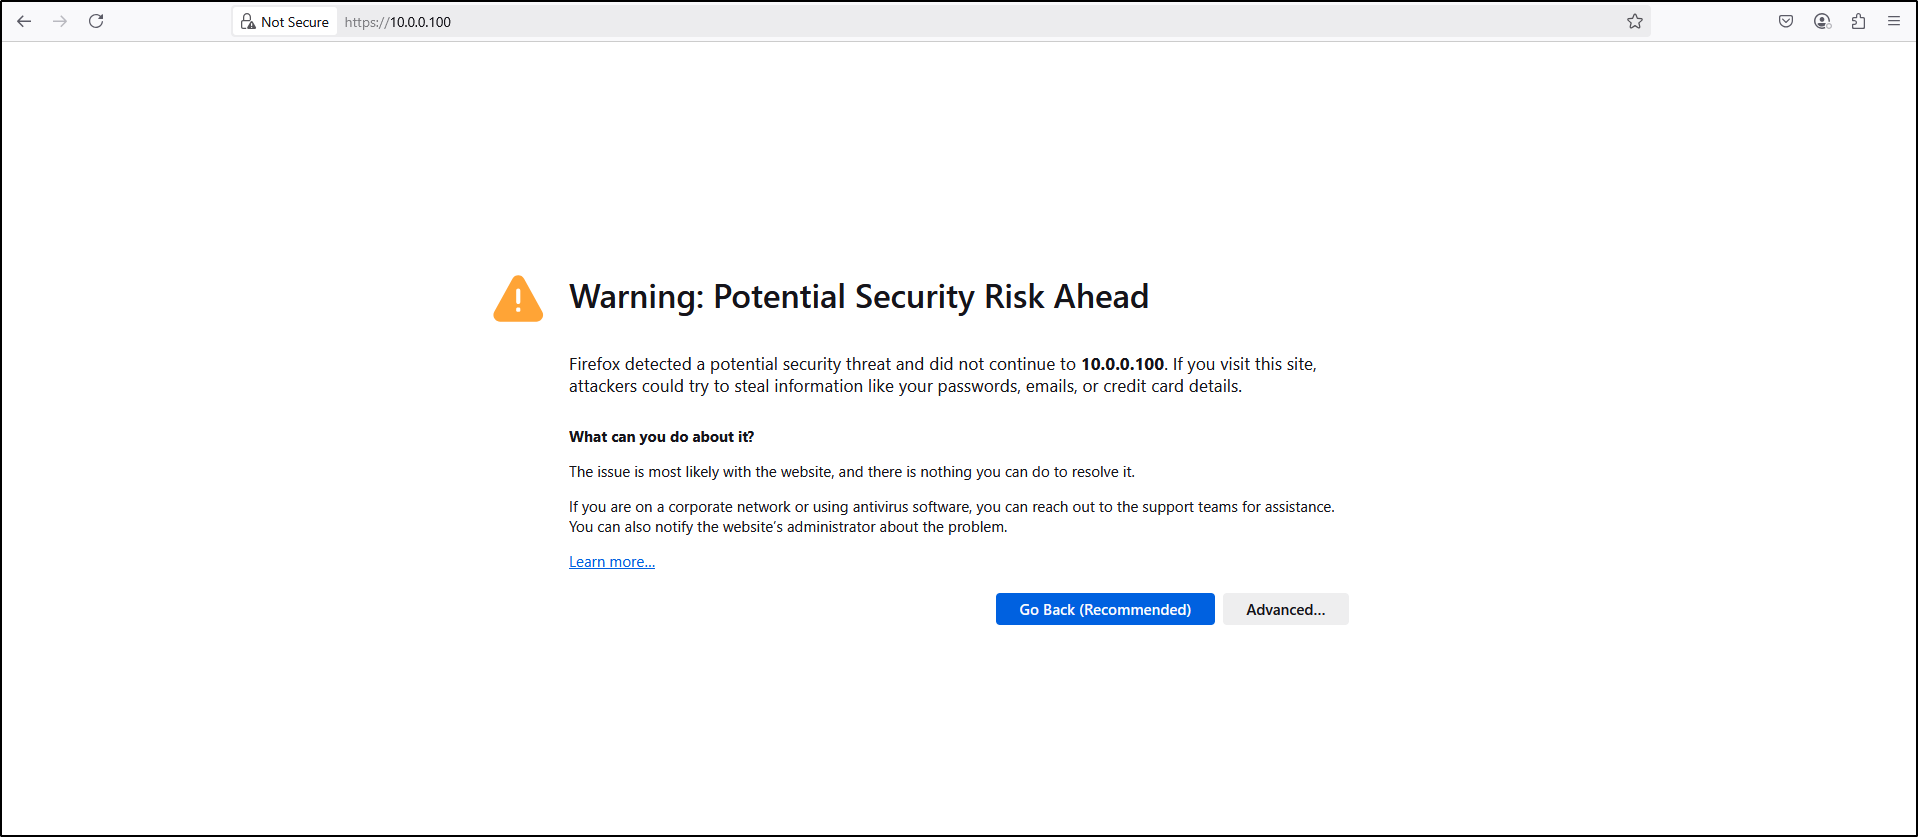
From the WS2019 VM, open a web browser and navigate to https://10.0.0.100. When prompted for a warning, click Advanced then select Accept the Risk and Continue.
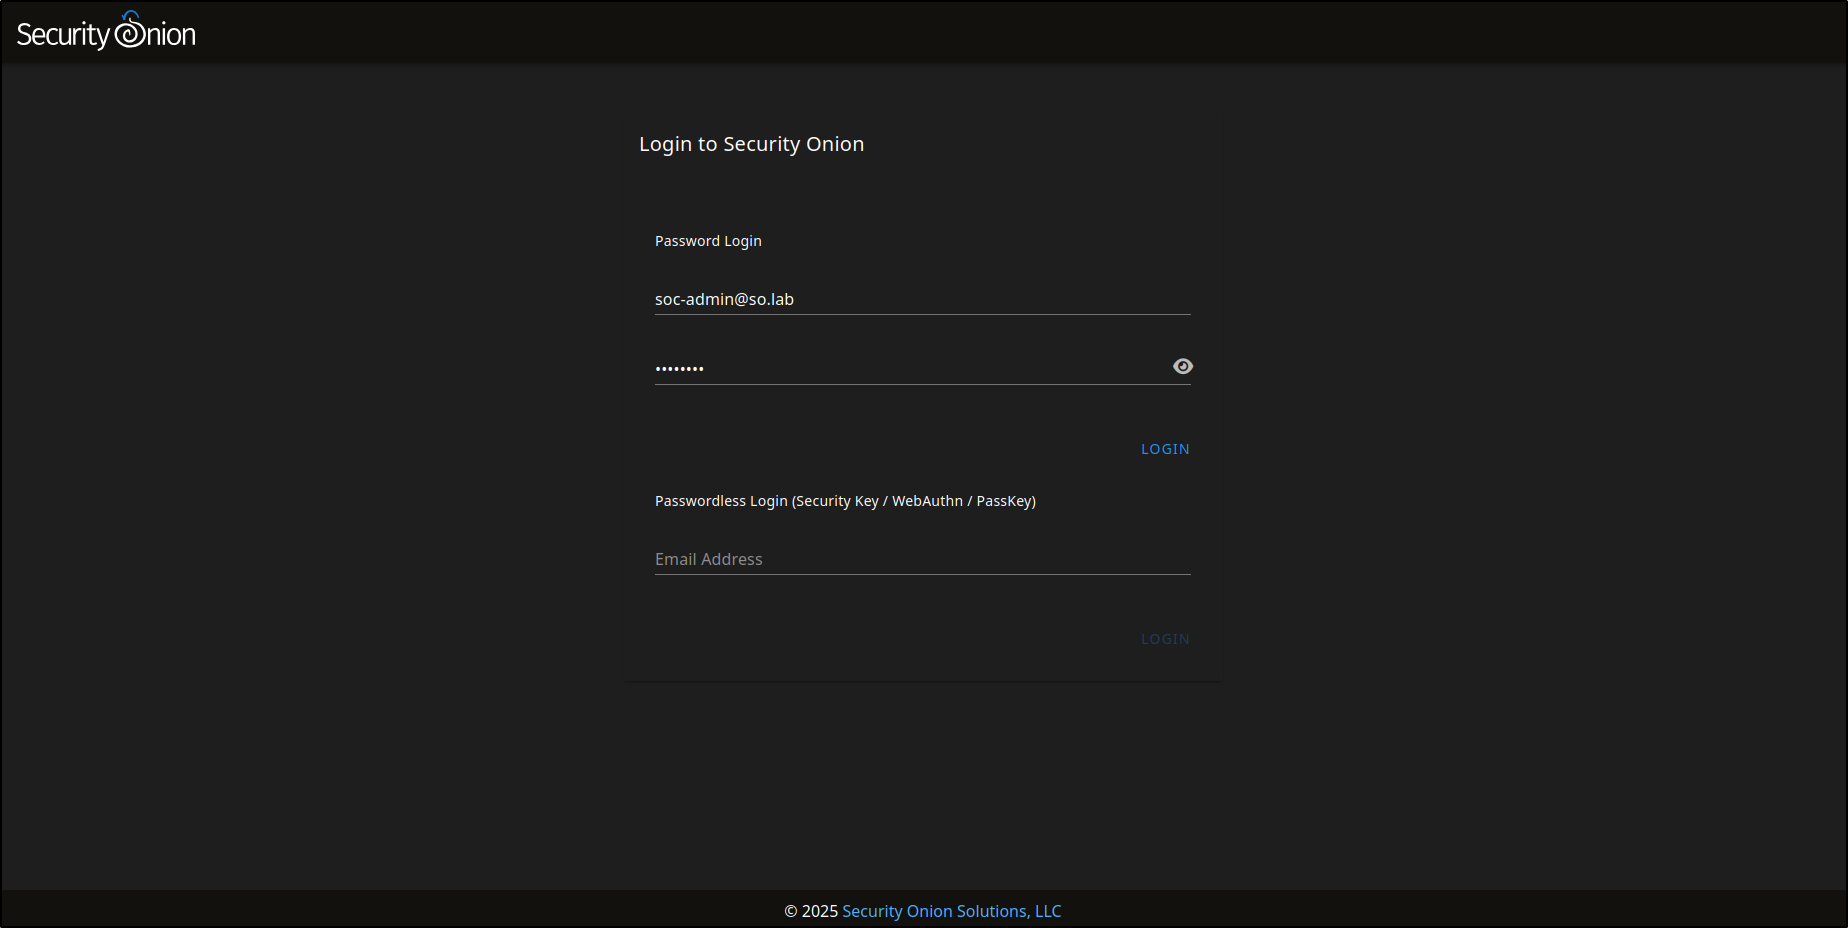
Login to SOC web interface using the administrator credentials.
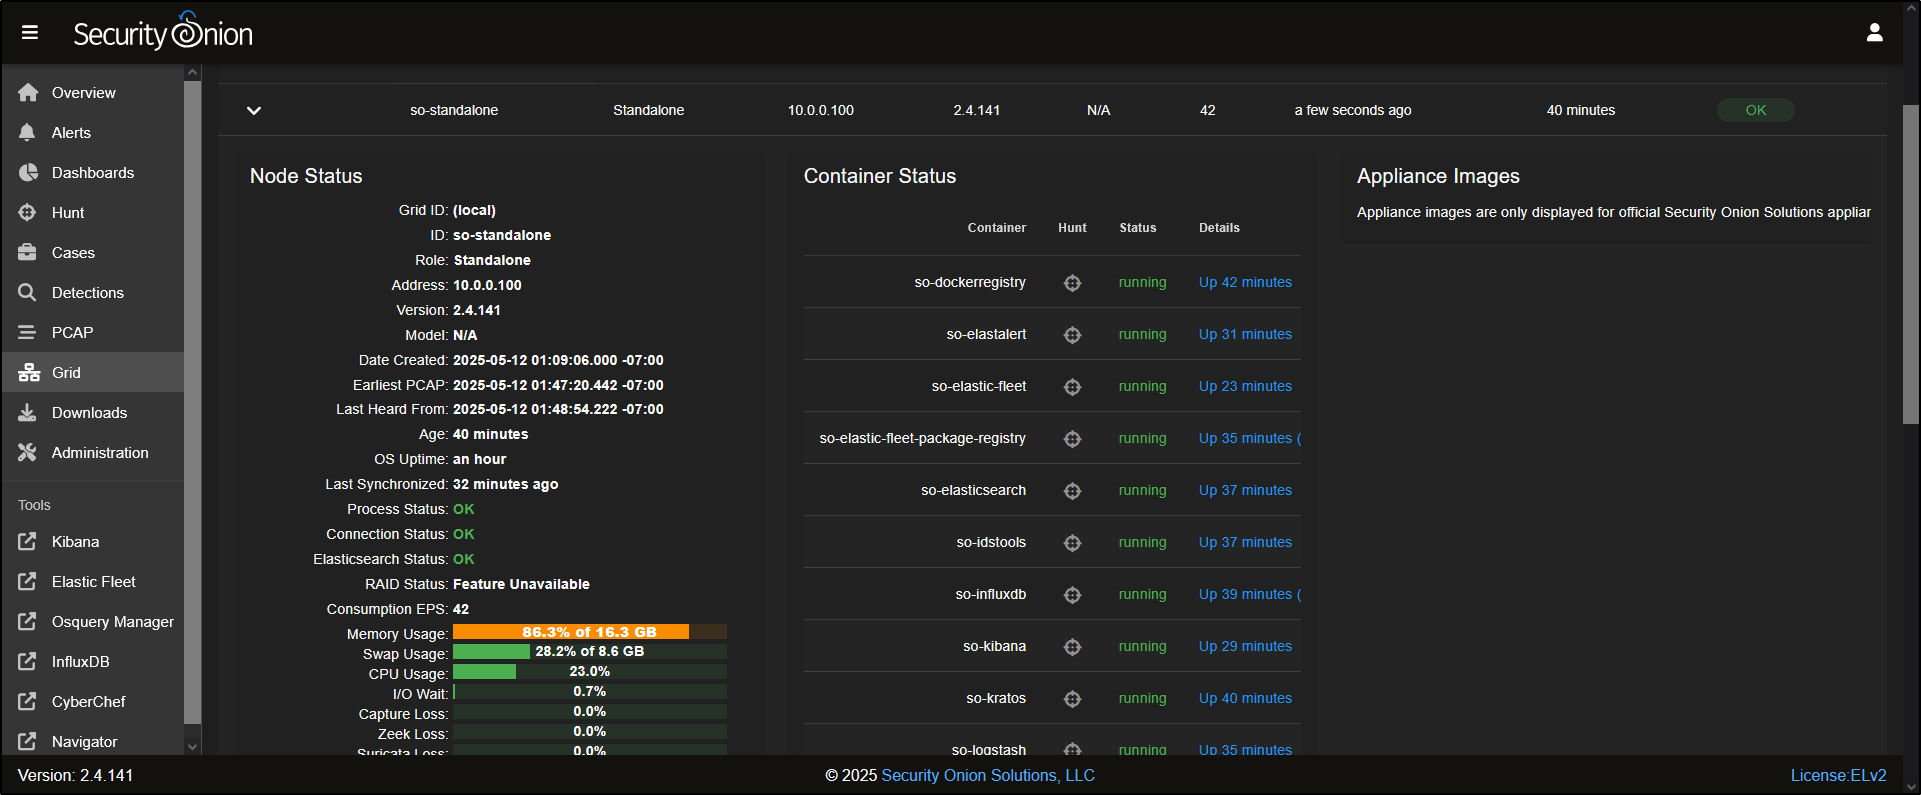
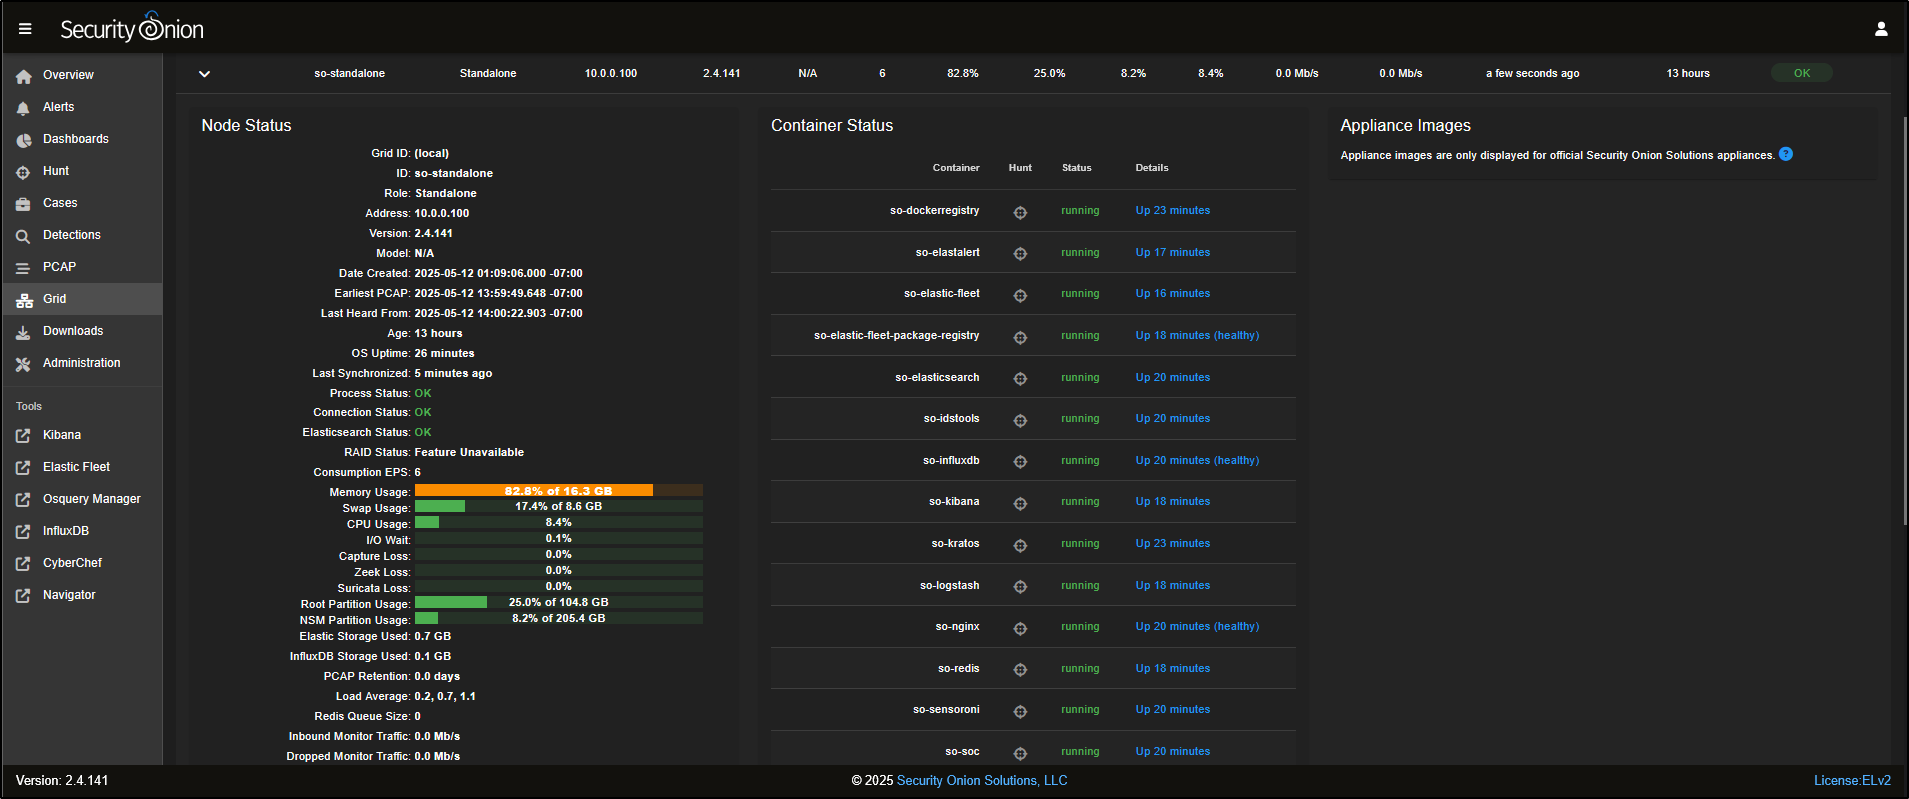
Navigate to Grid page and verify that all containers are running on the Security Onion Manager.
Configuring Security Onion Firewall
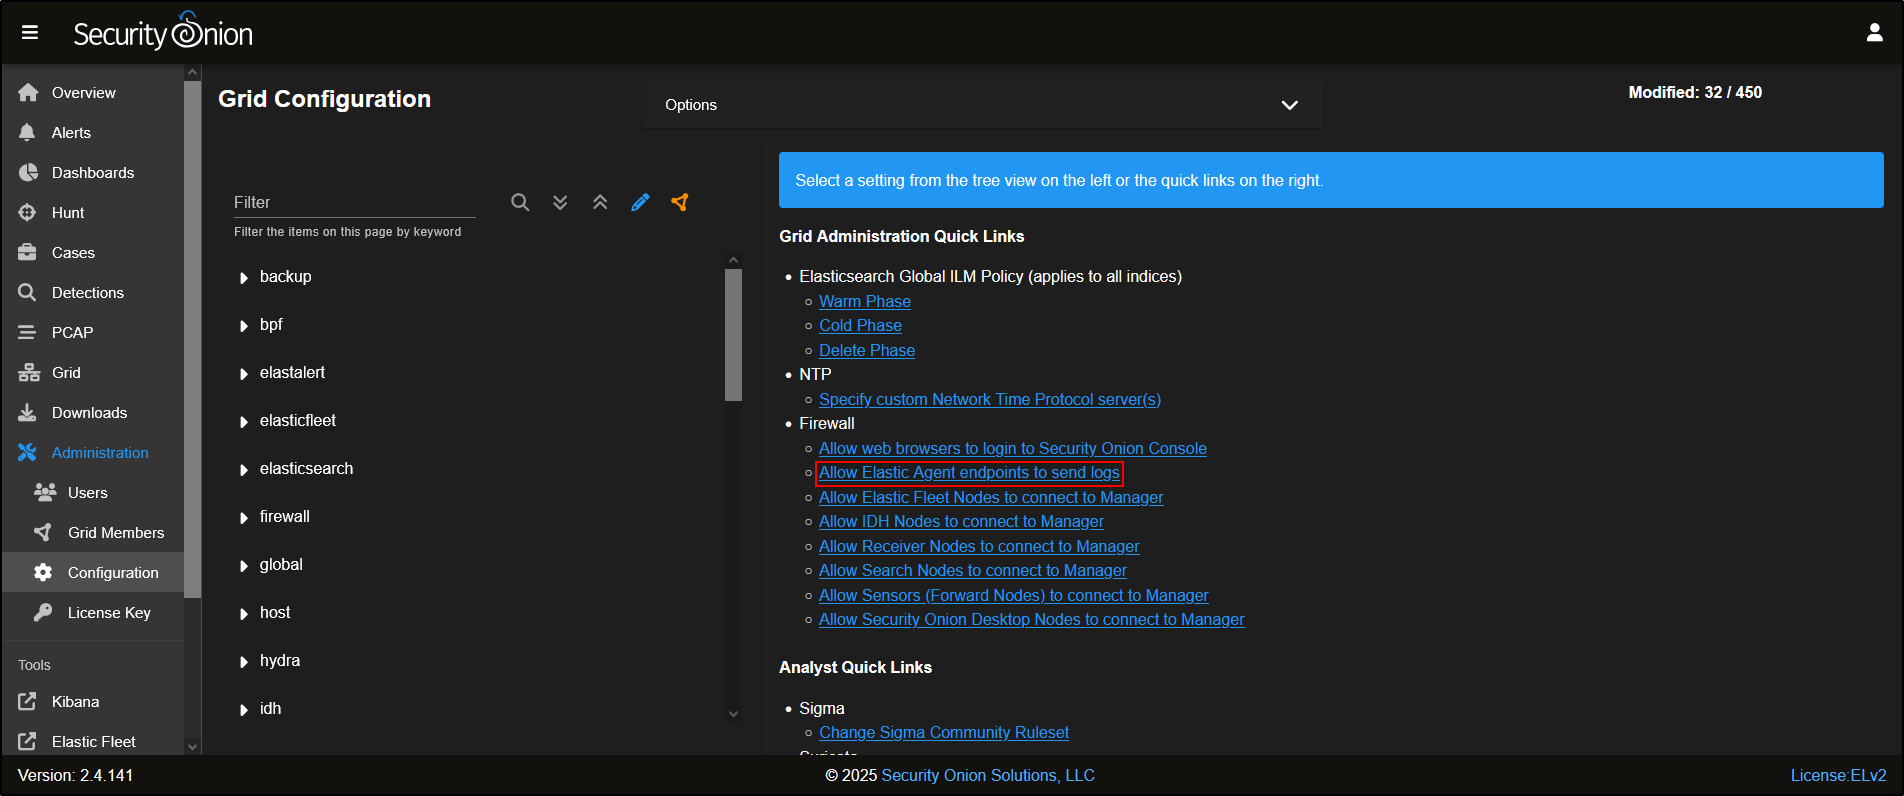
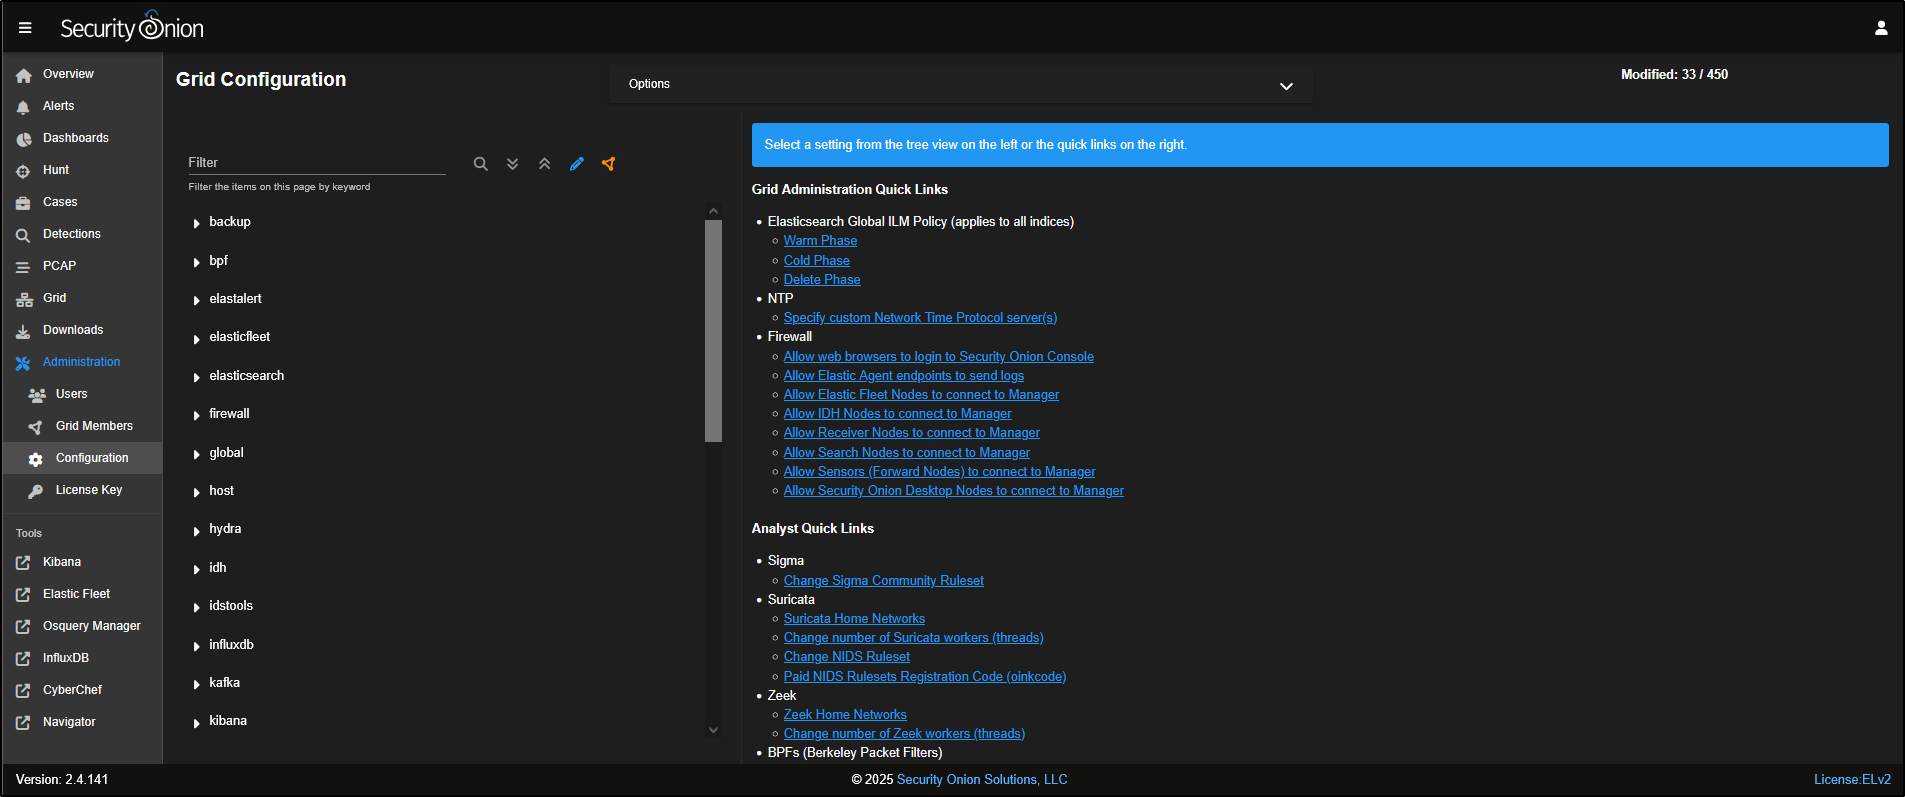
To allow the agent to connect through the firewall, navigate to Administration → Configuration.
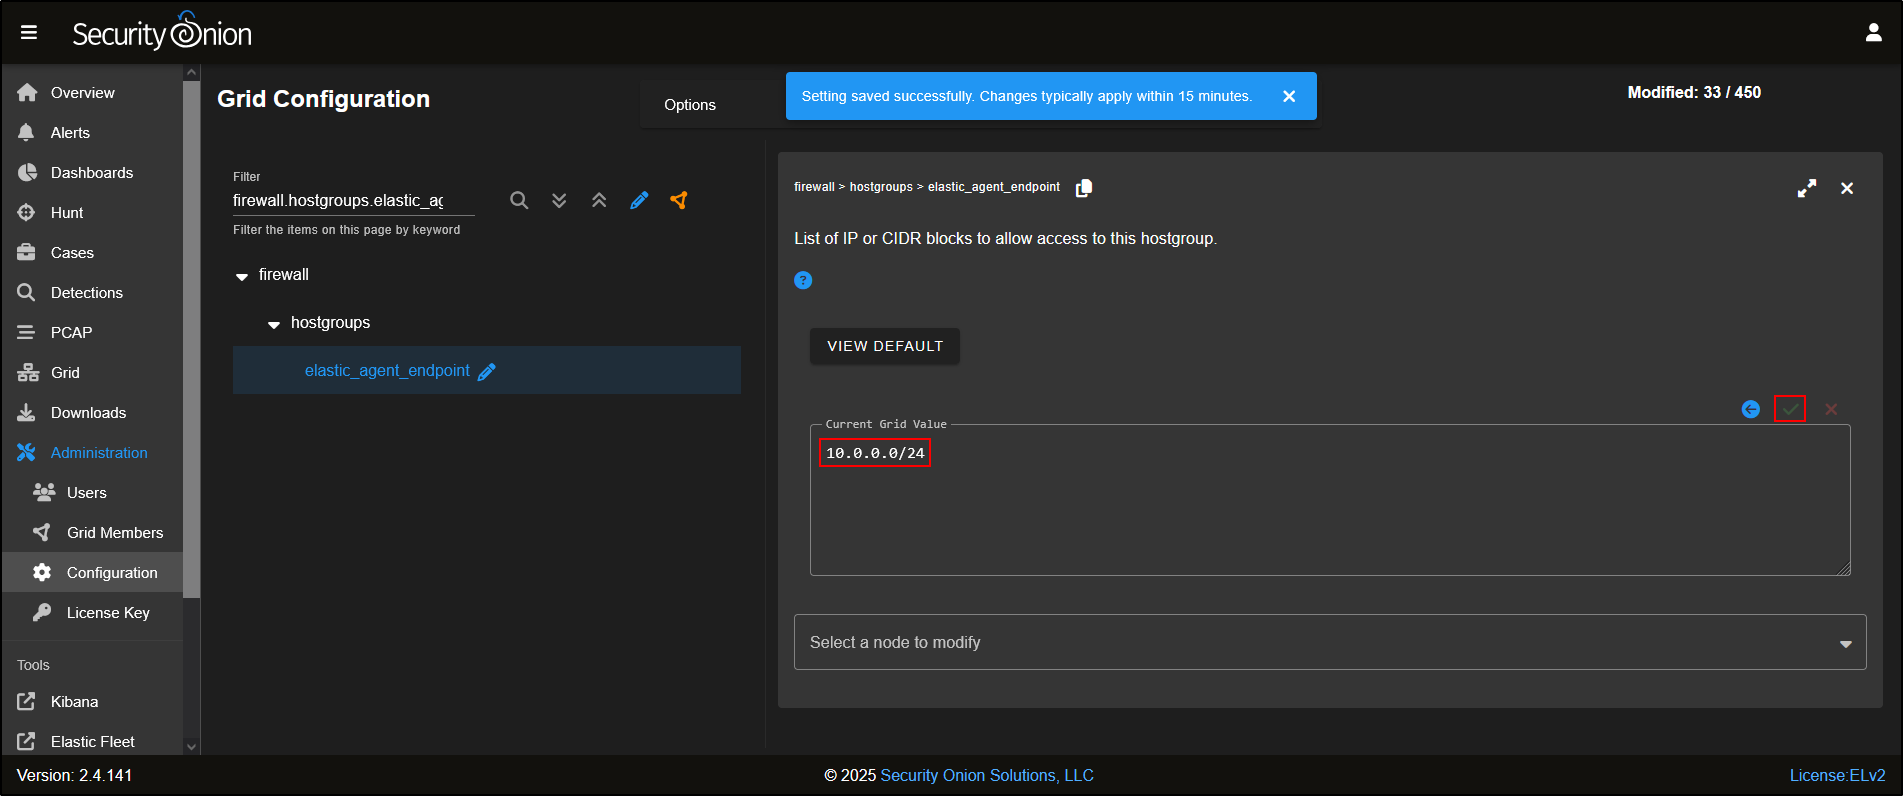
Select the quick link Allow Elastic Agent endpoints to send logs. This will automatically select firewall → hostgroups → elastic_agent_endpoint. Add *the agent’s subnet. Click the *green checkmark to apply changes. Note that the changes typically apply within 15 minutes.
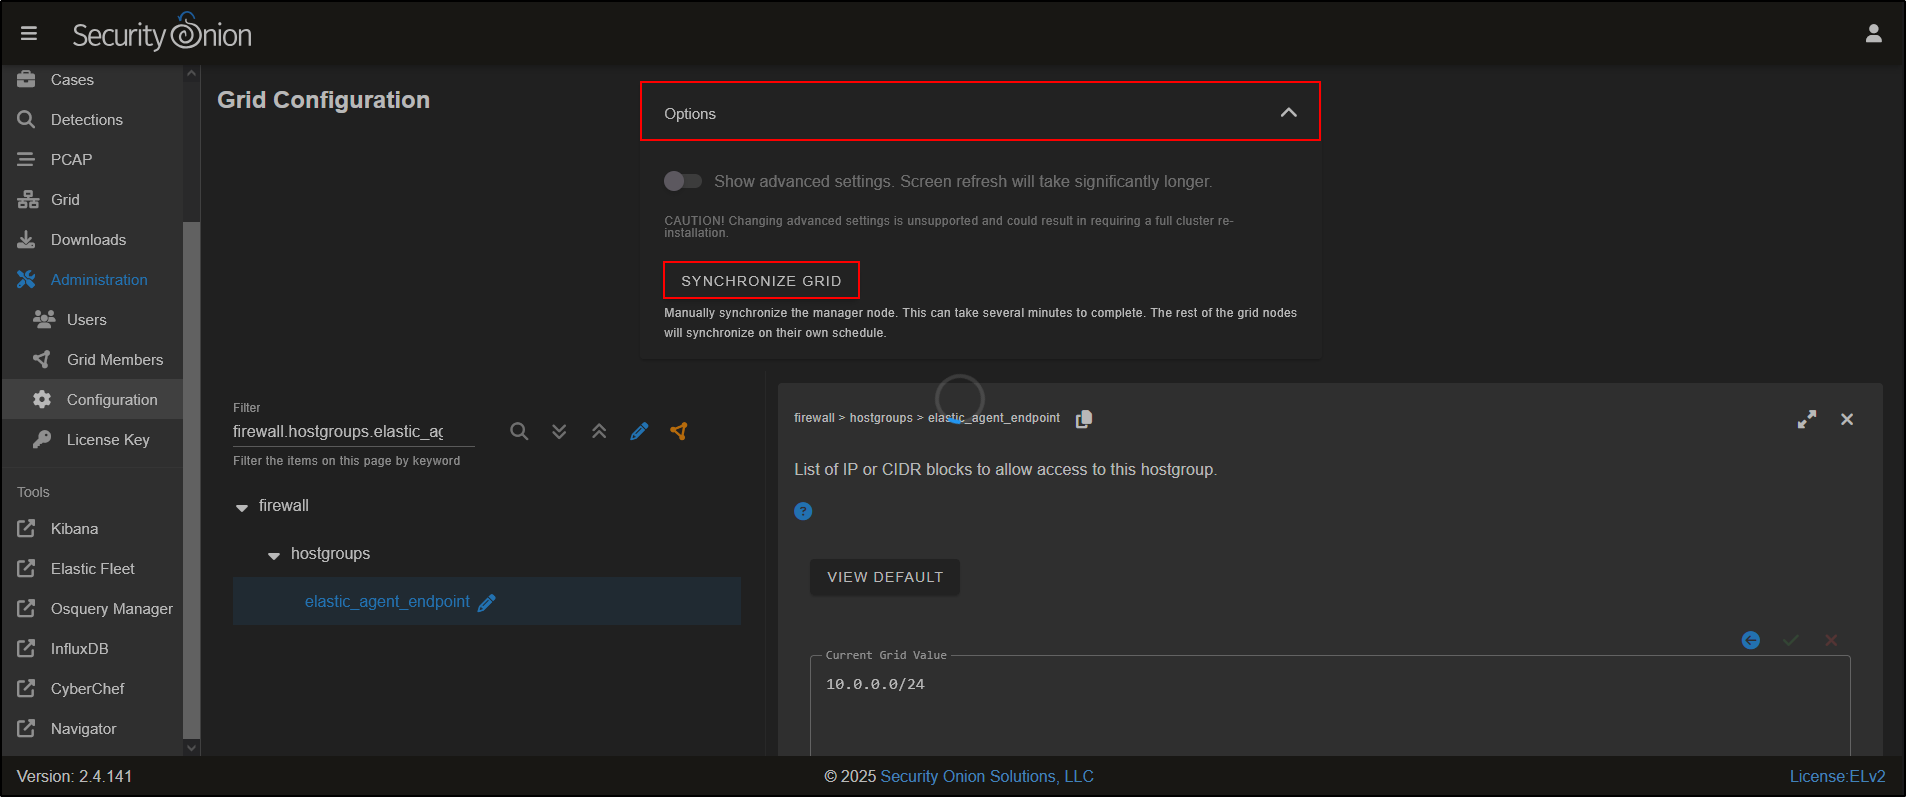
Click on Options and Synchronize Grid to push out changes. Please note that this can take several minutes to complete.
Deploying Elastic Agent on Windows
After waiting for several minutes, verify connection to 10.0.0.100 on port 8220 by running the following command in PowerShell from your Windows VM.
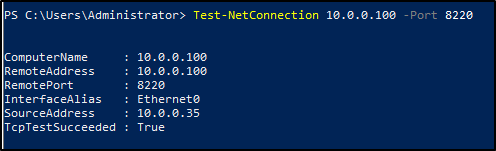
You should see True for TcpTestSucceeded.
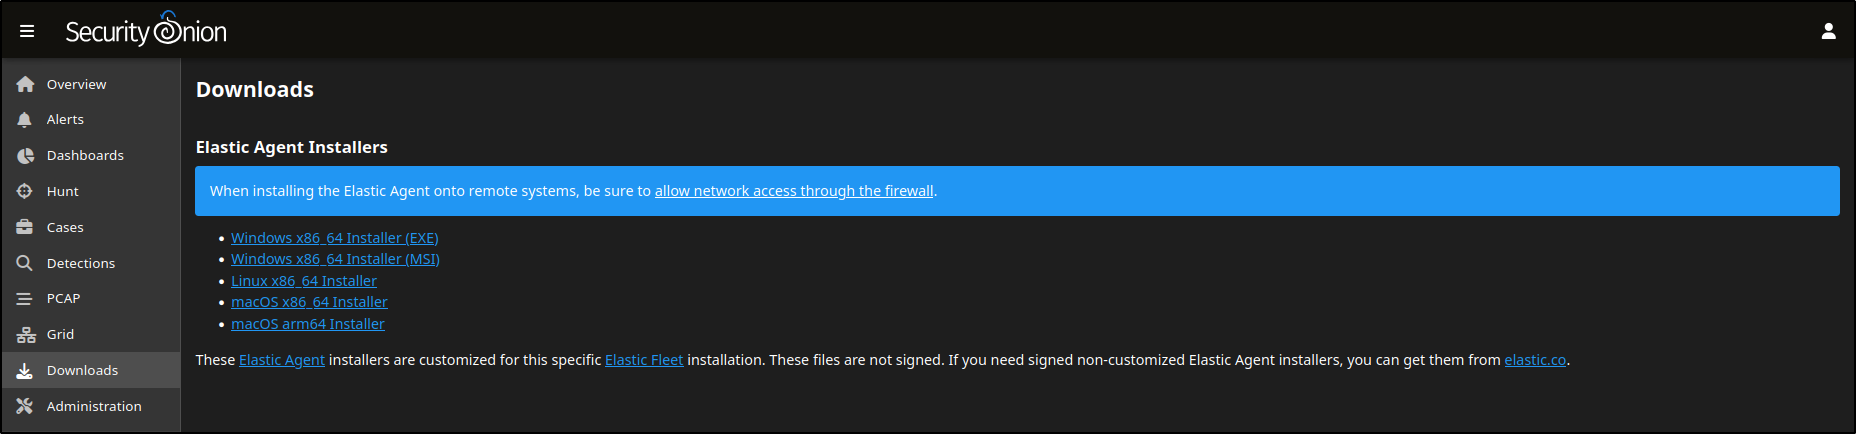
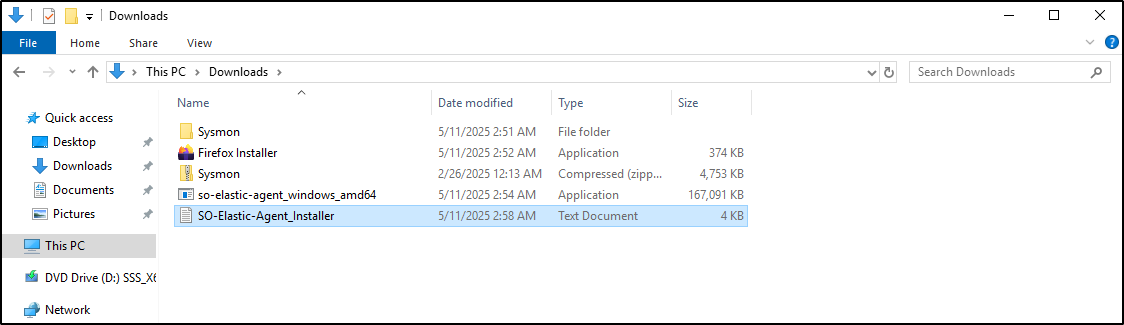
Navigate to the Downloads page and download the Windows Elastic agent (exe).
Note Sysmon has been installed and configured on the WS2019 VM. If you would like to ingest Sysmon logs, install and configure Sysmon on yours Windows VM before proceeding to the next step.
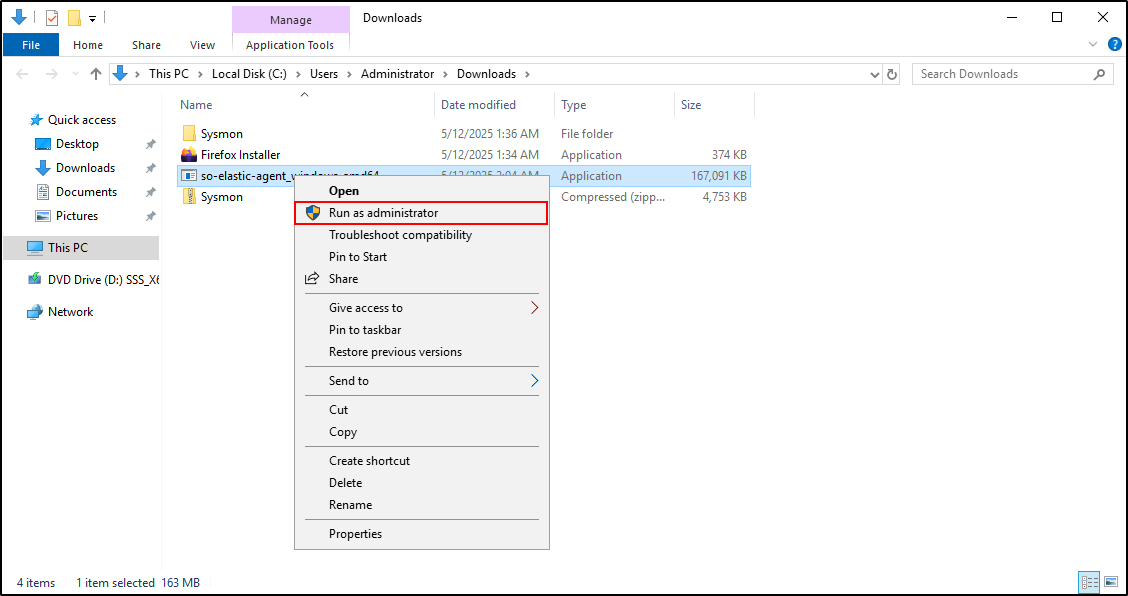
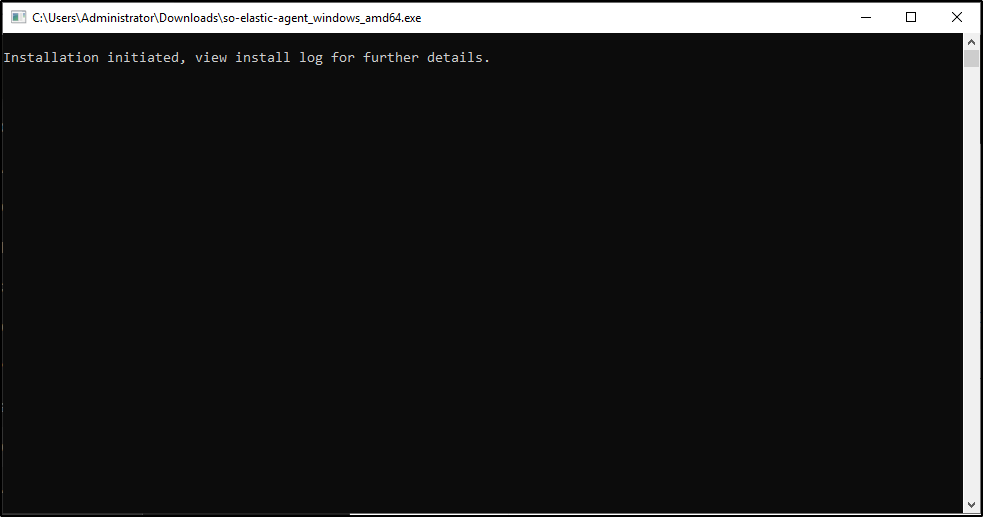
Right-click on the elastic agent and click Run as administrator.
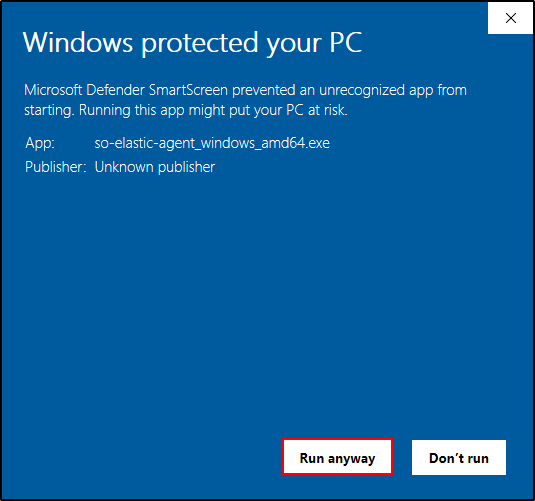
If Microsoft Defender SmartScreen prevents you from running the agent, click More info → Run anyway.
Installation will be initiated.
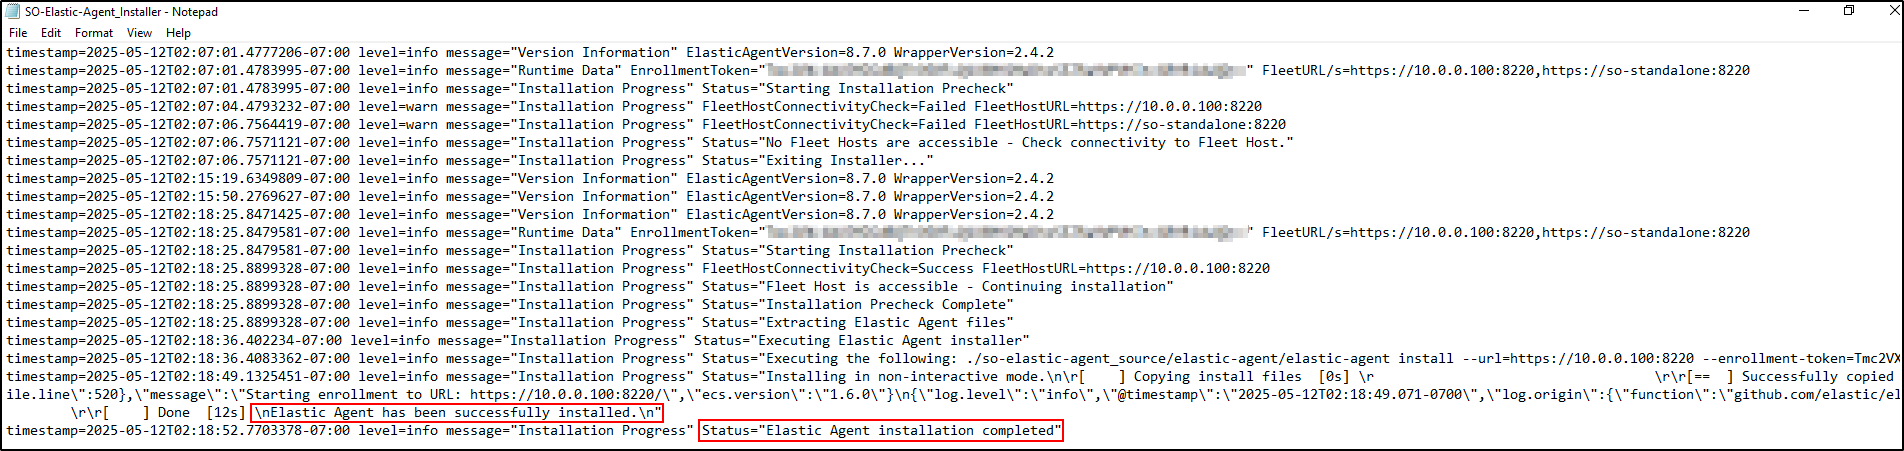
After installation is complete, check the Elastic agent installer log.
You should see Elastic Agent has been successfully installed and Elastic Agent Installation completed.
If you encounter an error, try installing the Elastic agent again. If the error persists, refer to the Security Onion documentation for troubleshooting.
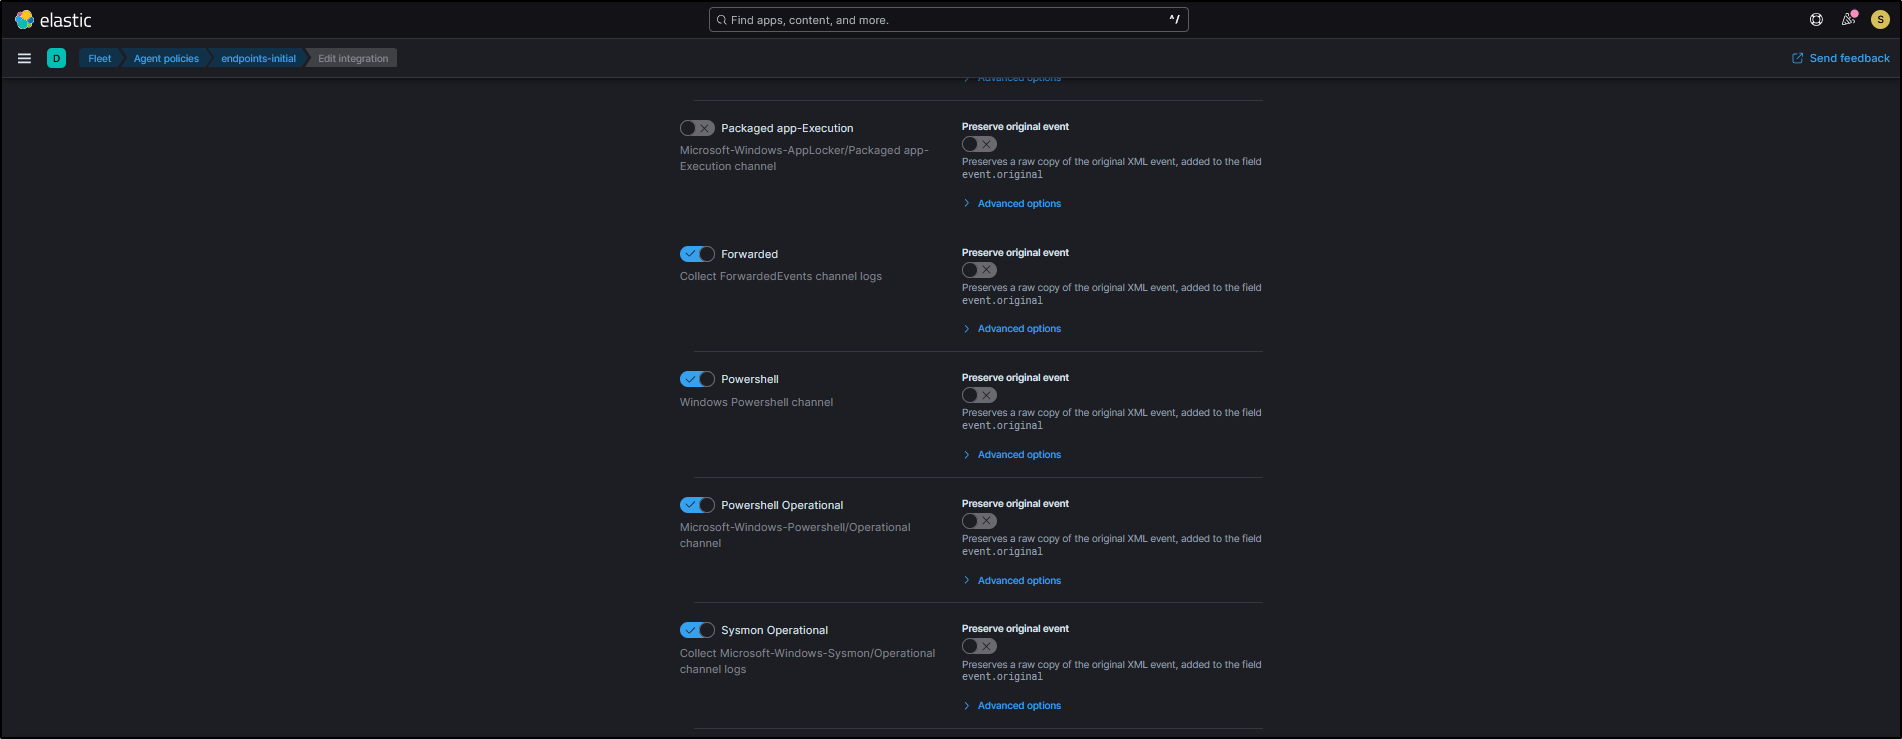
By default, Security Onion’s Fleet agent policies include integrations that collect Windows event logs from key channels such as PowerShell, ForwardedEvents, and Sysmon Operational.
You can check agent policies by navigating to Elastic Fleet → Agent policies → endpoints-initial → windows-endpoints.
Checking Host Logs in Dashboard
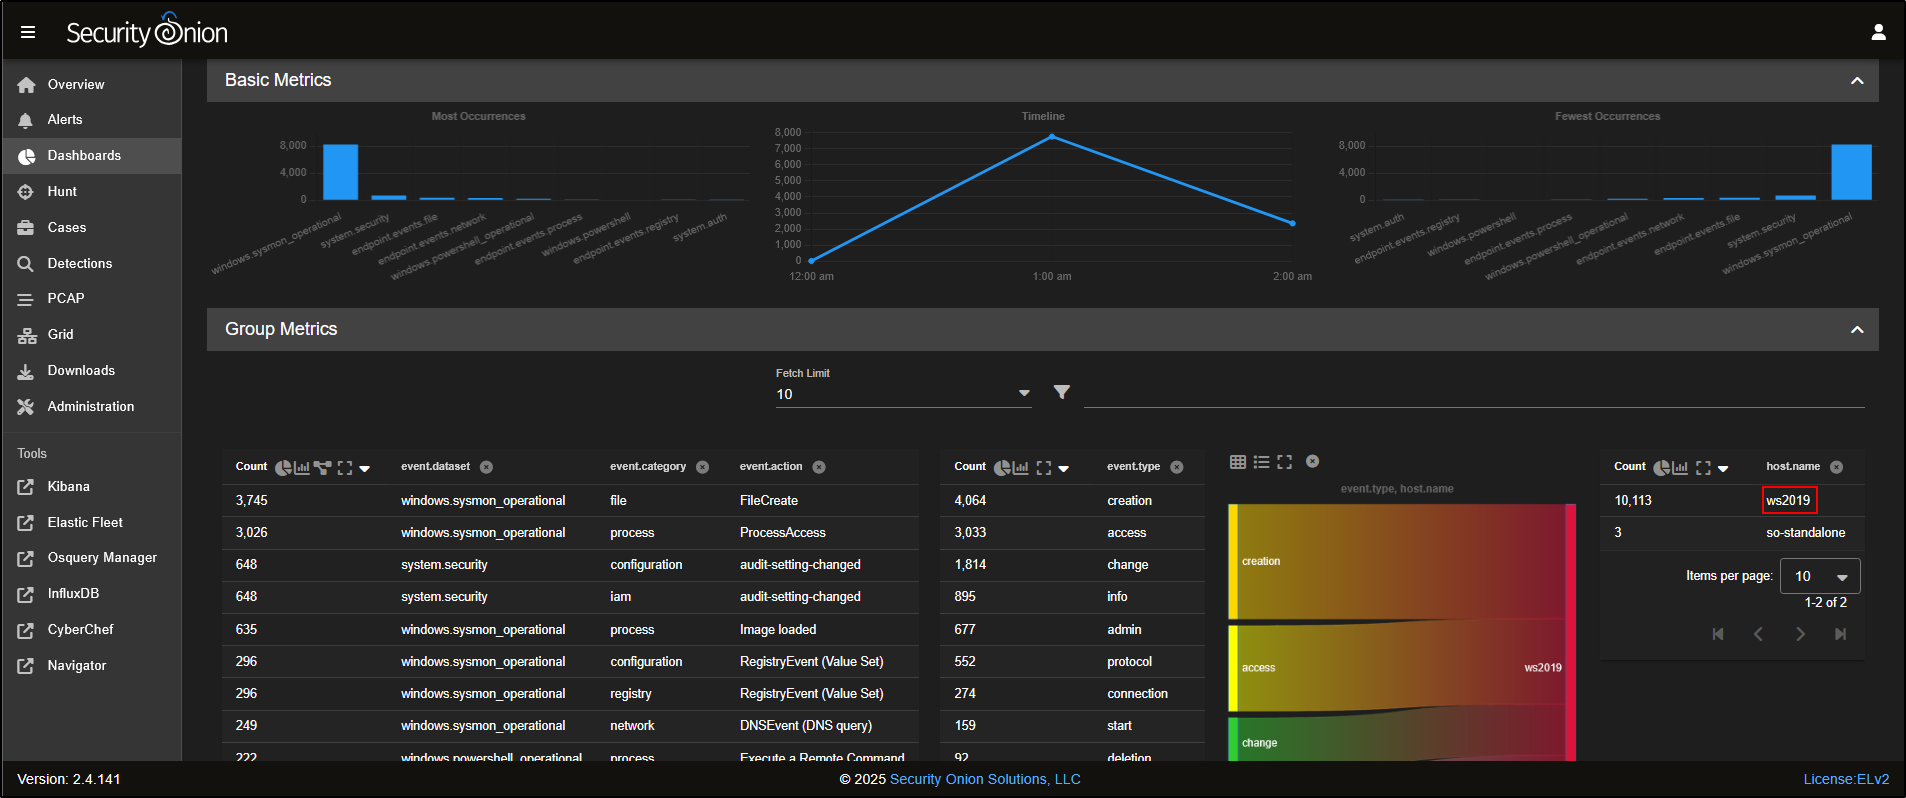
To verify that host logs are being ingested, navigate to the Dashboards page and select Host Overview on SOC web interface.
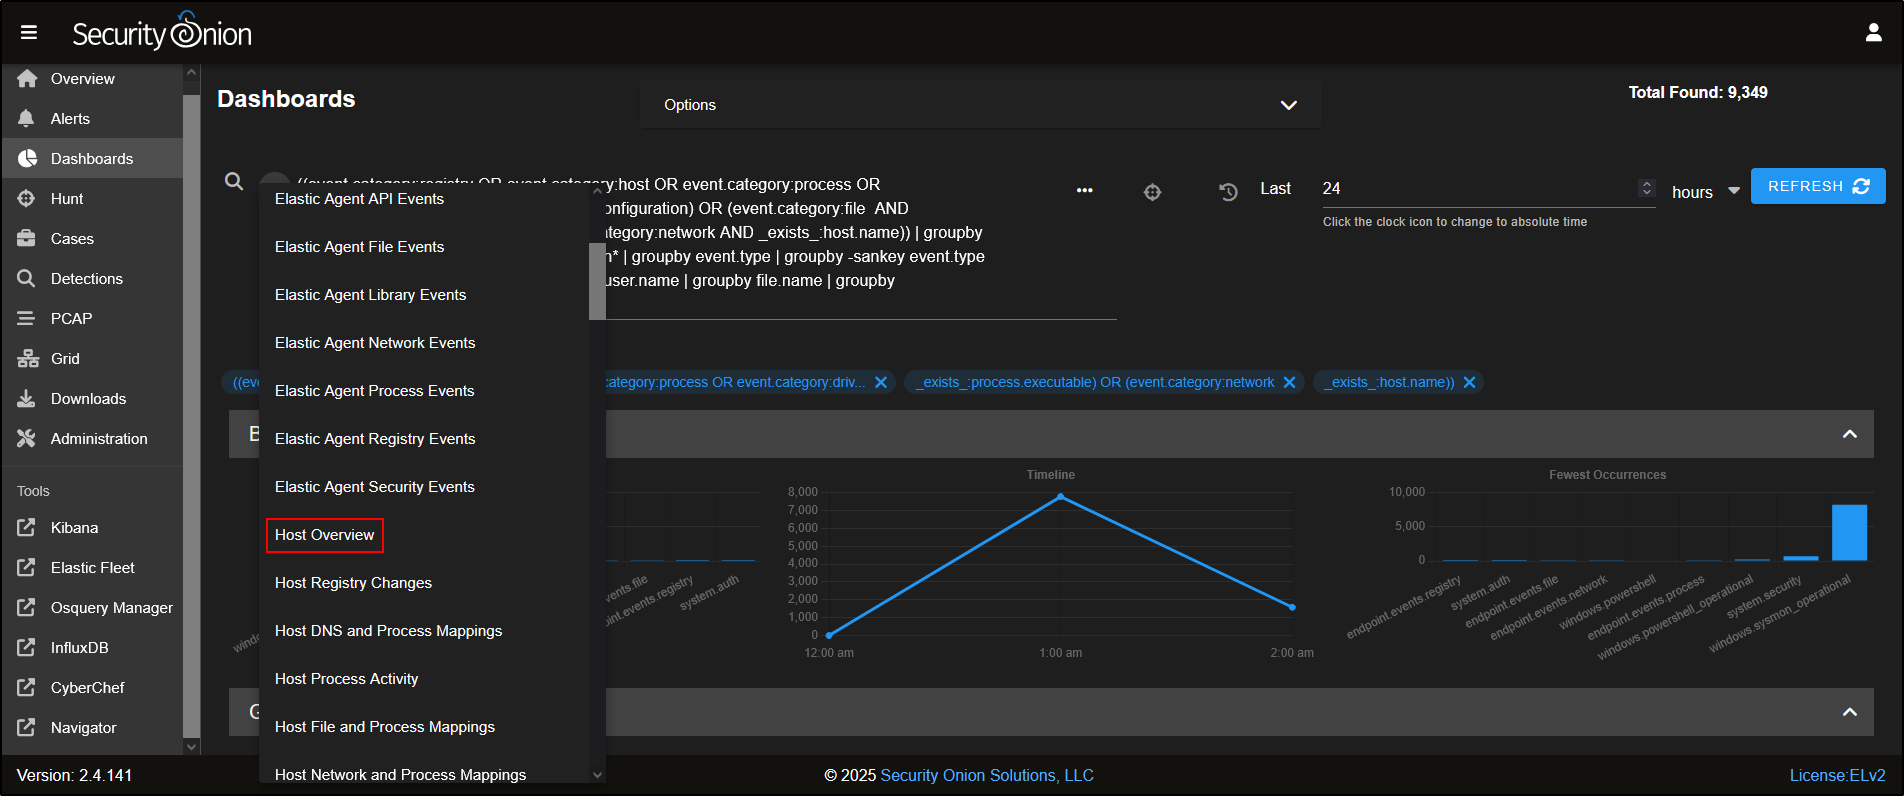
This gives us high-level view of host logs that are being ingested via Elastic agent. We see Sysmon logs and Windows event logs being ingested from the host WS2019.
Introduction to Security Onion
This documentation is based on content from the Security Onion Essentials course by Security Onion Solutions. Some examples have been adapted to reflect my lab setup, which uses Standalone mode instead of Evaluation mode.
Analyst Tools
Overview
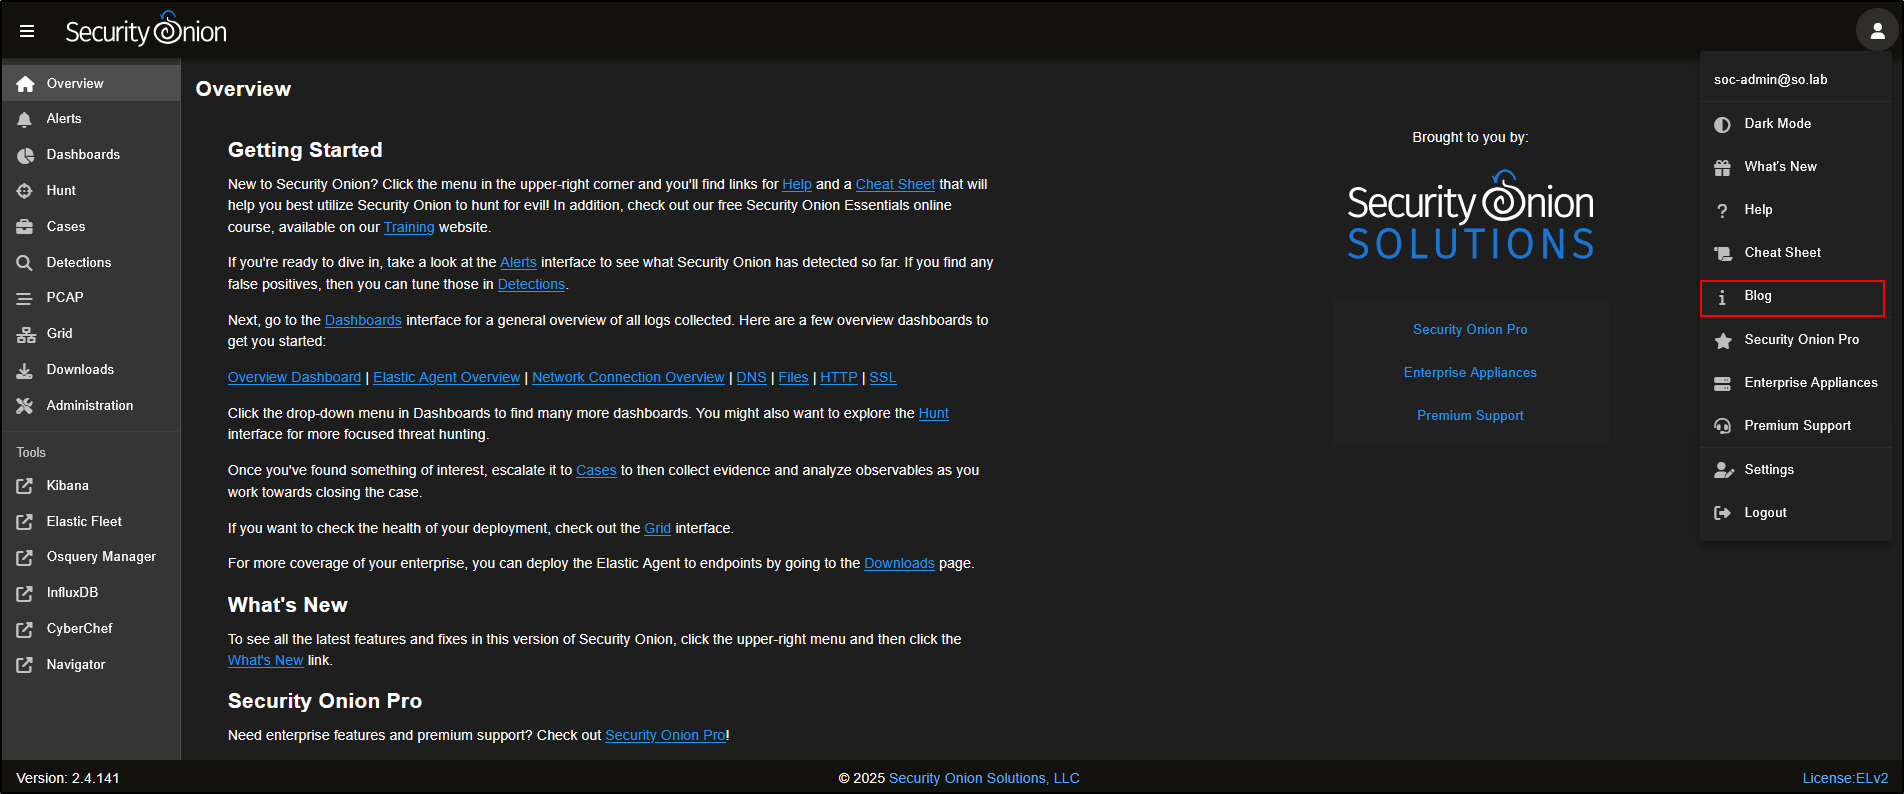
On the Overview page, you’ll find a silhouette icon in the top-right corner of the SOC interface. Clicking this opens up options like Dark Mode, the Cheat Sheet, the Blog, and your Account Settings.
Tip: Both the Cheat Sheet and the Security Onion documentation are available offline, so you can still access them even without an internet connection.
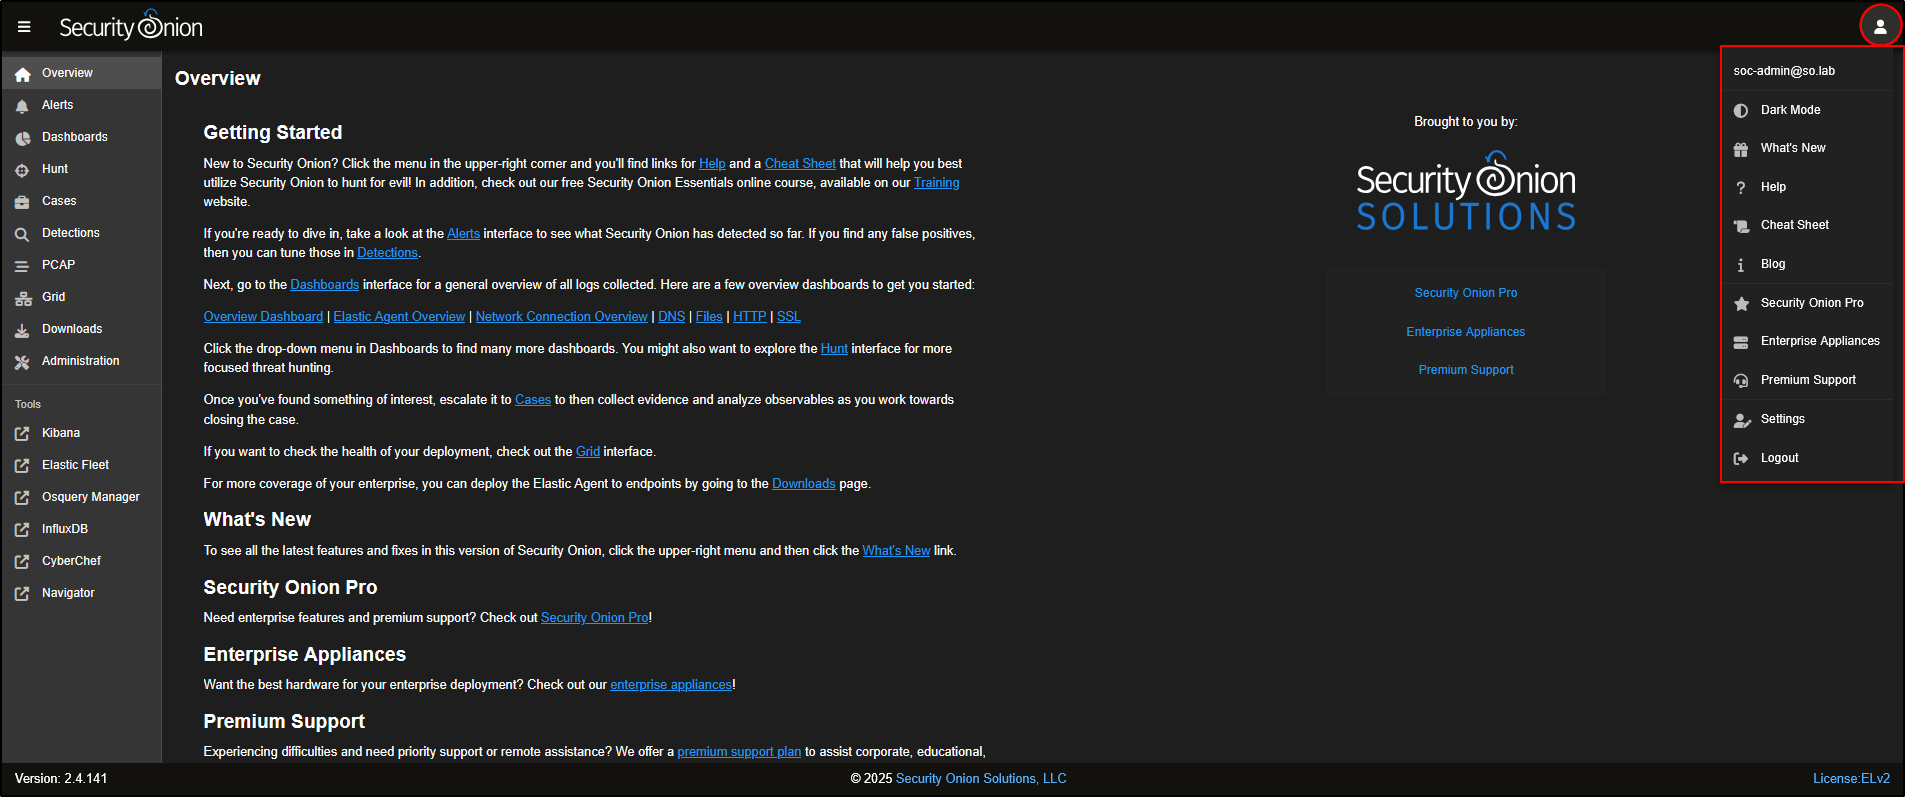
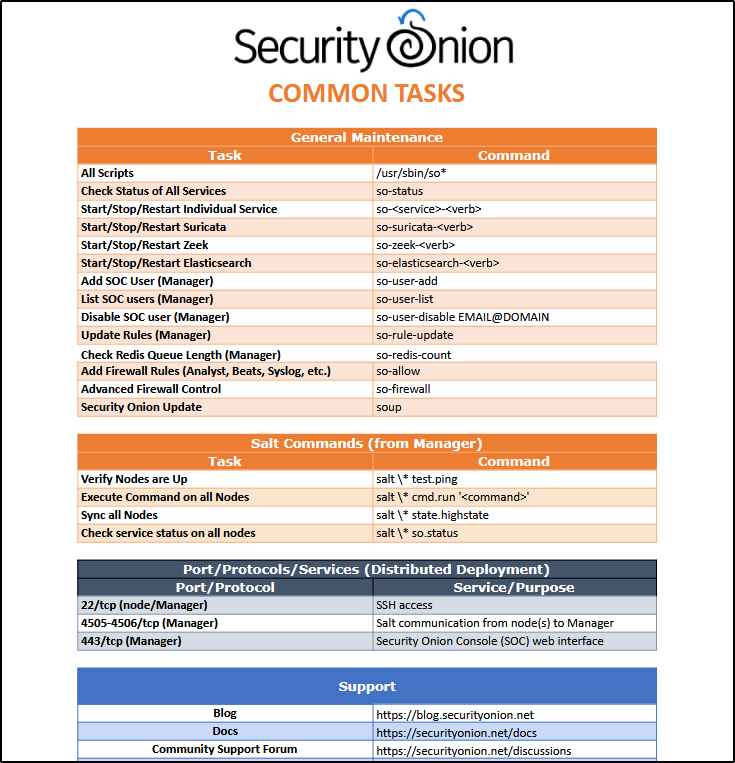
The Cheat Sheet is a handy reference that lists commonly used commands for day-to-day tasks in Security Onion.
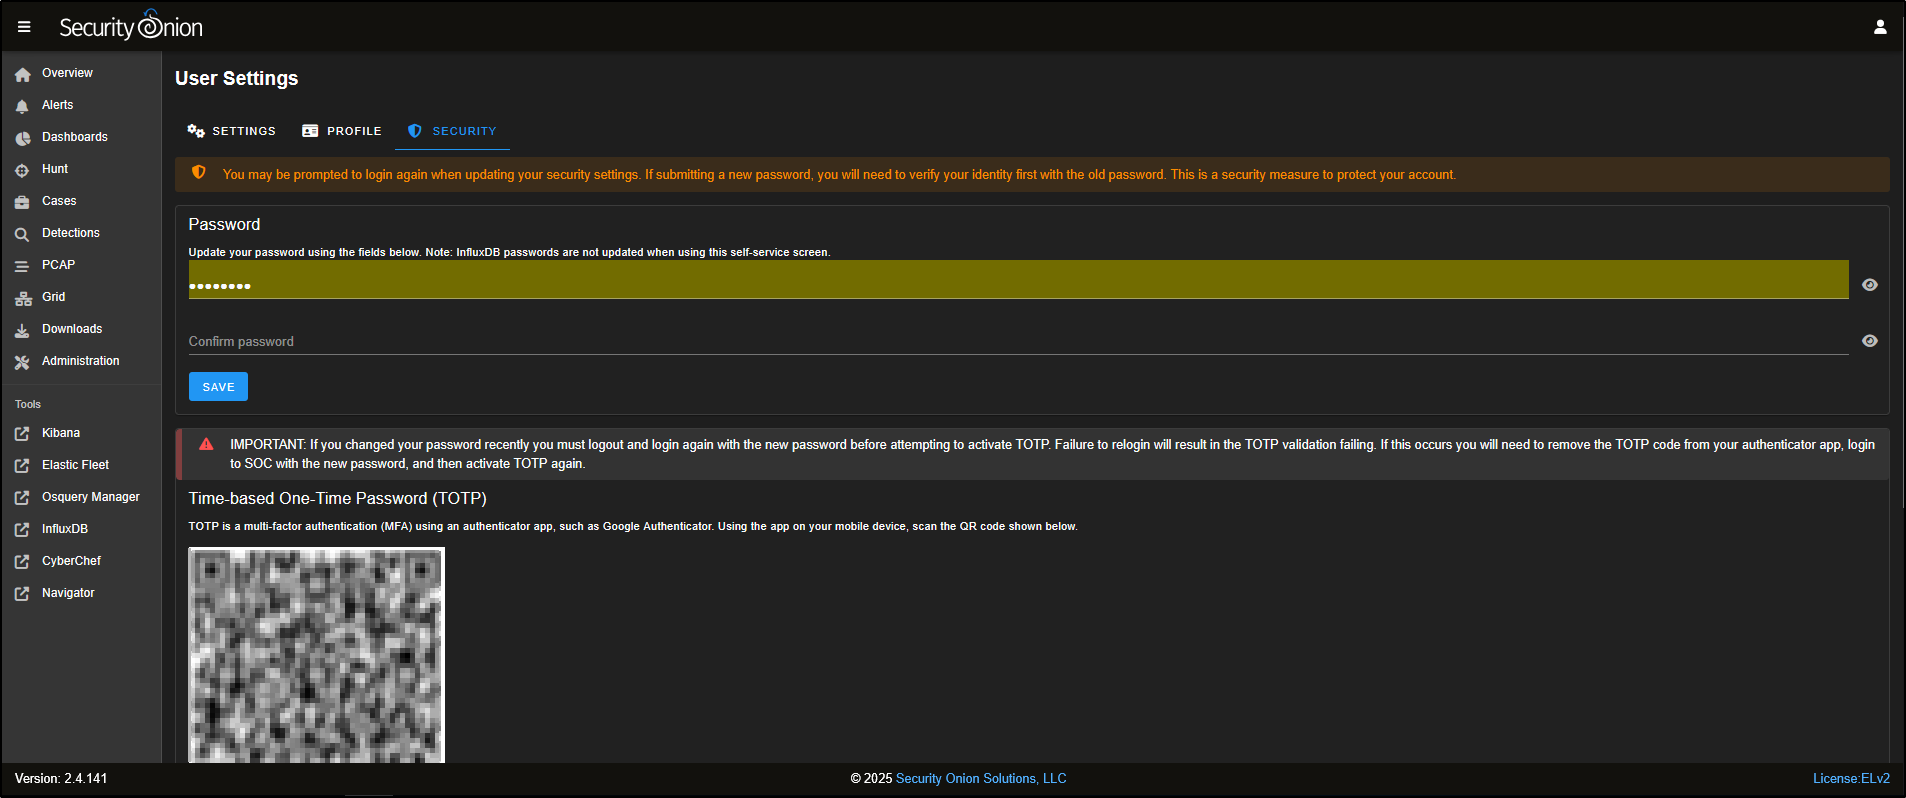
In the Account Settings menu, go to the Security tab to update your password or set up Multi-Factor Authentication (MFA) using Time-based One-Time Passwords (TOTP).
Grid
The Grid displays all the nodes that have been deployed in your Security Onion setup. In this example, there is only one node (so-standalone) listed.
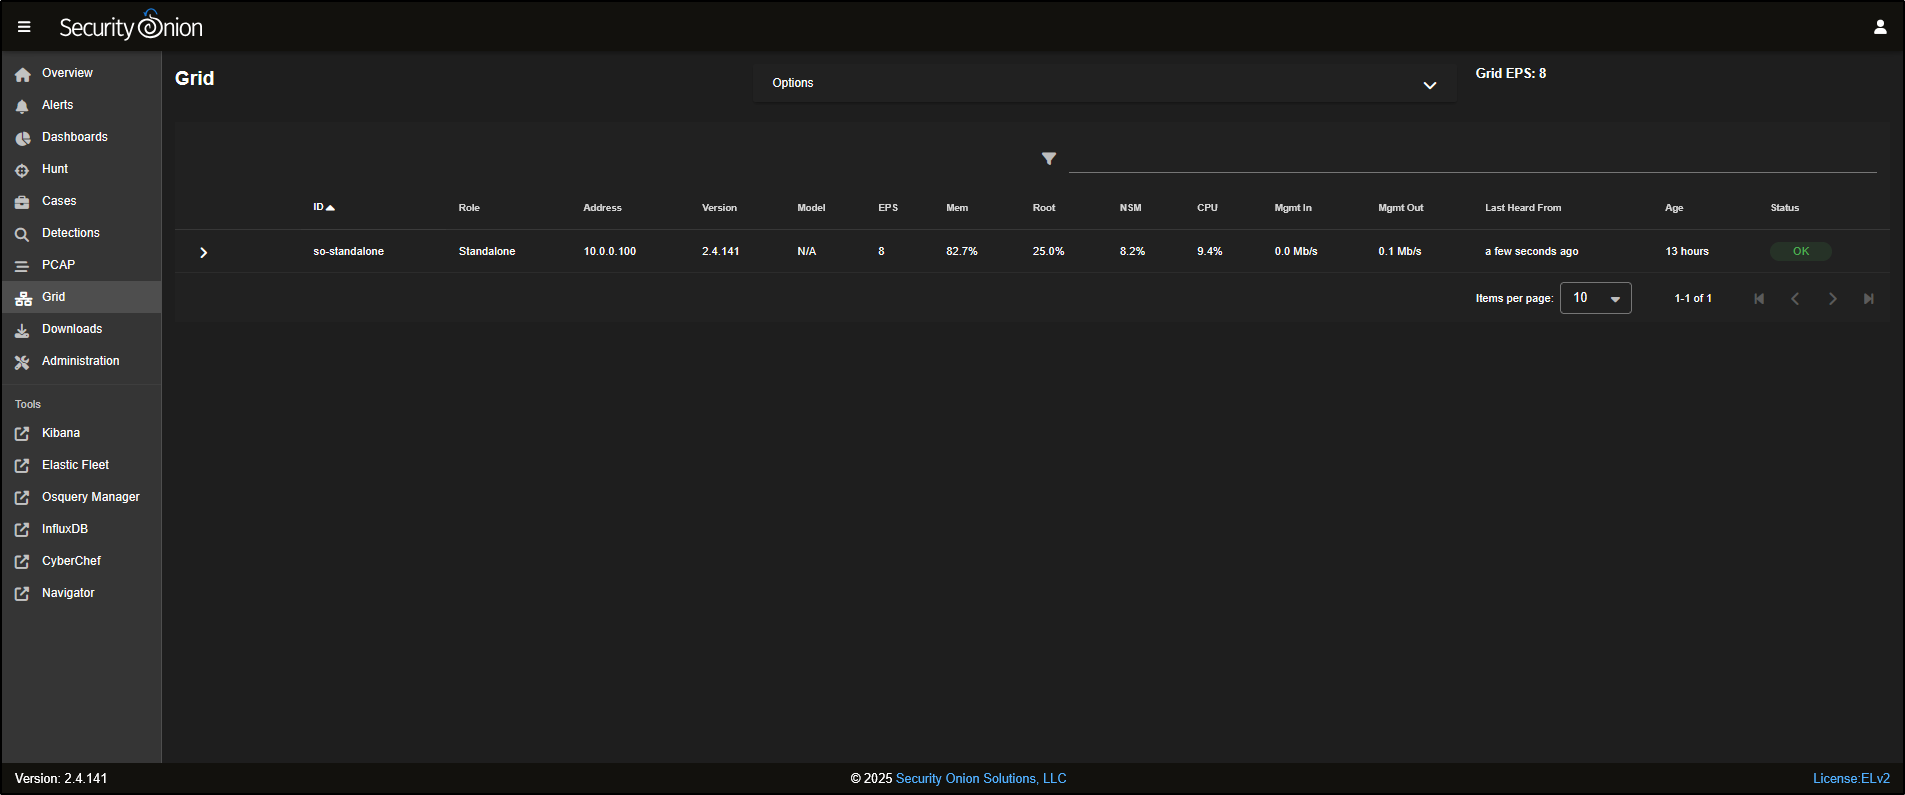
Clicking on the node will reveal more information, including the status of the node itself and the containers running on it.
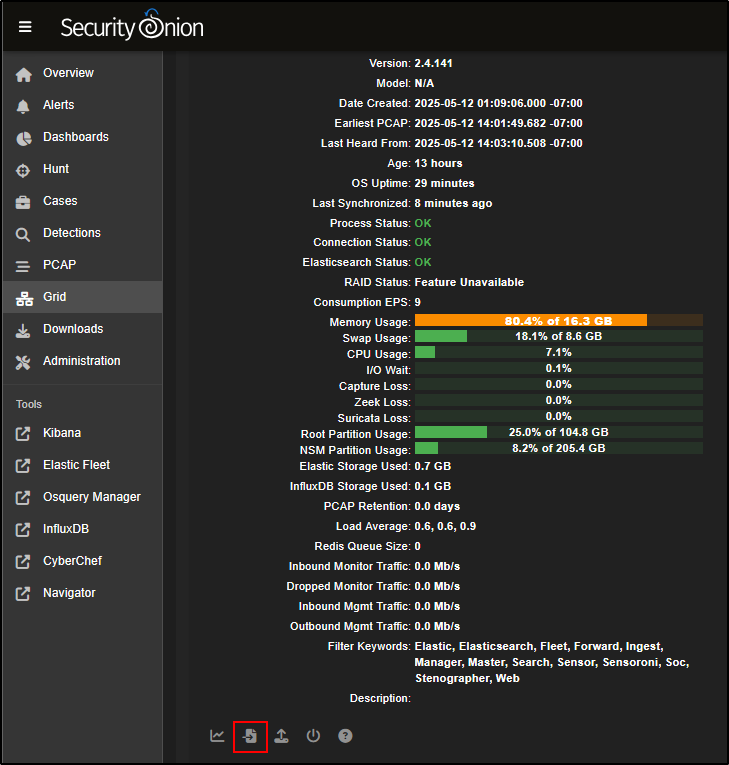
At the bottom of the Node Status panel, you’ll see five icons. From right to left:
- The help icon opens documentation for the Grid interface.
- The power button lets you reboot the node.
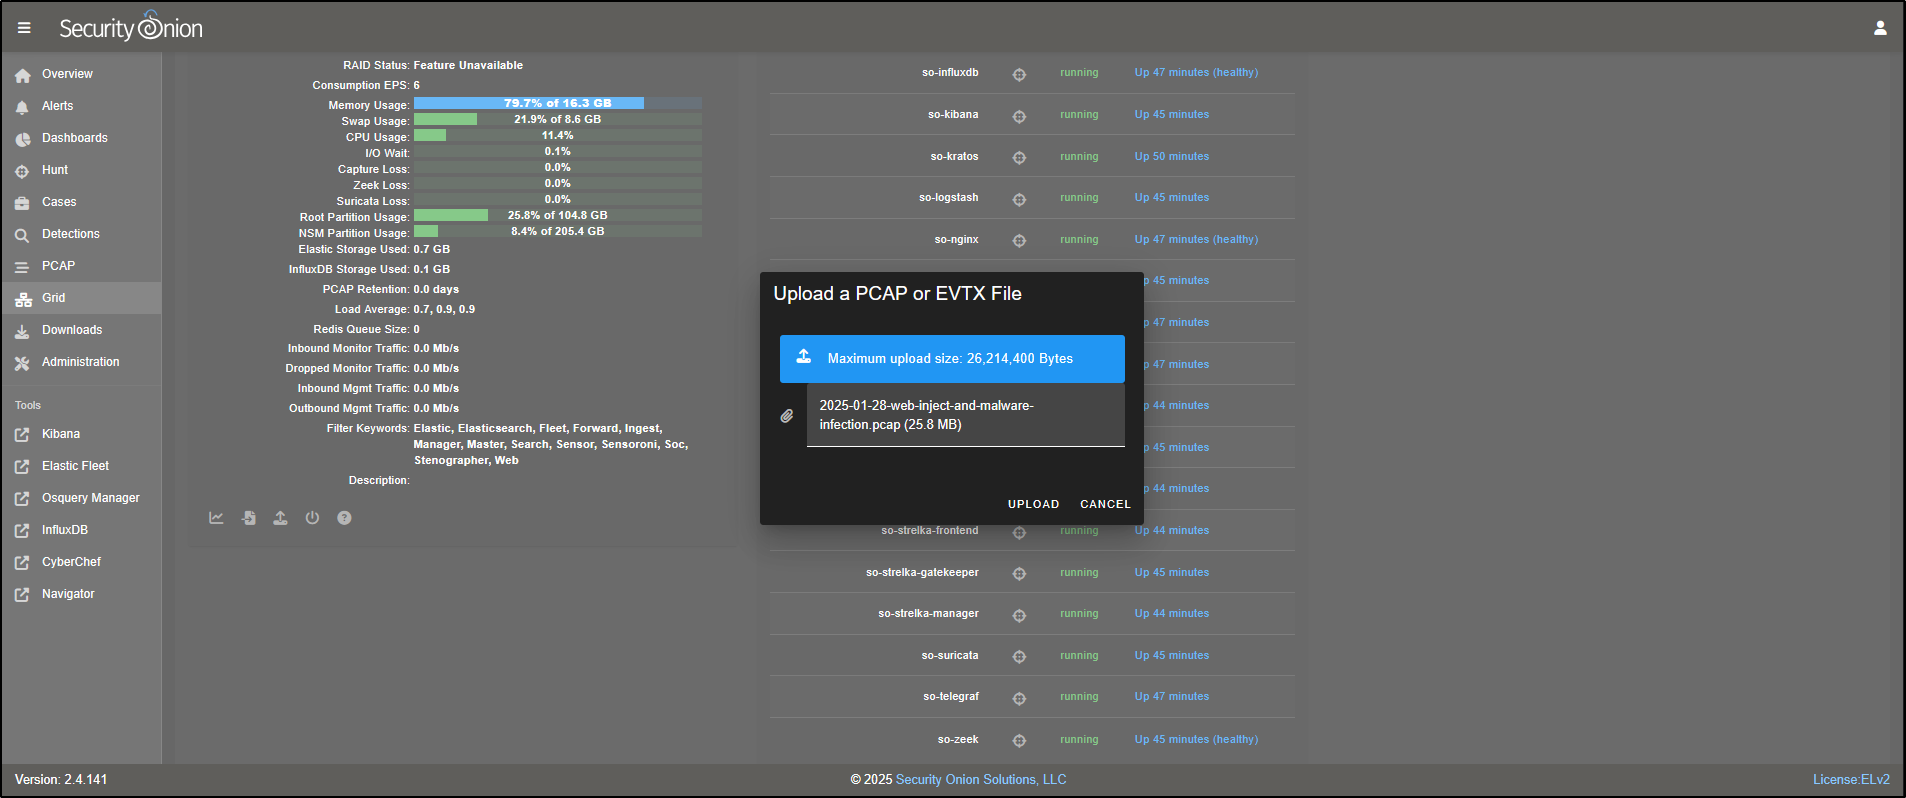
- The upload icon allows you to manually import files such as PCAPs or EVTX logs.
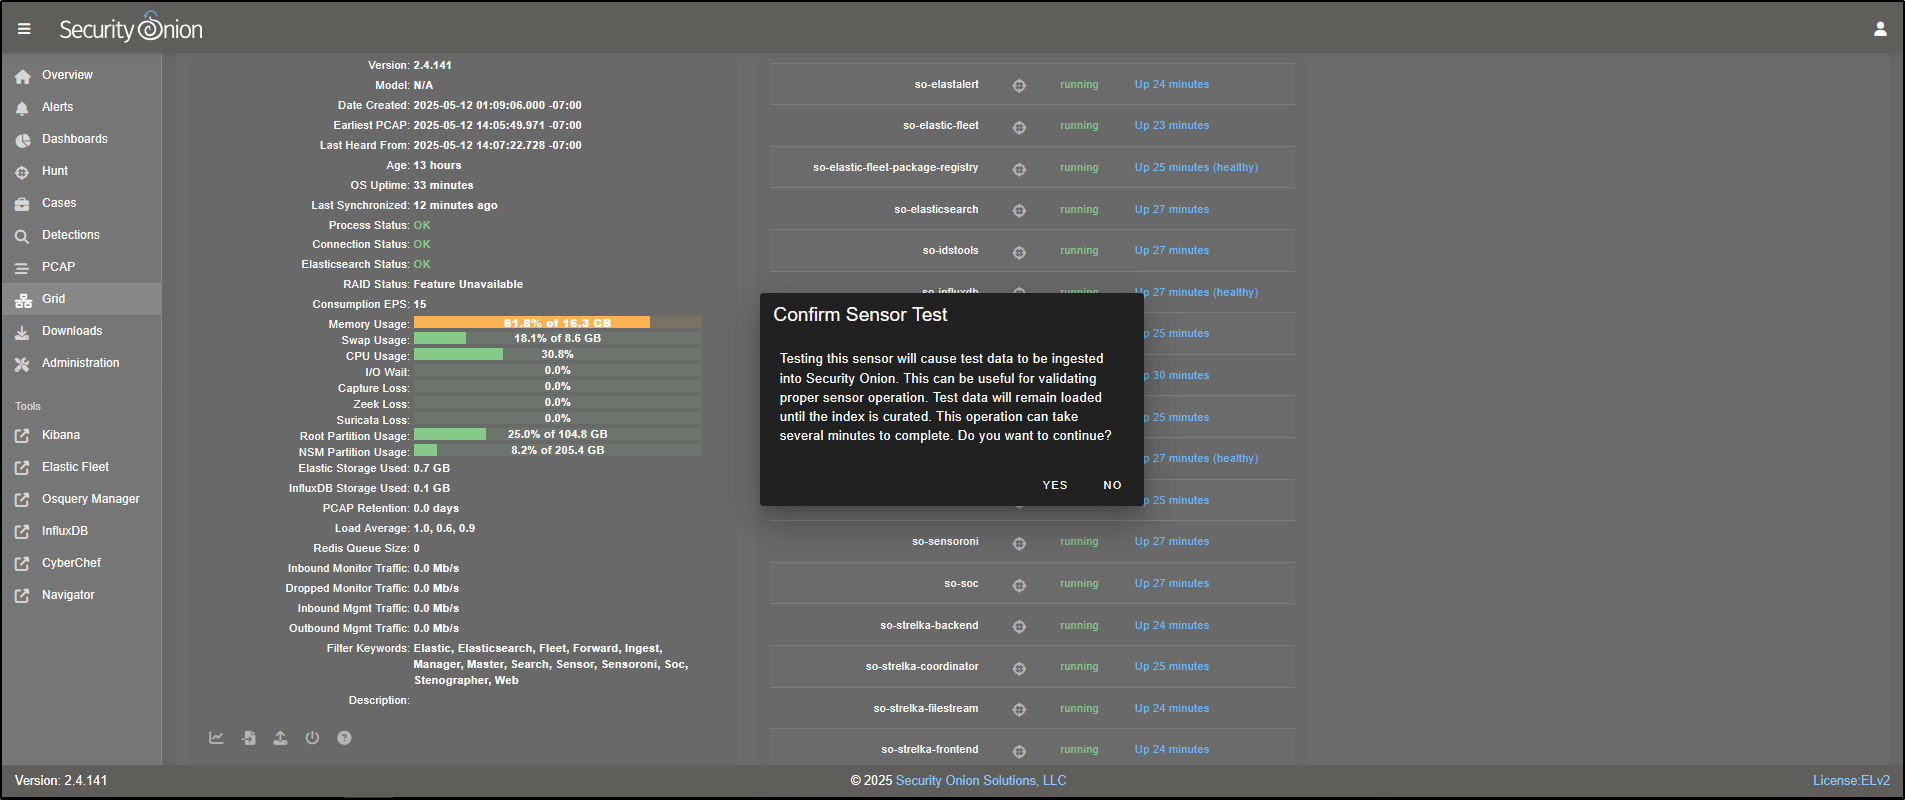
- The test data icon lets you simulate sample alerts and logs.
- The node status icon gives a detailed overview of the node’s current state.
Click the test data icon to load example data into Security Onion for testing.
This will load sample test data into Security Onion for demonstration purposes. When prompted, click Yes to proceed. Please note that this can take several minutes to complete.
If you would like to import your own PCAP, download a sample, for example, **2025-01-28-web-inject-and-malware-infection.pcap. Then click the upload** icon and select the PCAP file to upload it into Security Onion.
Alerts
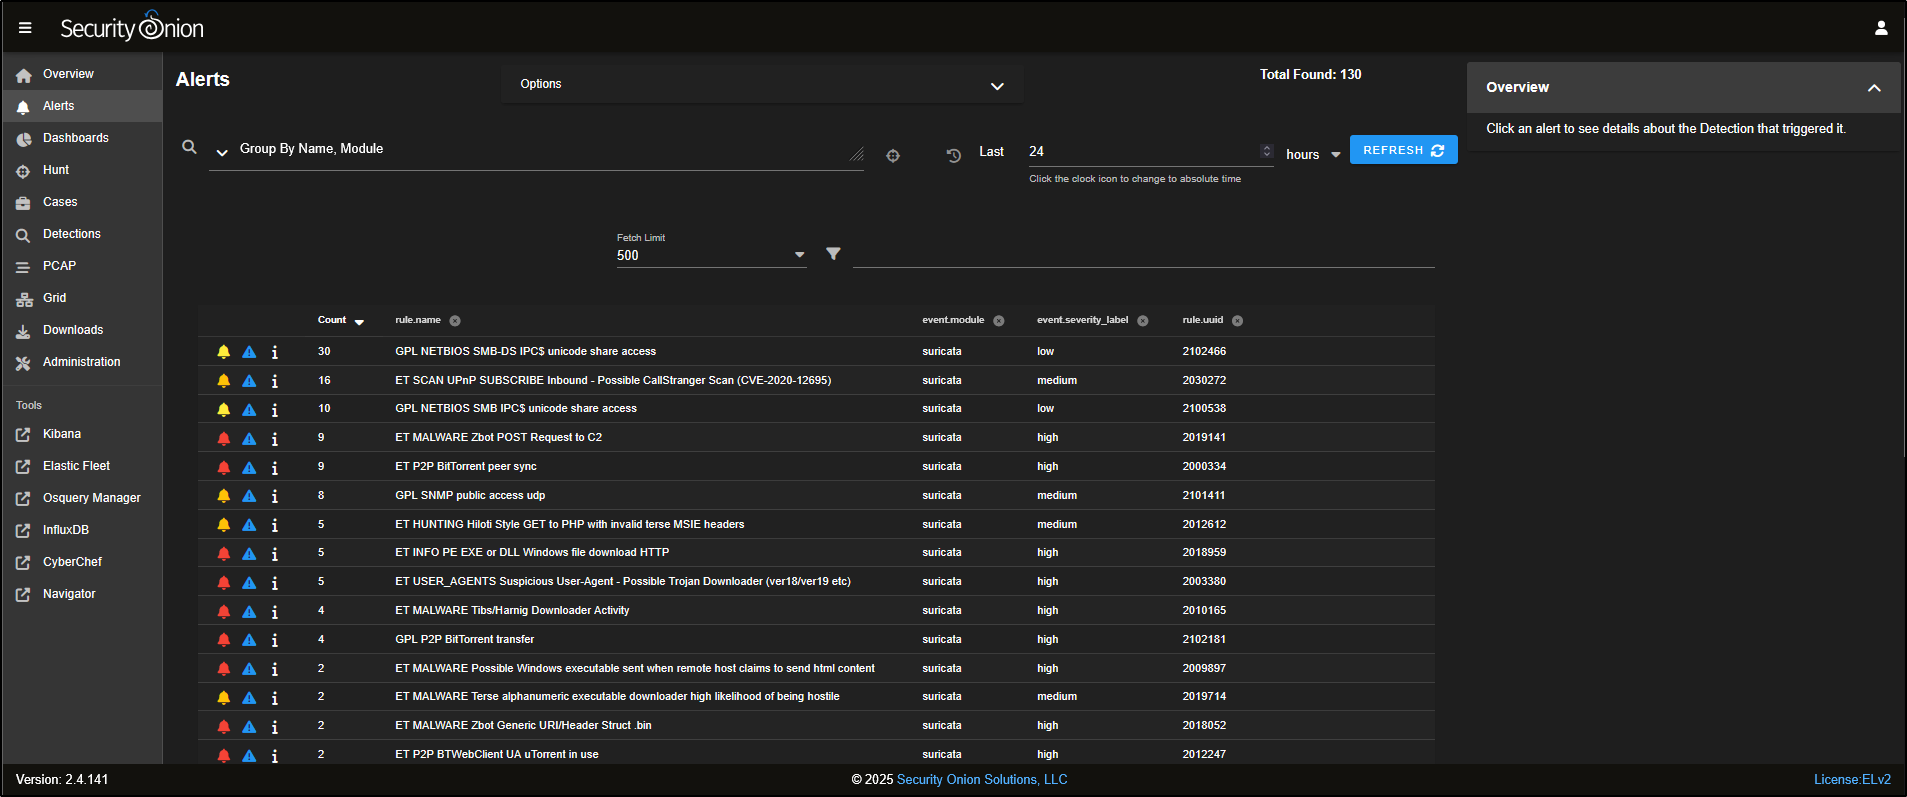
Go to the Alerts tab in the SOC interface. This is where you will find alerts for suspicious or potentially malicious activities in your environment.
It does not matter whether the alert comes from a Suricata, Sigma, or Yara rule. If the alert is triggered, it will show up here. By default, alerts are grouped by rule name. For example, you might see 11 alerts under the rule ET P2P BitTorrent Peer Sync.
Emerging Threats (ET) is a well-known set of intrusion detection rules. It is developed and maintained by the community (and by Proofpoint for the commercial version) and helps detect a wide variety of network-based threats.
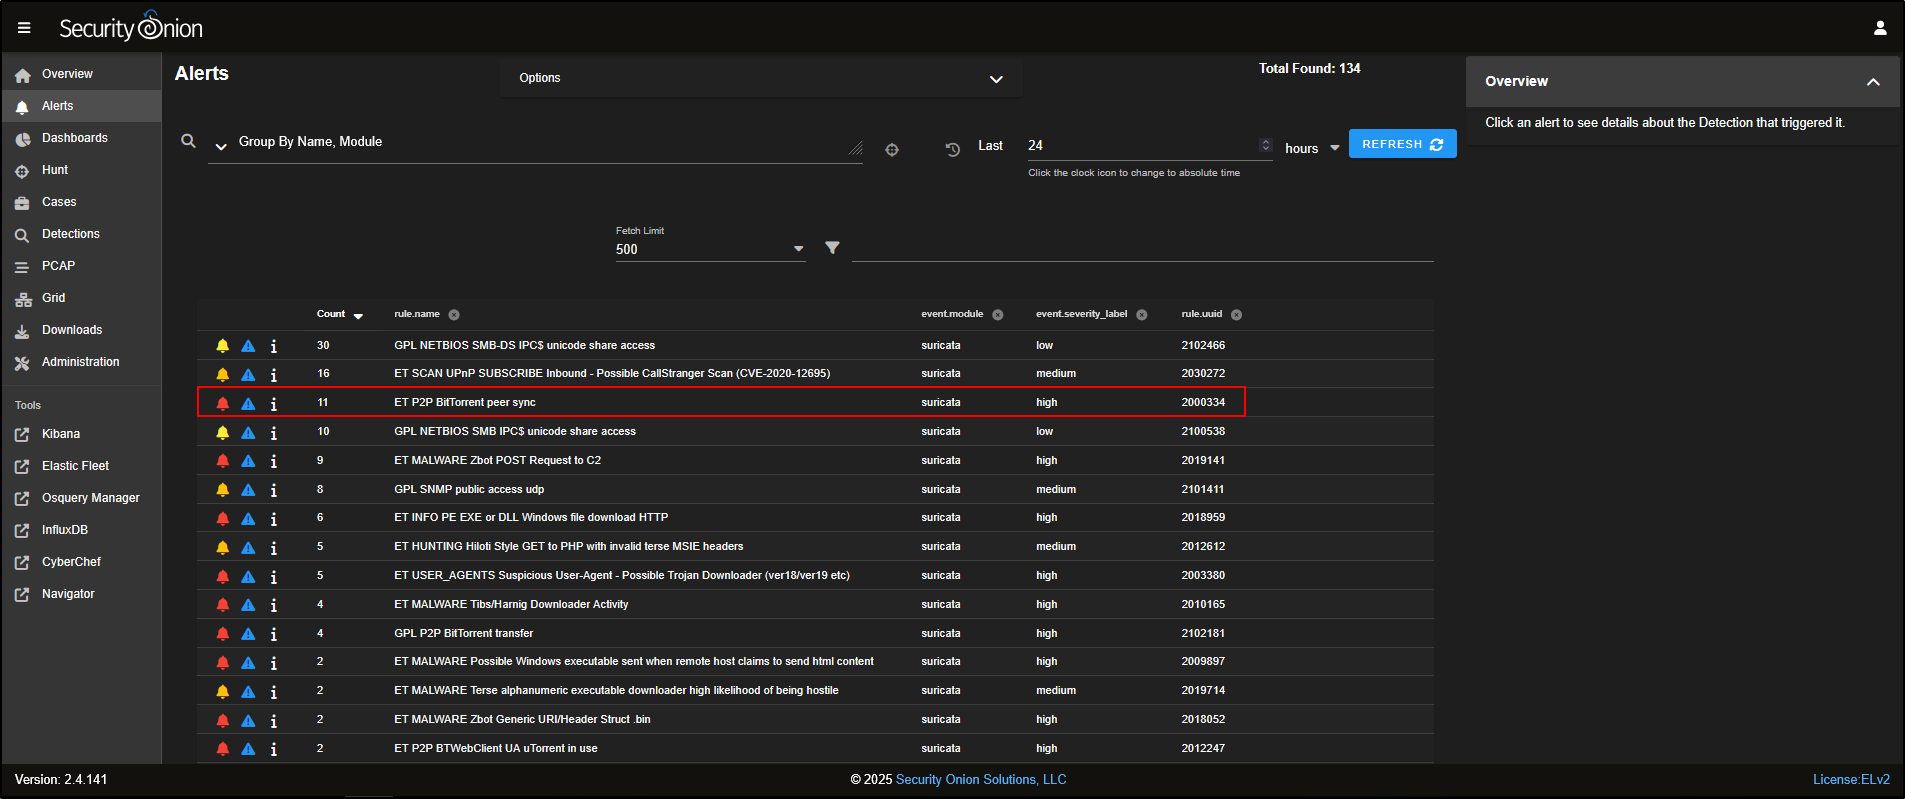
To look more closely at individual alerts, click on the number next to the rule name.
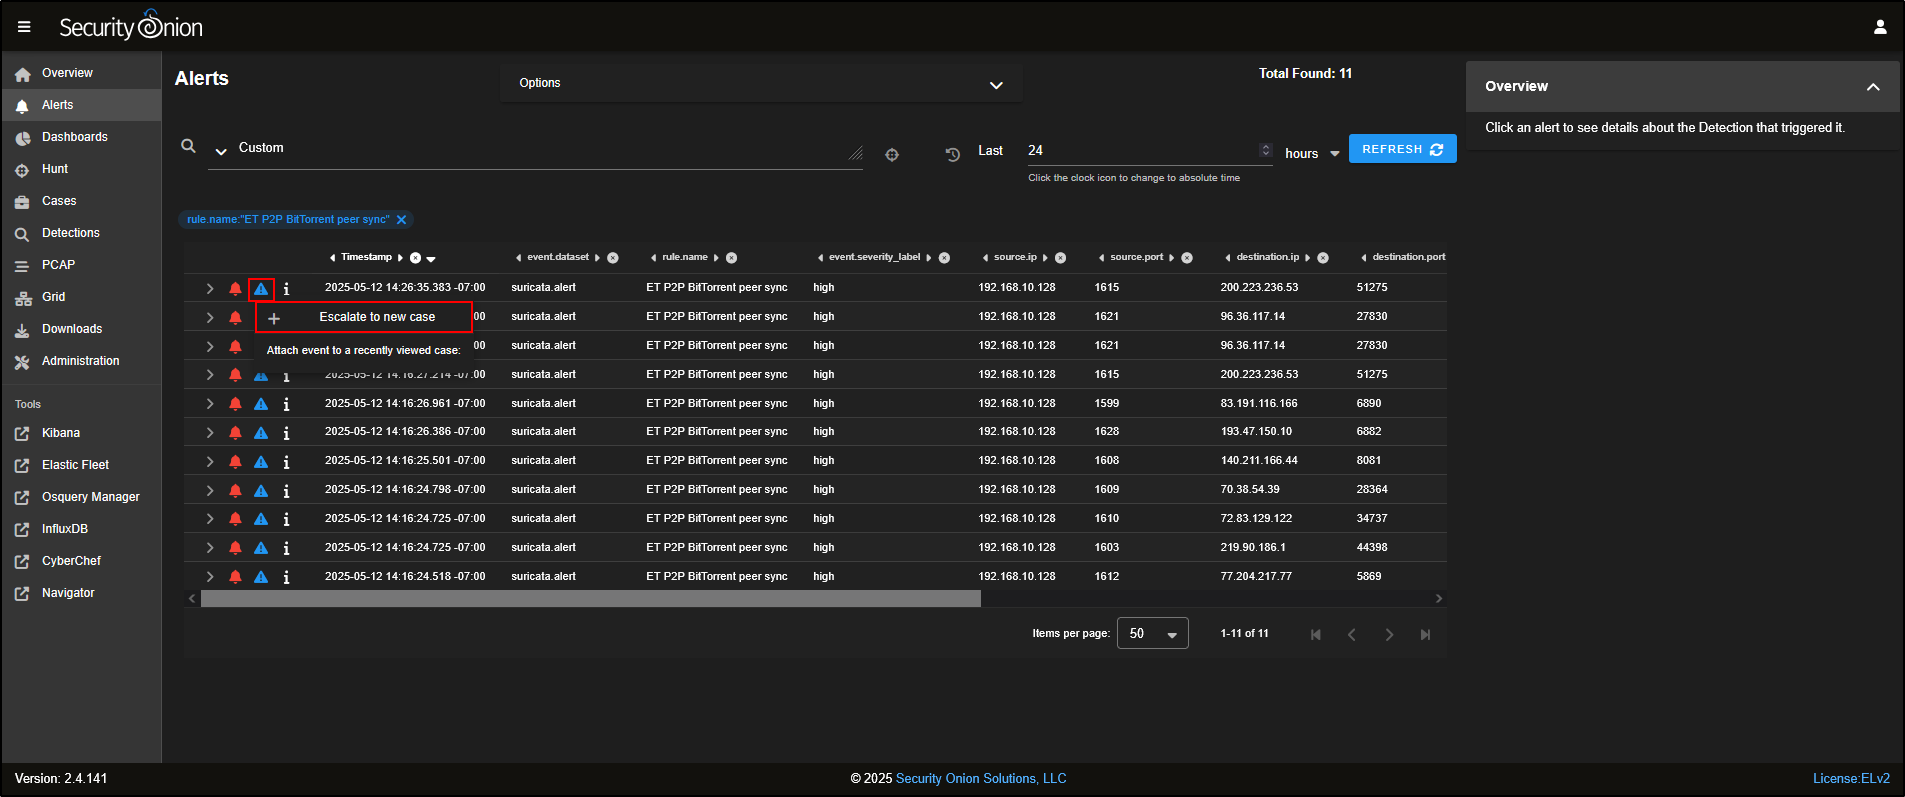
You will also see a few icons next to each alert:
- The bell icon is used to acknowledge the alert - this hides it from the main view but does not delete it.
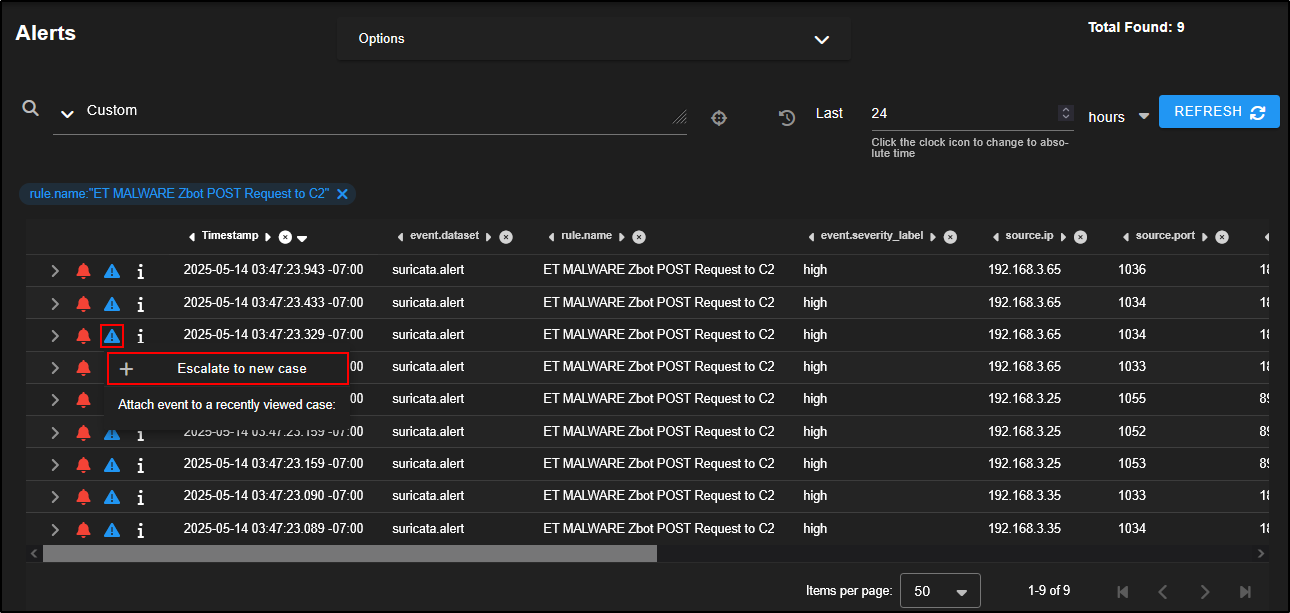
- The triangle icon is used to escalate the alert into a case for further investigation.
To escalate, simply click the triangle and choose Escalate to new case.
You can also fine-tune how a rule behaves by clicking on the rule name and selecting Tune Detection from the menu.
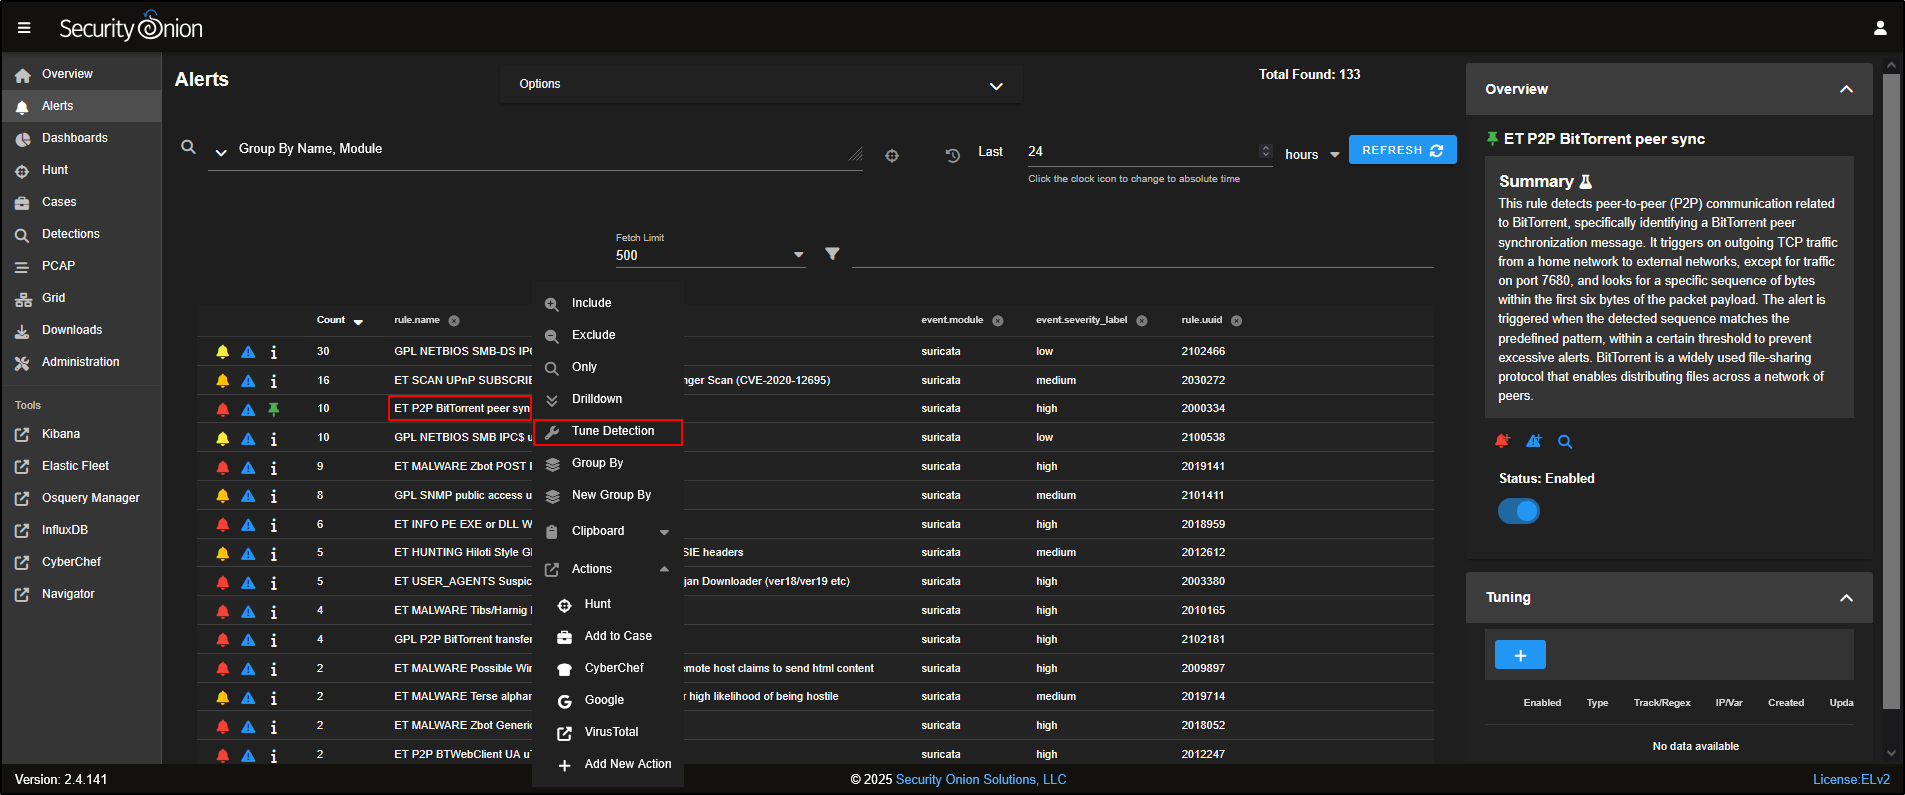
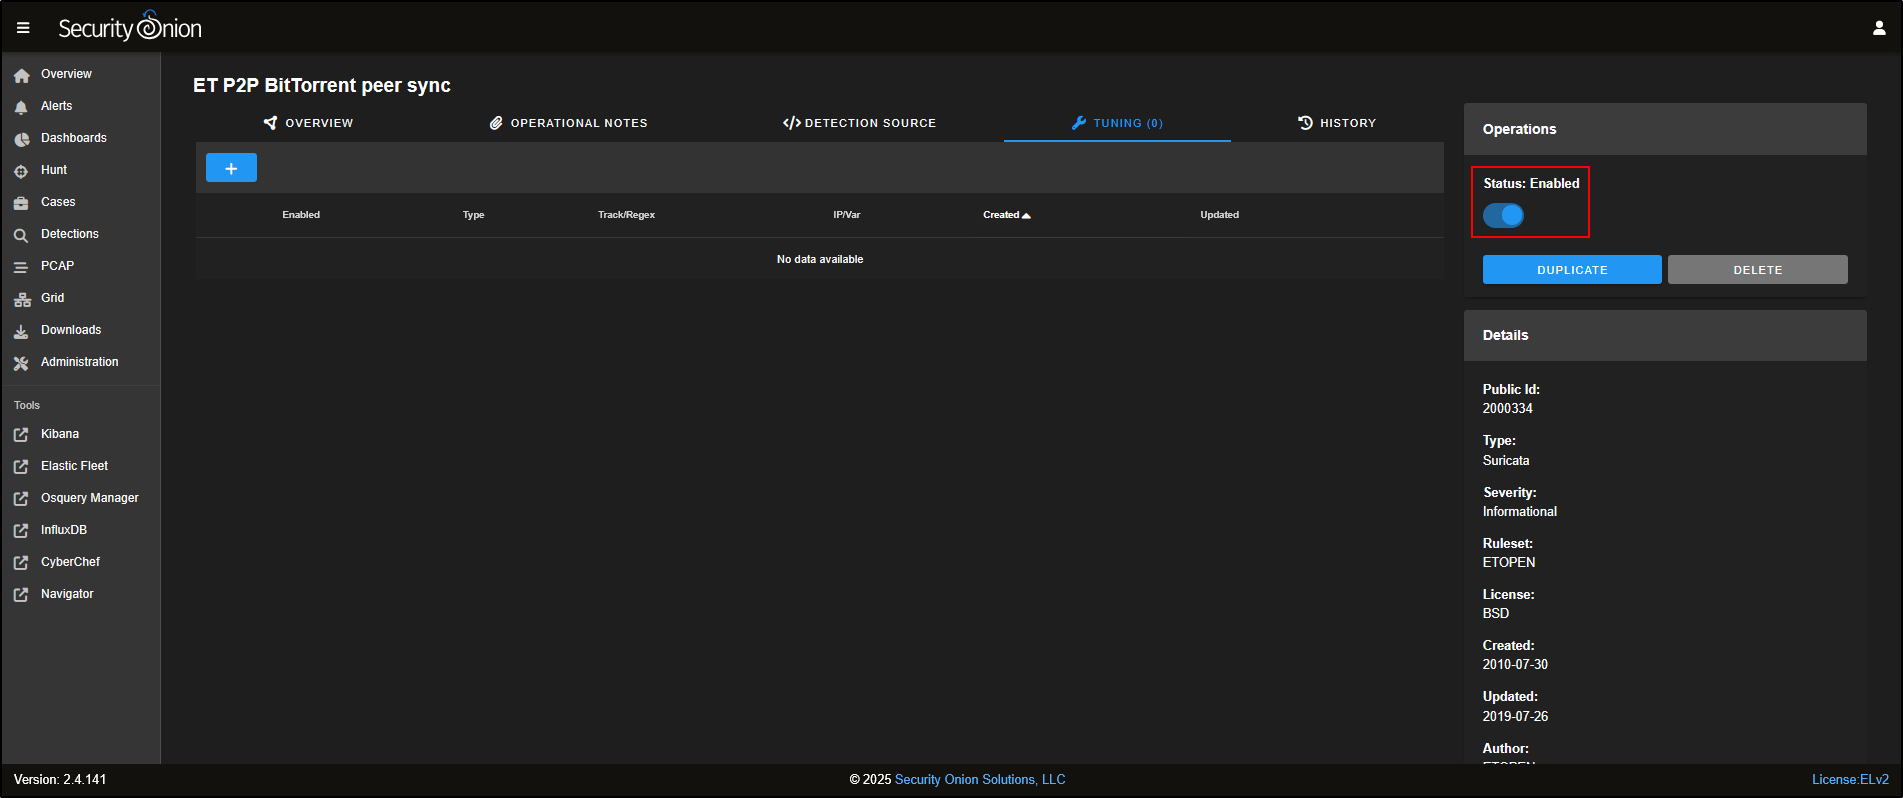
This opens the Tune Detection page, where you can enable or disable the rule, or adjust its settings to better suit your environment.
Cases
Go to the Cases tab in the SOC interface. You will see any cases that have been created, usually named after the alert that was escalated.
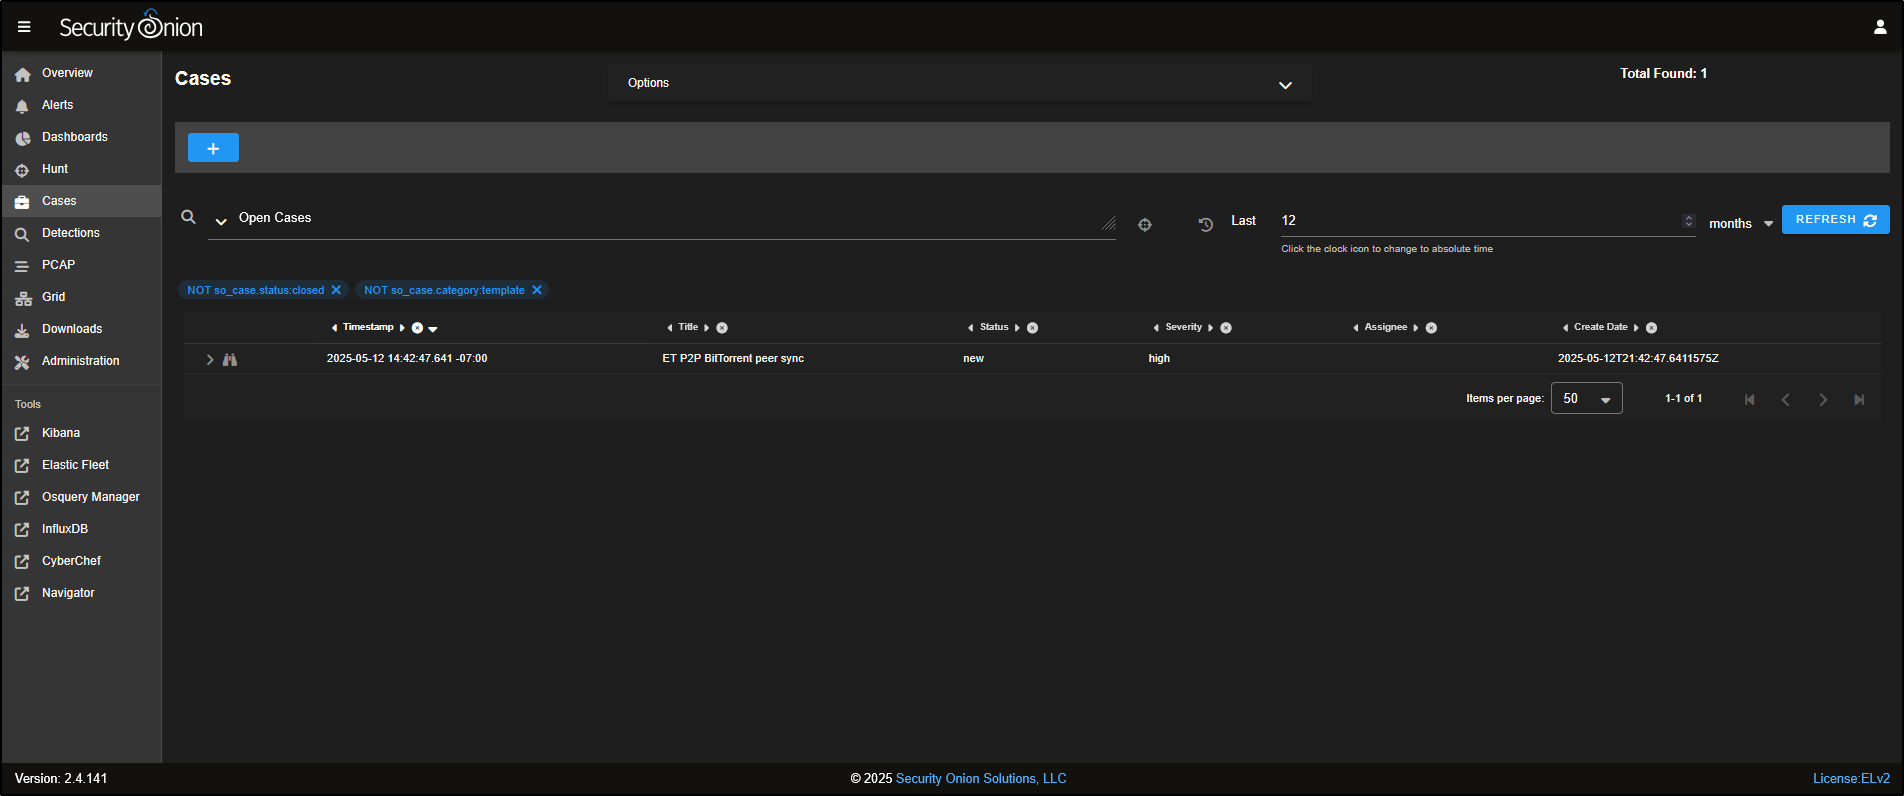
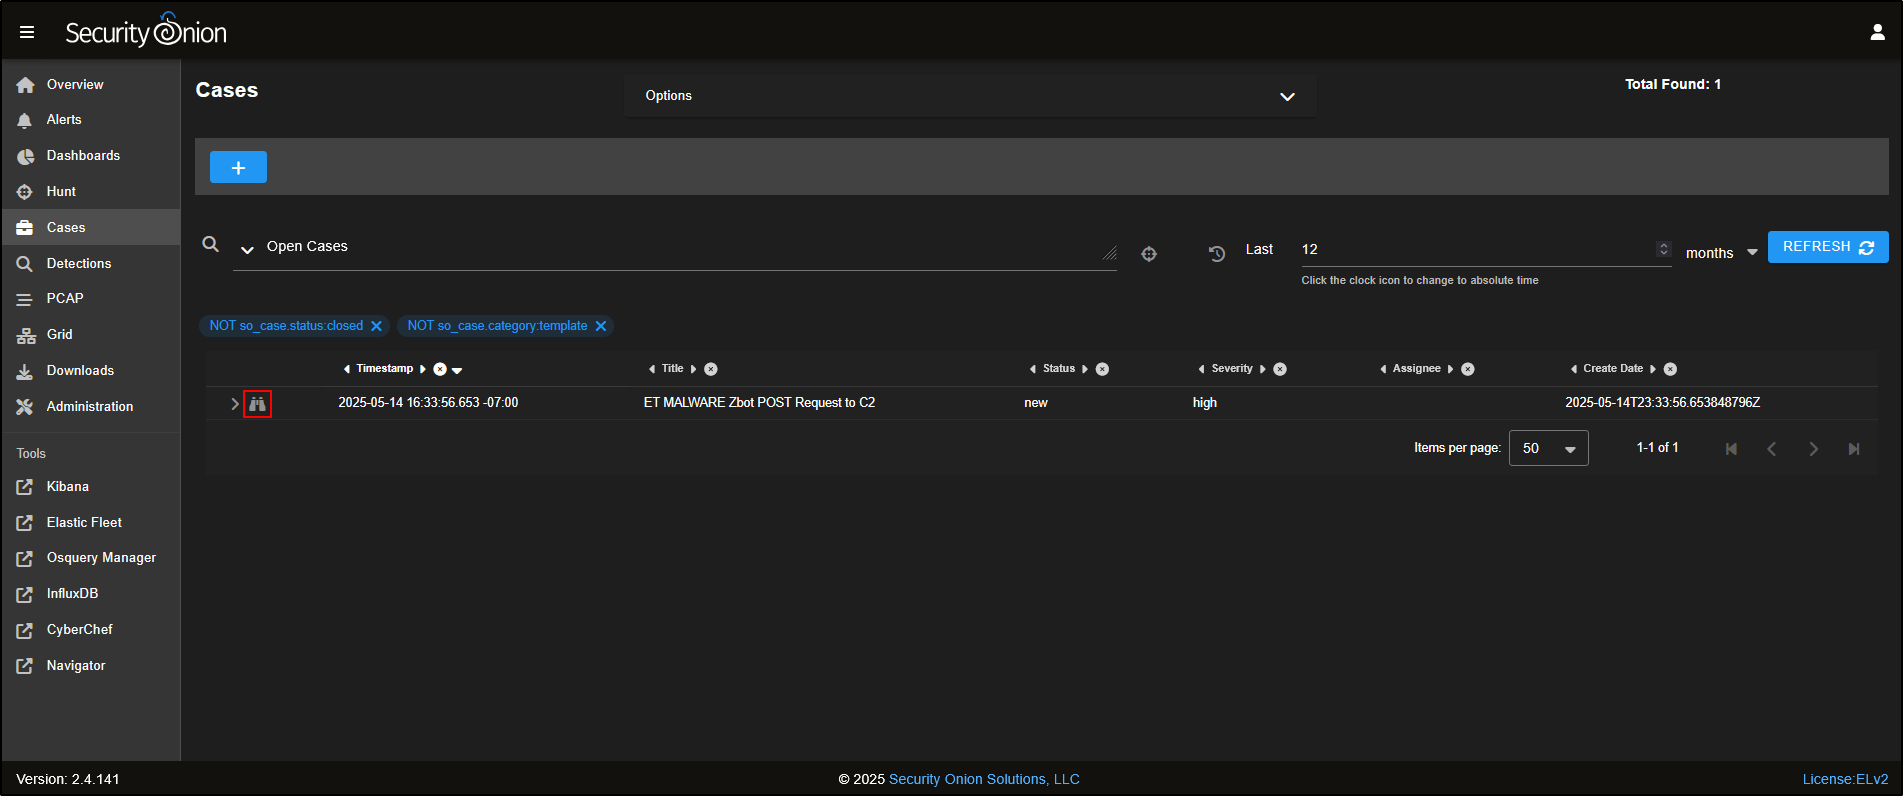
As you investigate, you can record notes and observations to track what triggered the alert. Click on the binoculars icon to open the case and add your comments or findings.
Hunt
Head over to the Hunt tab in the SOC interface. The Hunt tool is built to be a fast, flexible workspace for analysts to dig into data during investigations.
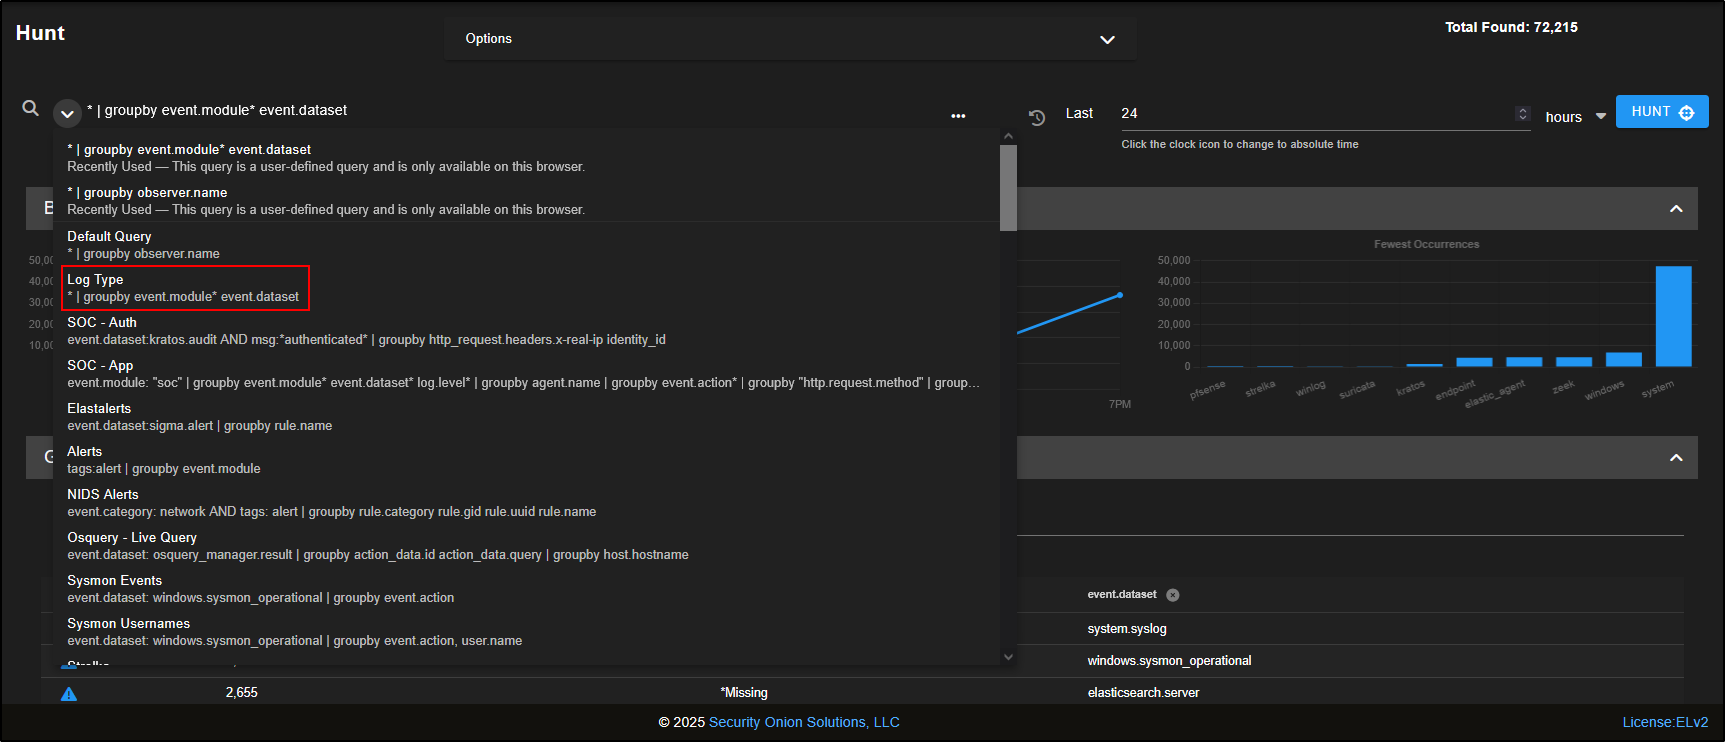
At the top of the Hunt page, you will find a query box, along with a list of prebuilt queries you can use straight away. You can also create your own custom queries tailored to your environment and use cases.
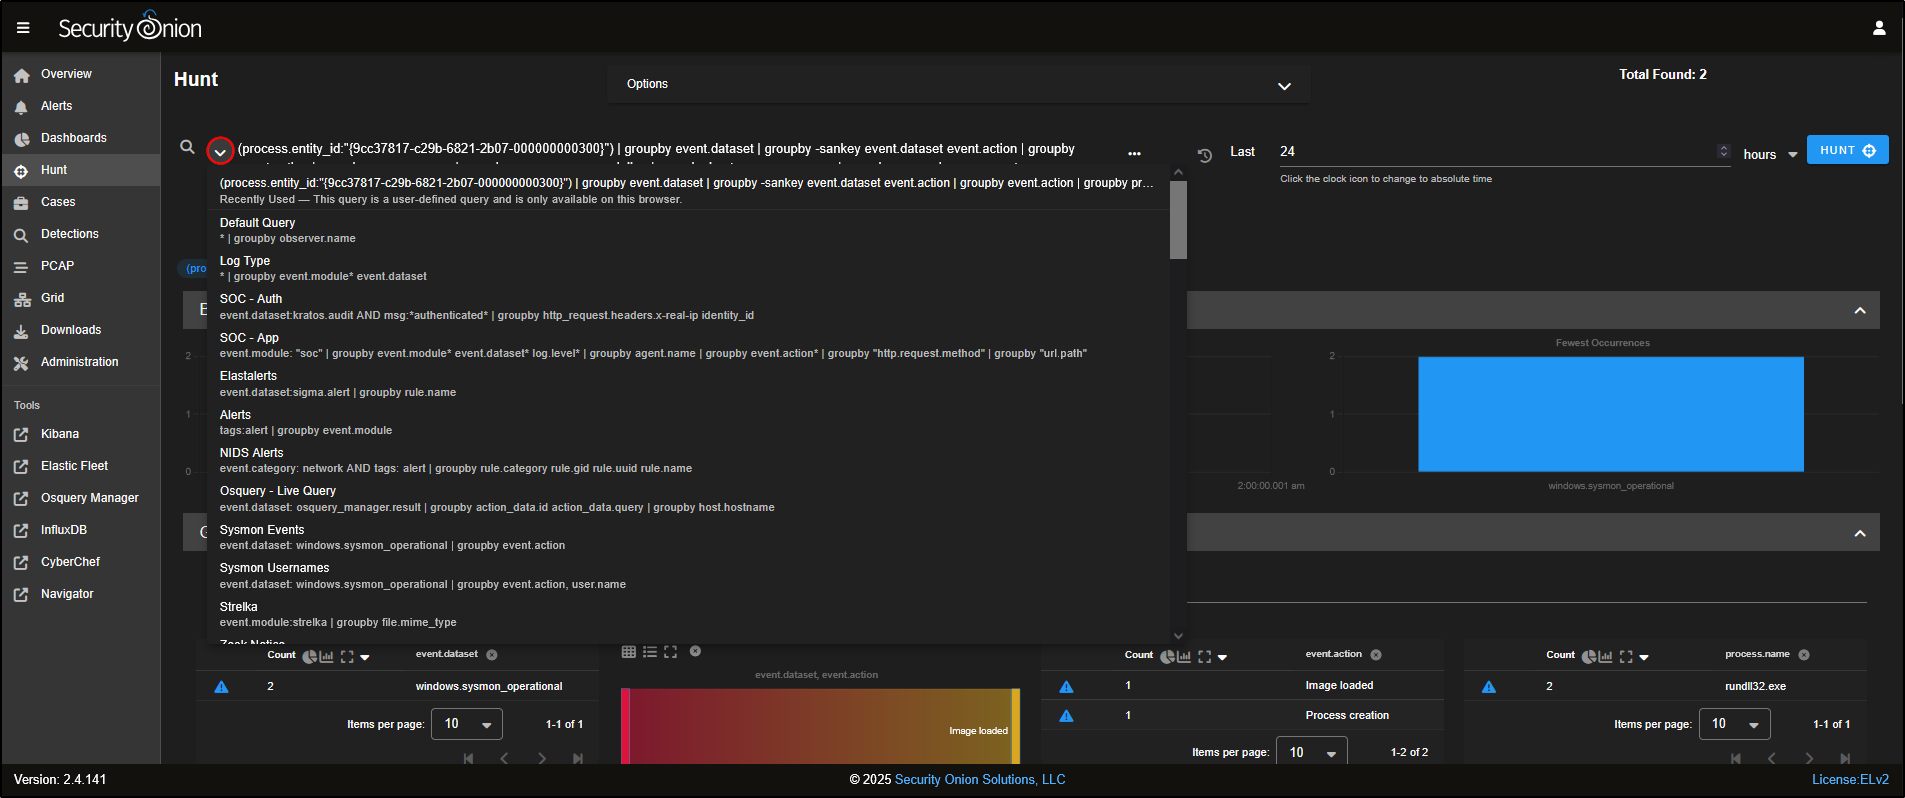
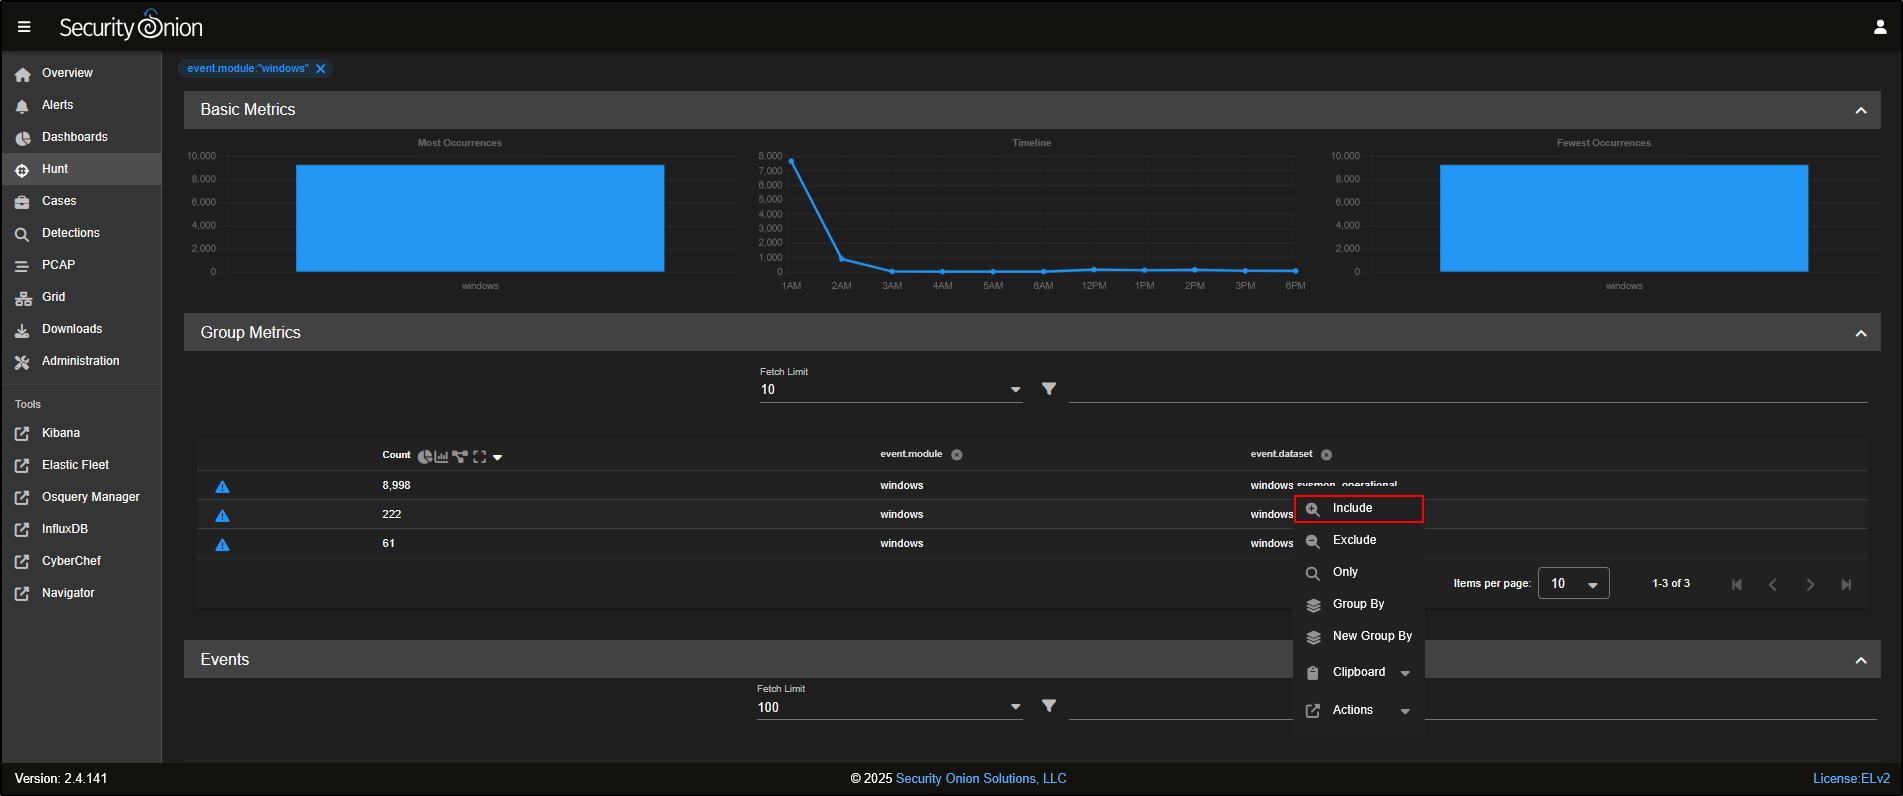
For example, the Log Type query shows all the different types of logs that Security Onion has collected. These logs are grouped into datasets based on the type of data and its source.
If you want to focus your hunt on Sysmon logs, click on windows and select Include to add it to your search query.
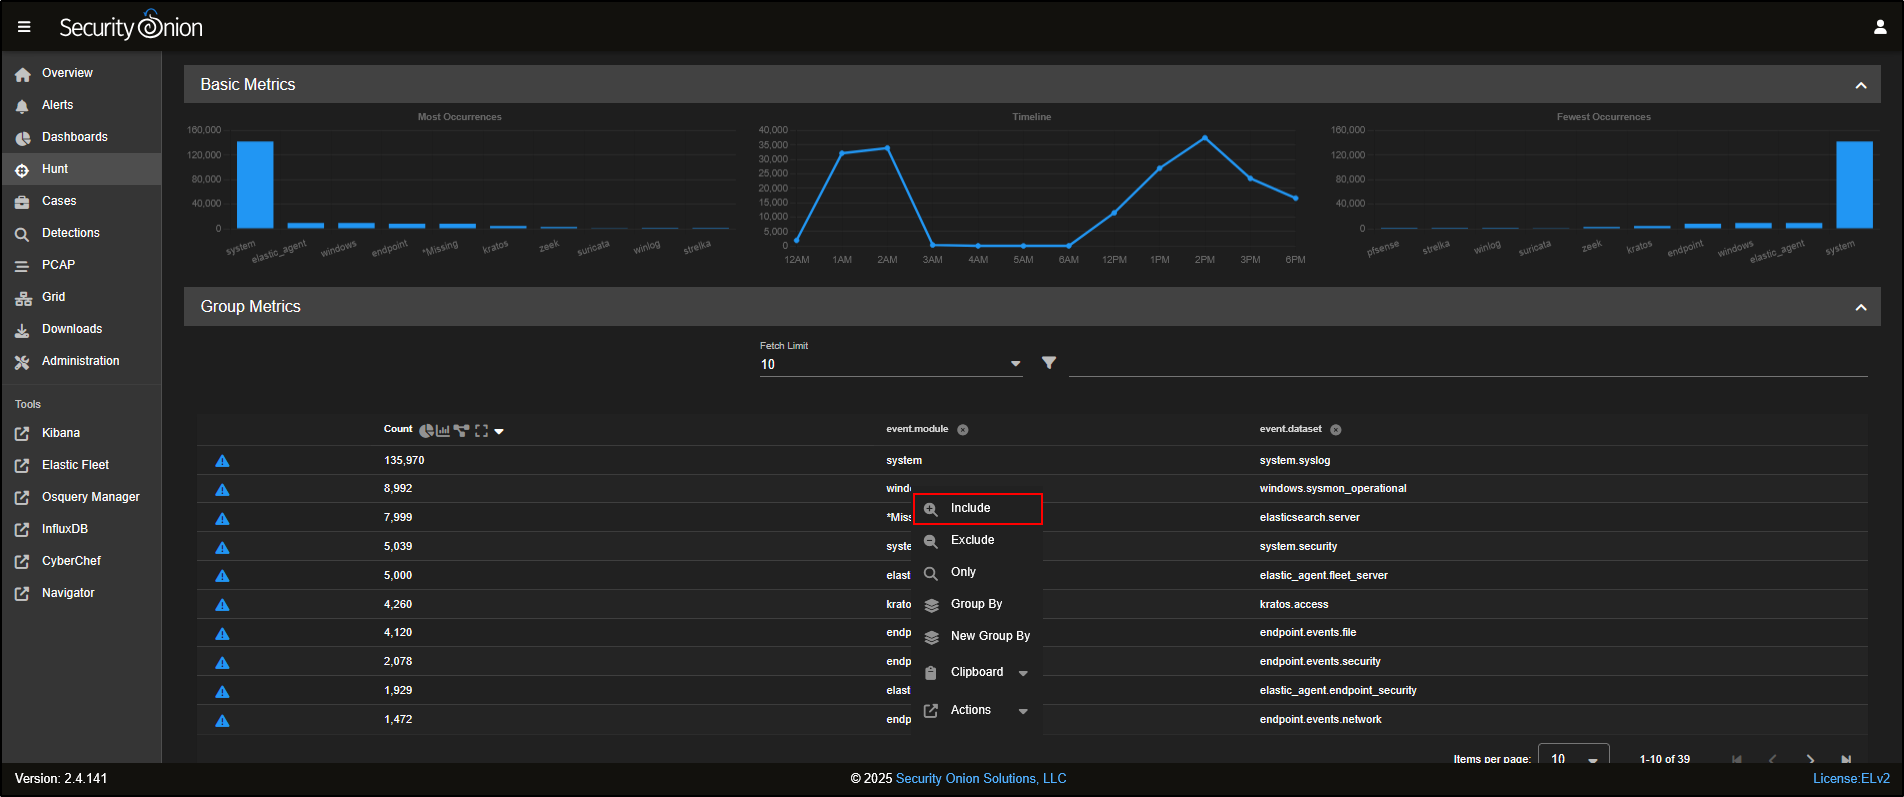
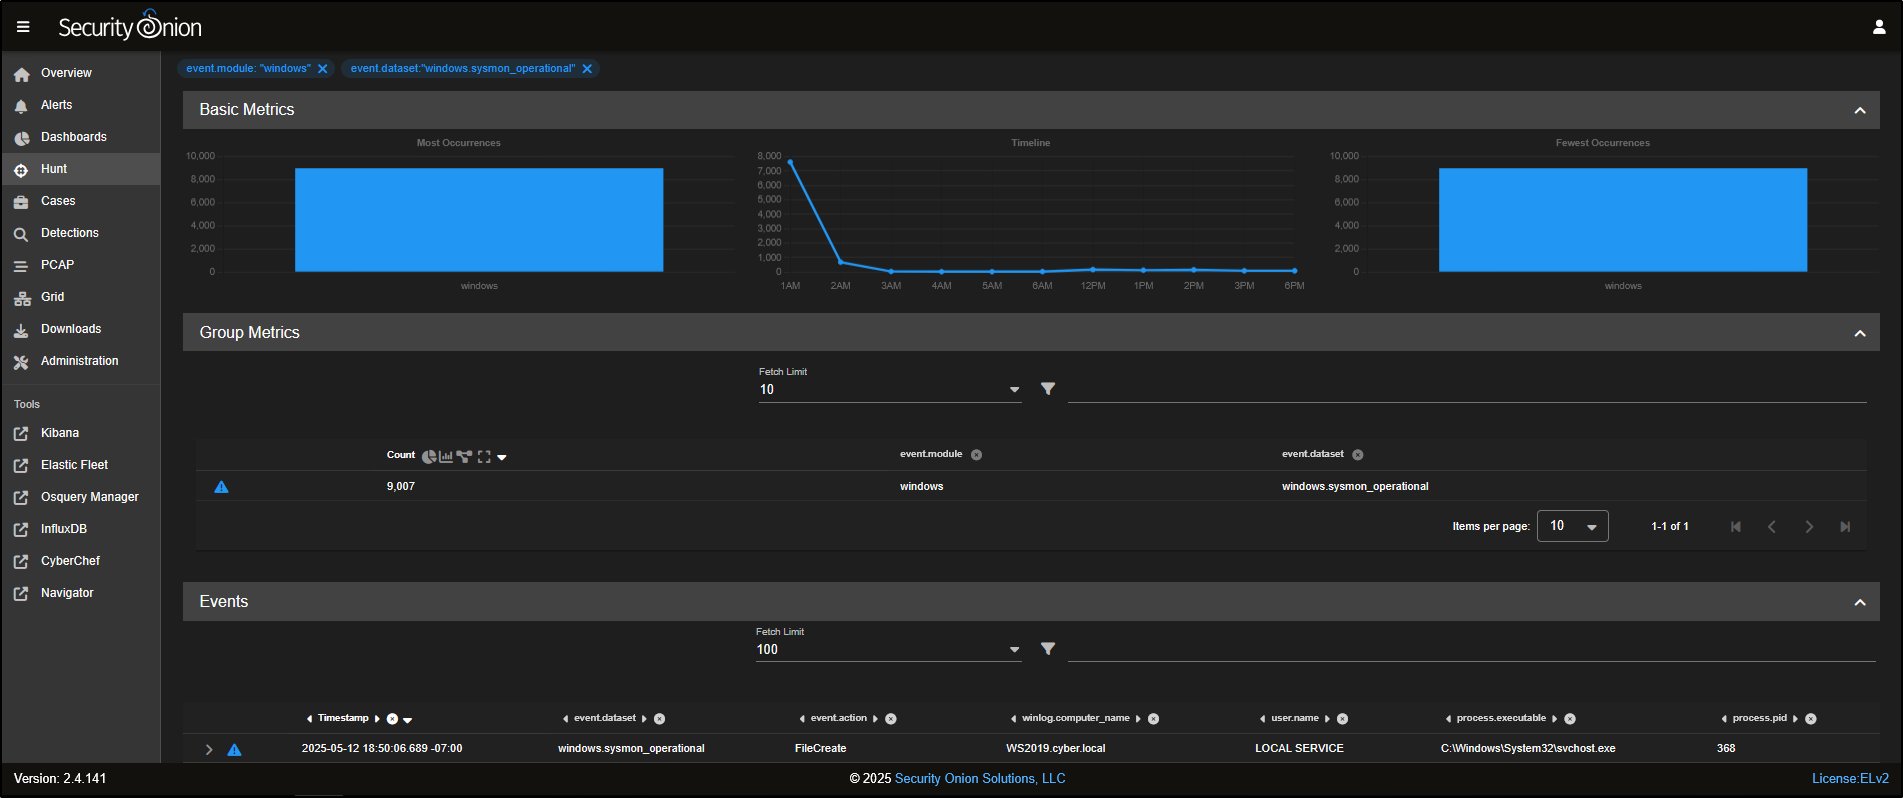
You will now notice that the Group Metrics pane is filtered to show only records from the windows dataset.

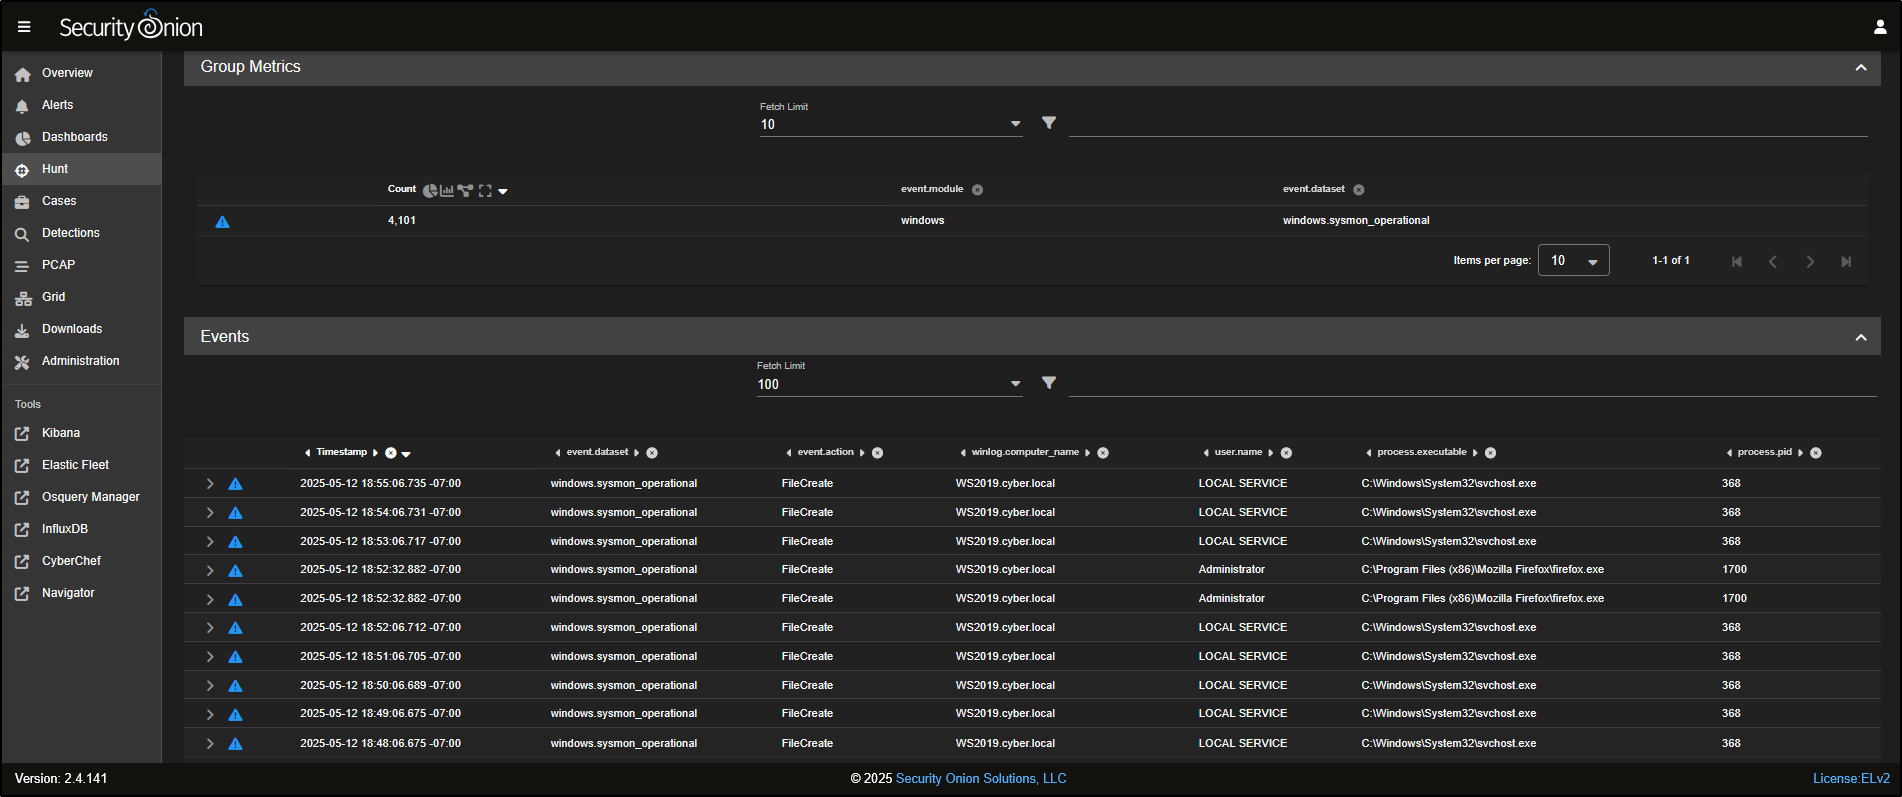
To narrow it down even more, you can select windows.sysmon_operational and click Include to filter specifically for Sysmon operational logs.
Now, the Group Metrics pane shows only data from the windows.sysmon_operational dataset.
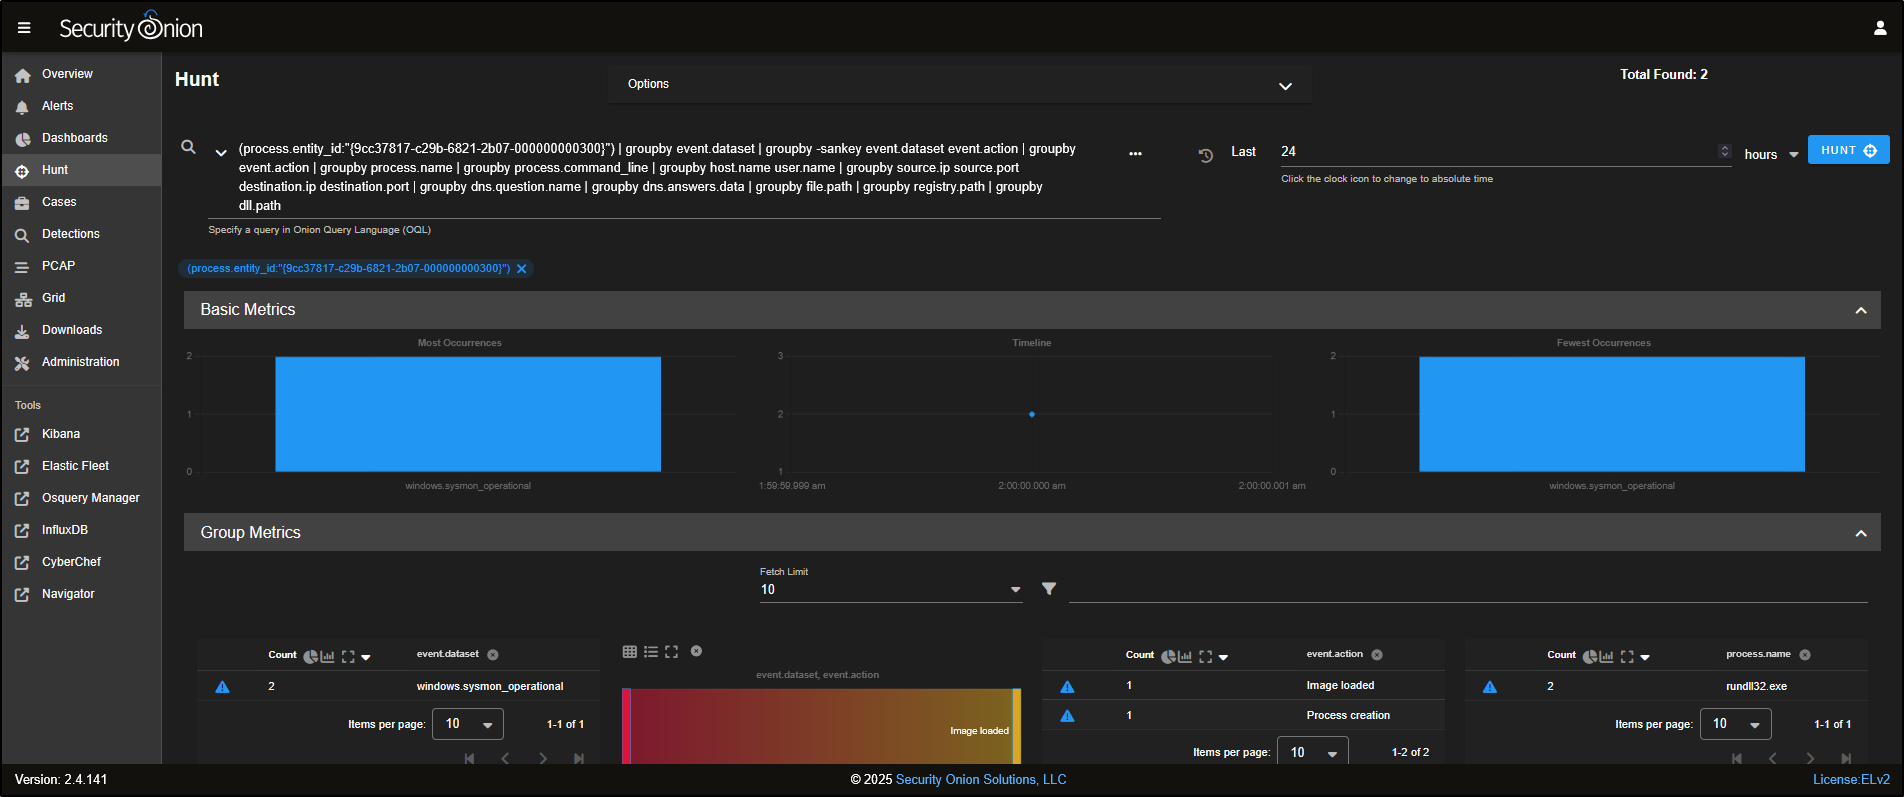
Scrolling down, you will see a list of individual Sysmon events that have been captured.
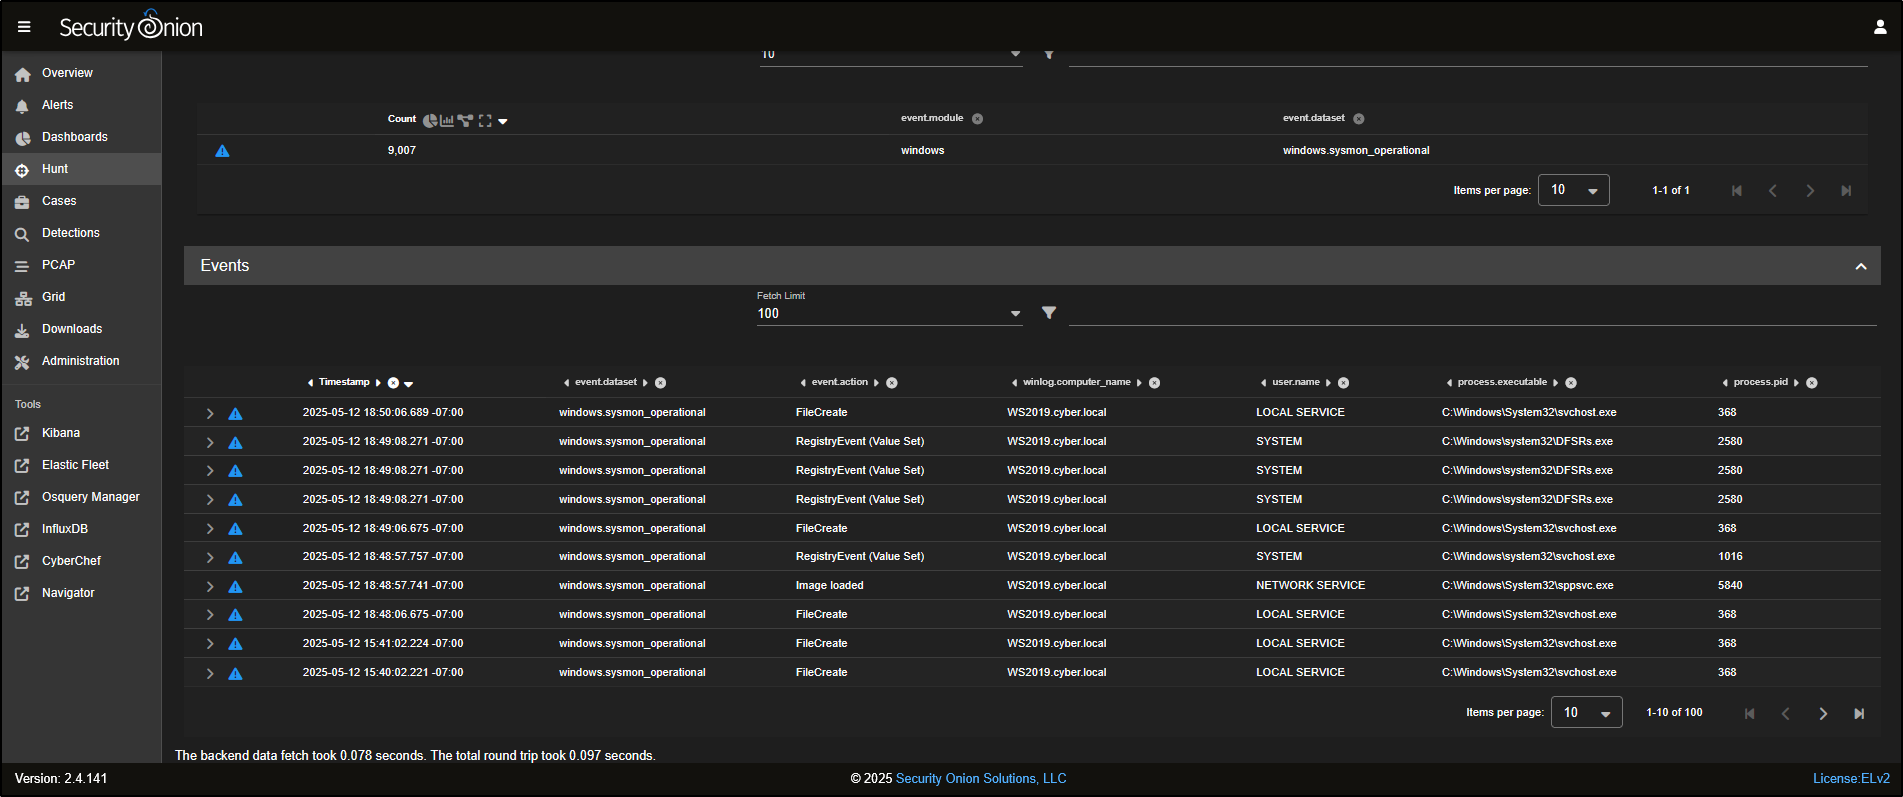
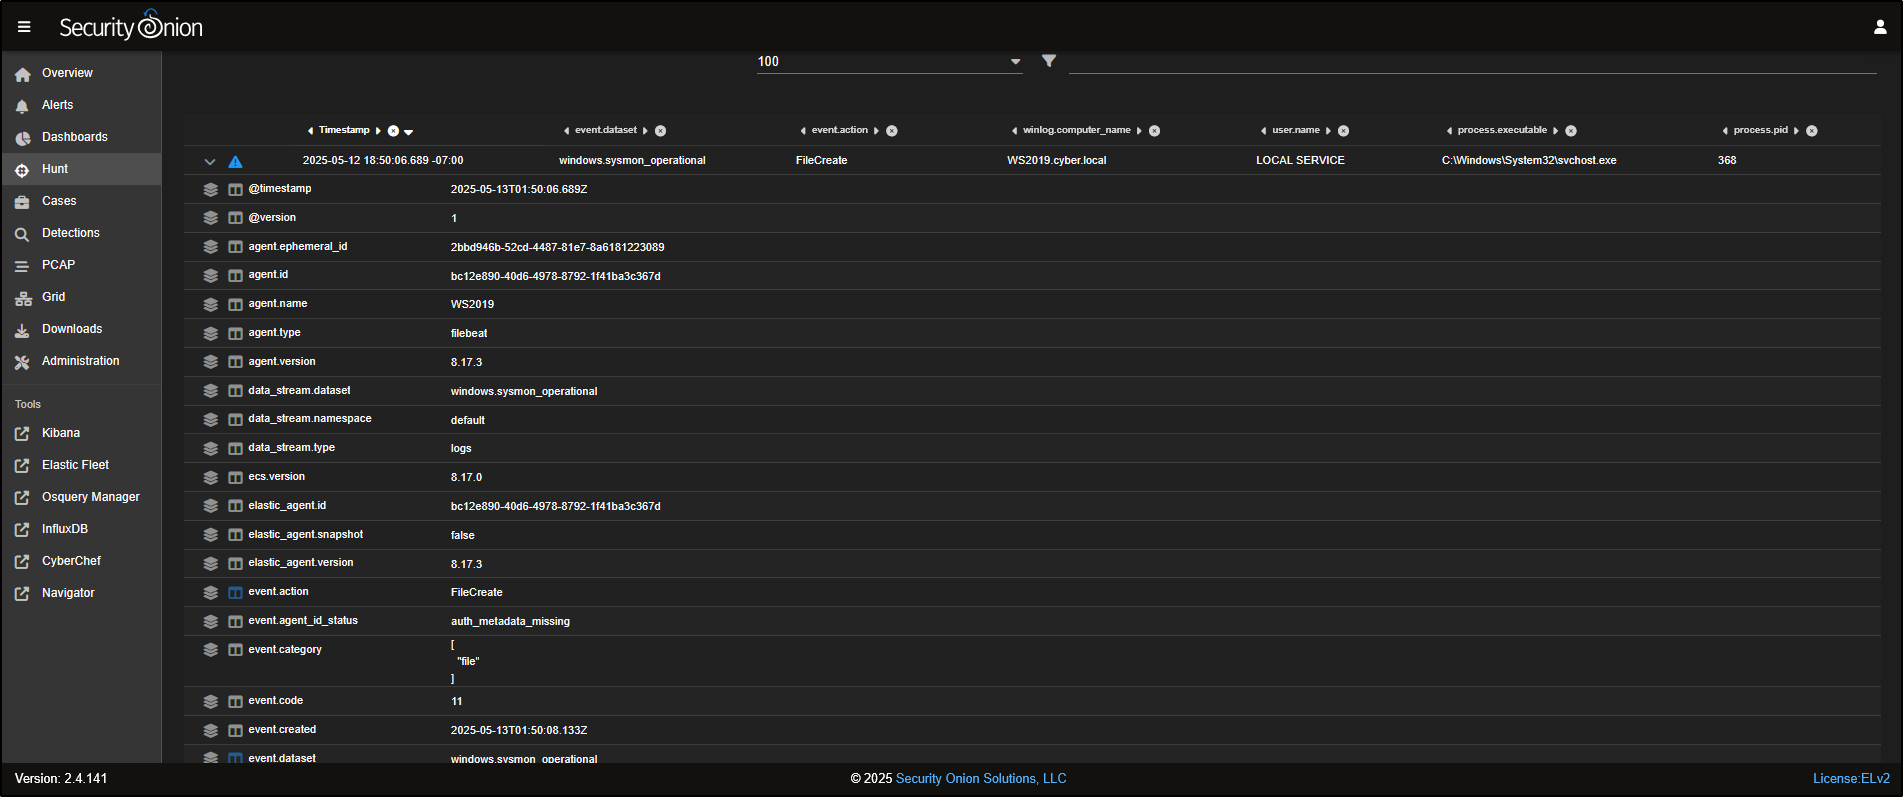
You can click to expand any event to view detailed information about what was captured in that specific log entry.
To refine the results even further and focus on FileCreate events, click on FileCreate and select Include to filter for those specific logs.
Dashboards
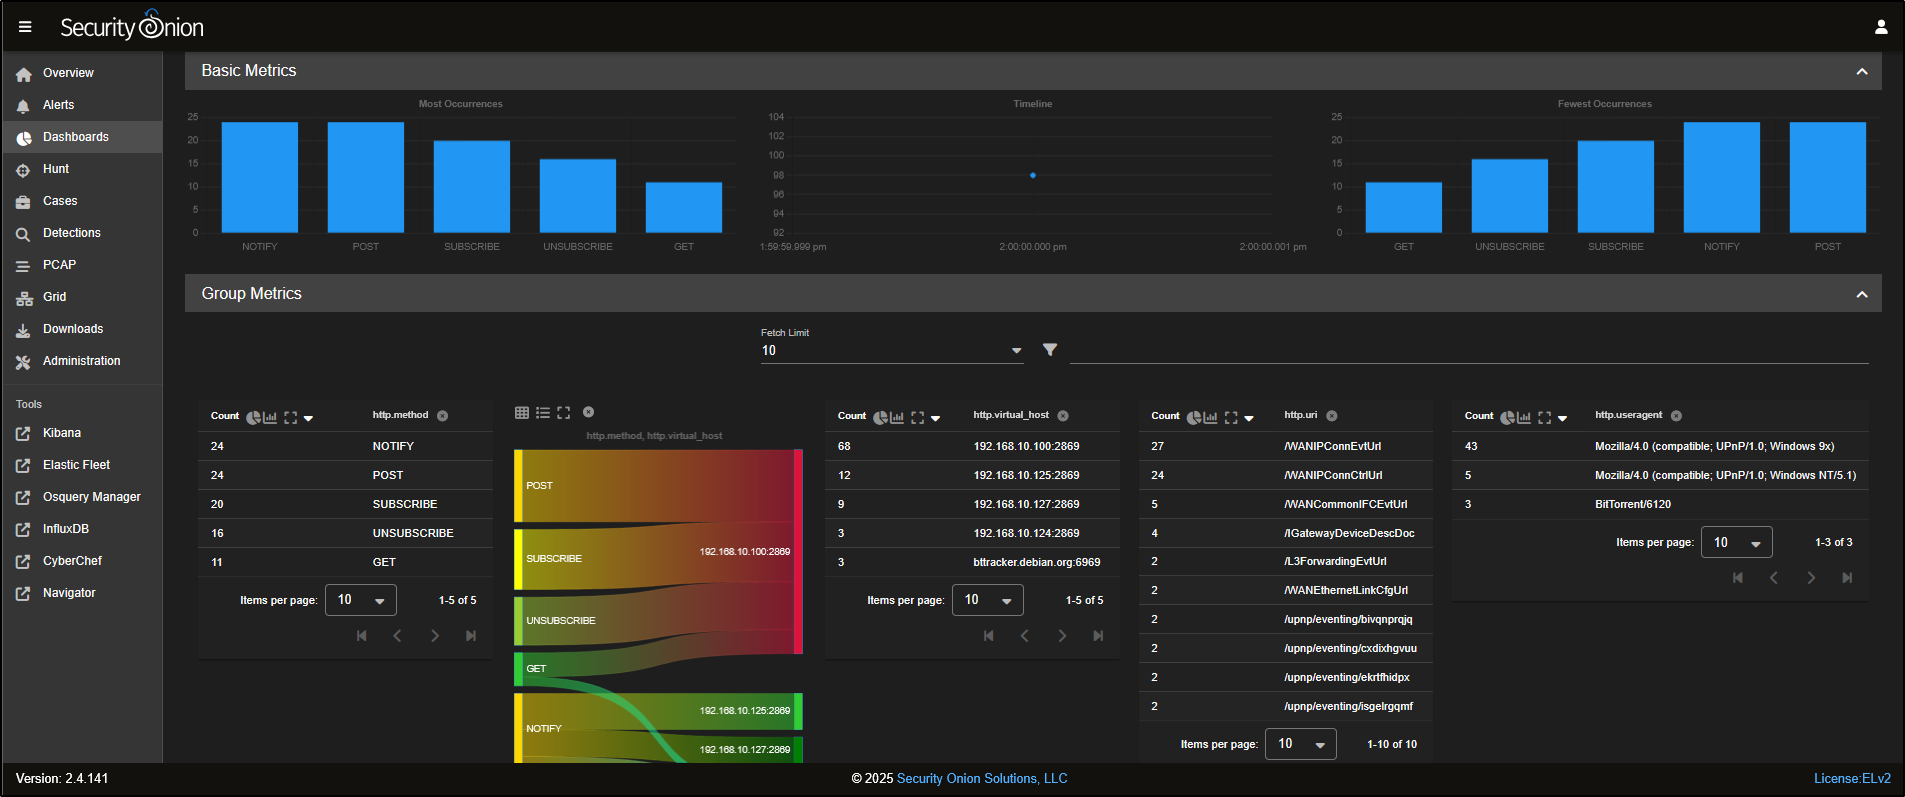
Go to the Dashboards tab in the SOC interface. Dashboards include a range of prebuilt visualisations, organised by different data sets to help you quickly interpret and analyse incoming logs.
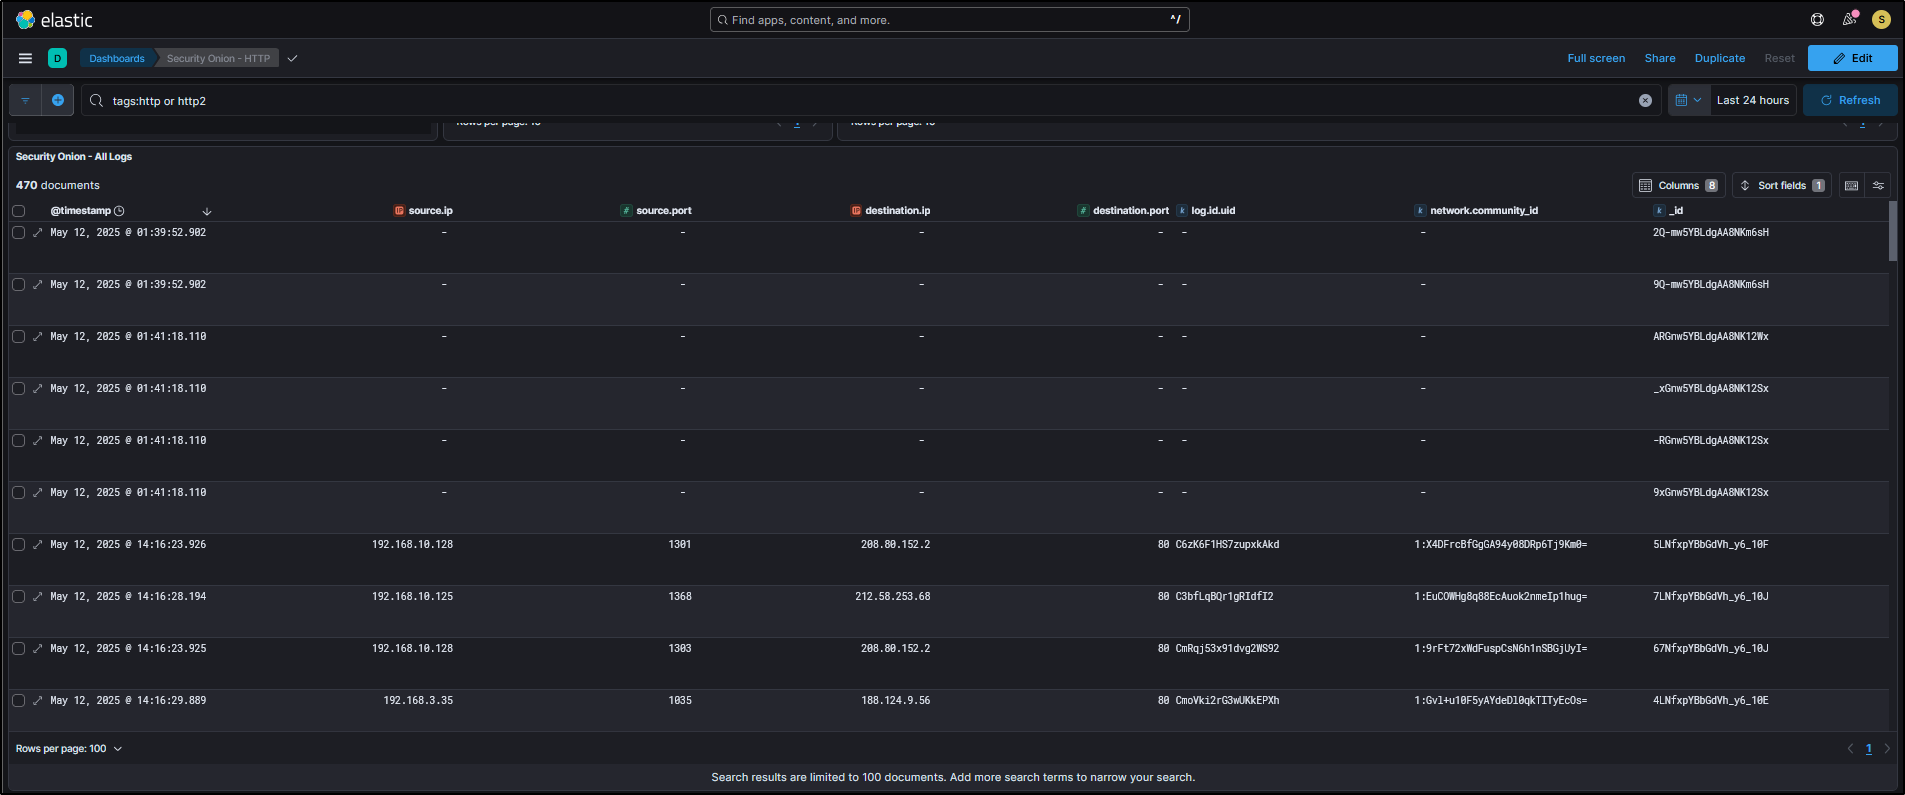
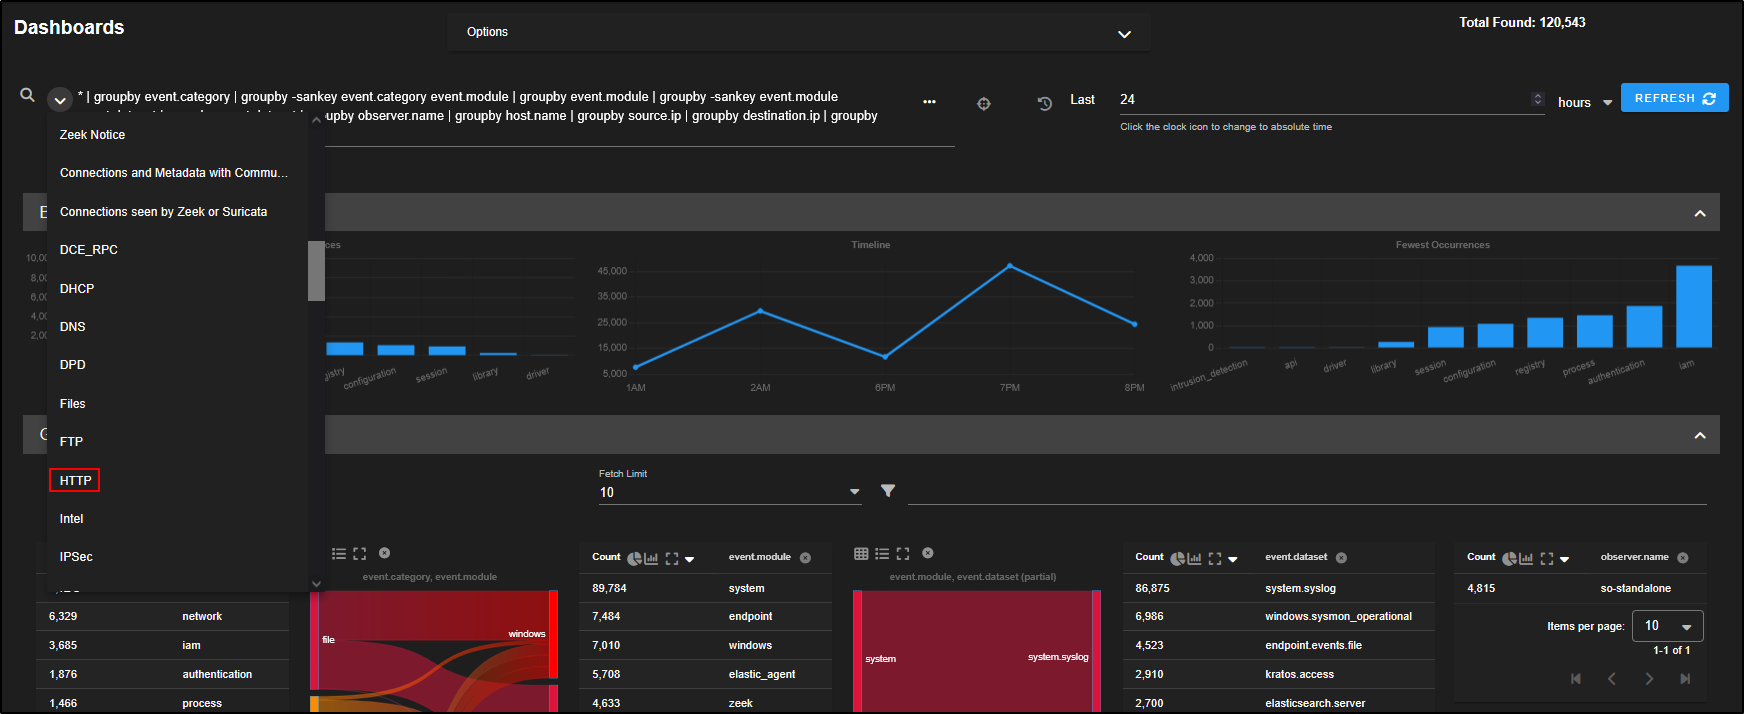
For example, if you want to analyse HTTP traffic, you can select HTTP from the drop-down menu to load the relevant dashboard.
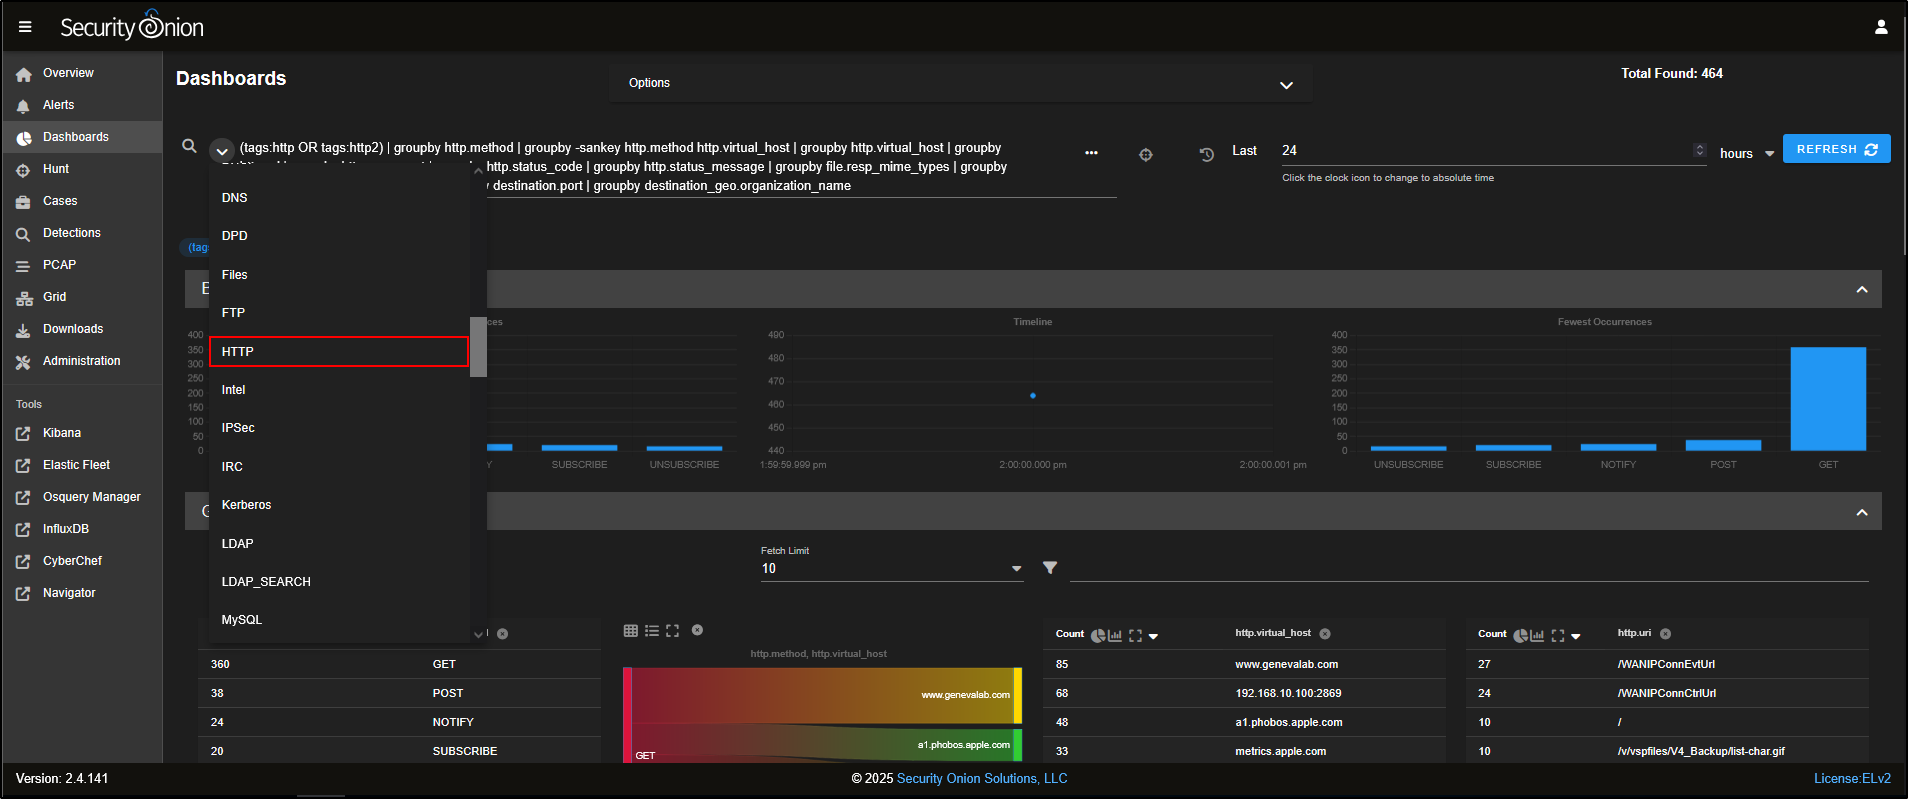
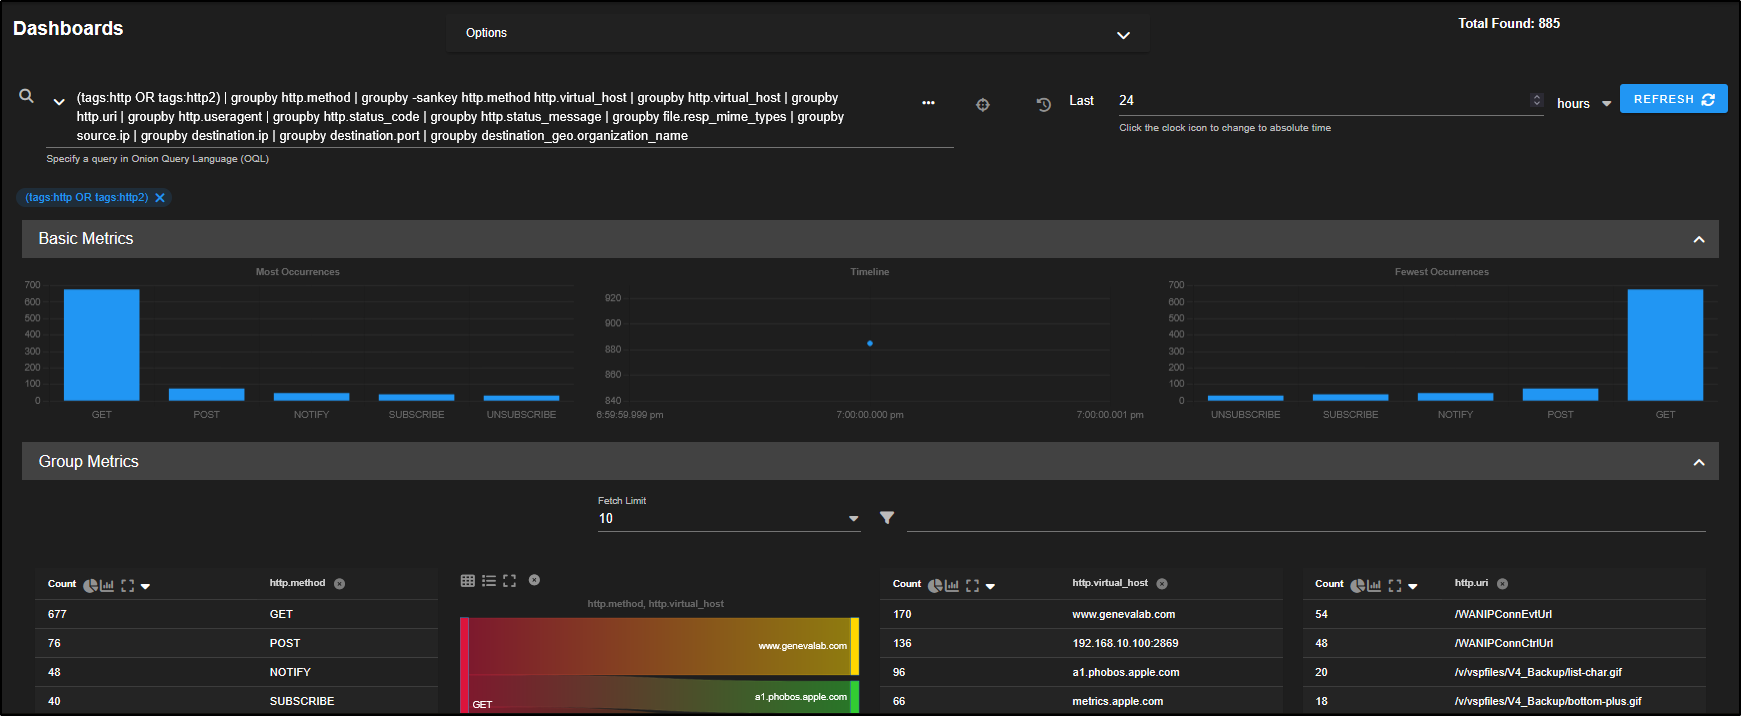
This will load a prebuilt HTTP dashboard that provides visual insights and metrics related to HTTP traffic observed in your environment.
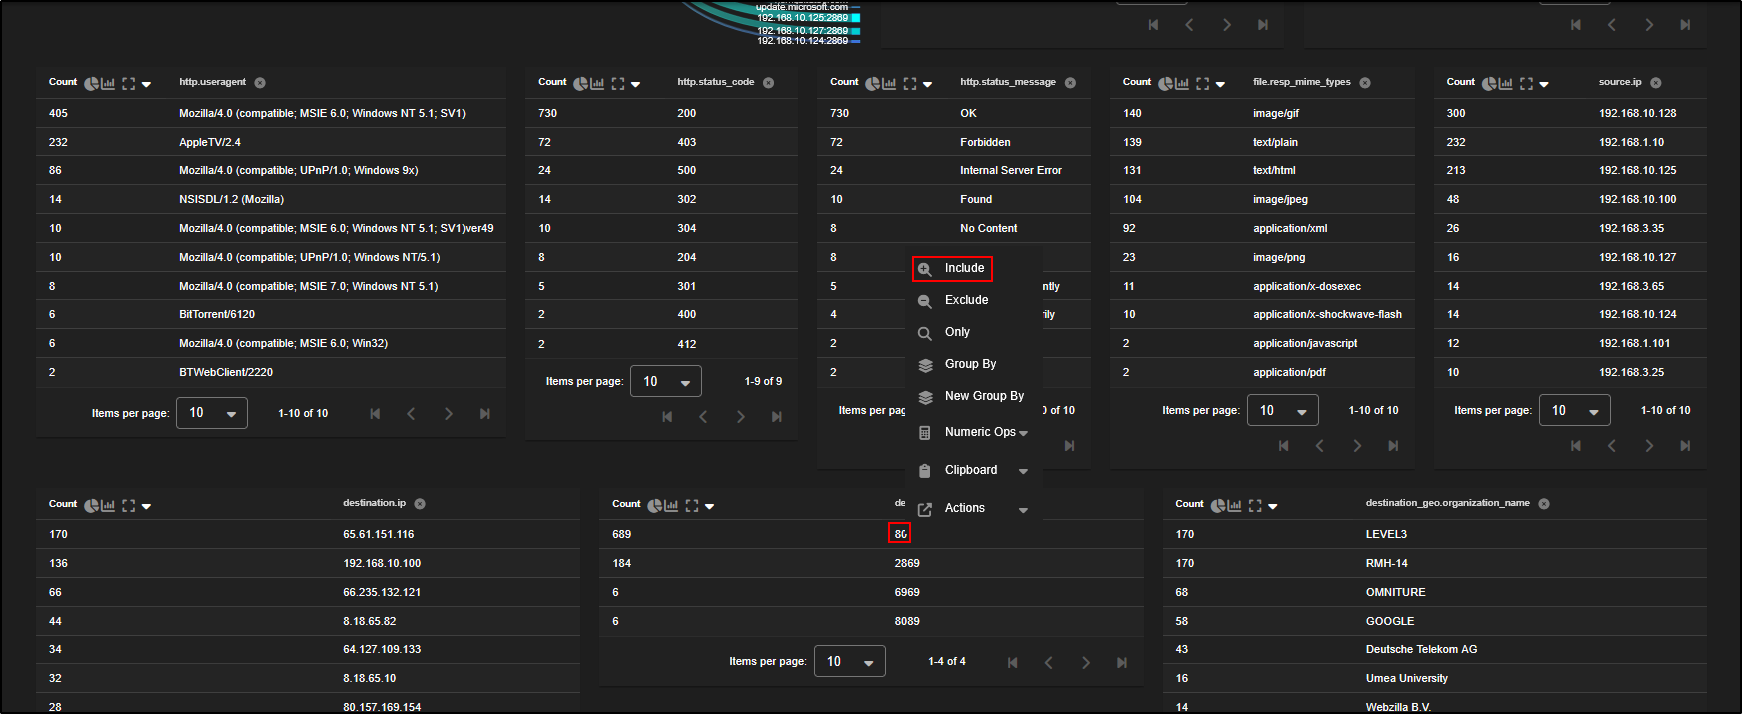
You can refine your view by filtering based on destination port. For instance, if you want to focus on non-standard HTTP traffic, you can Exclude destination port 80 from the results.
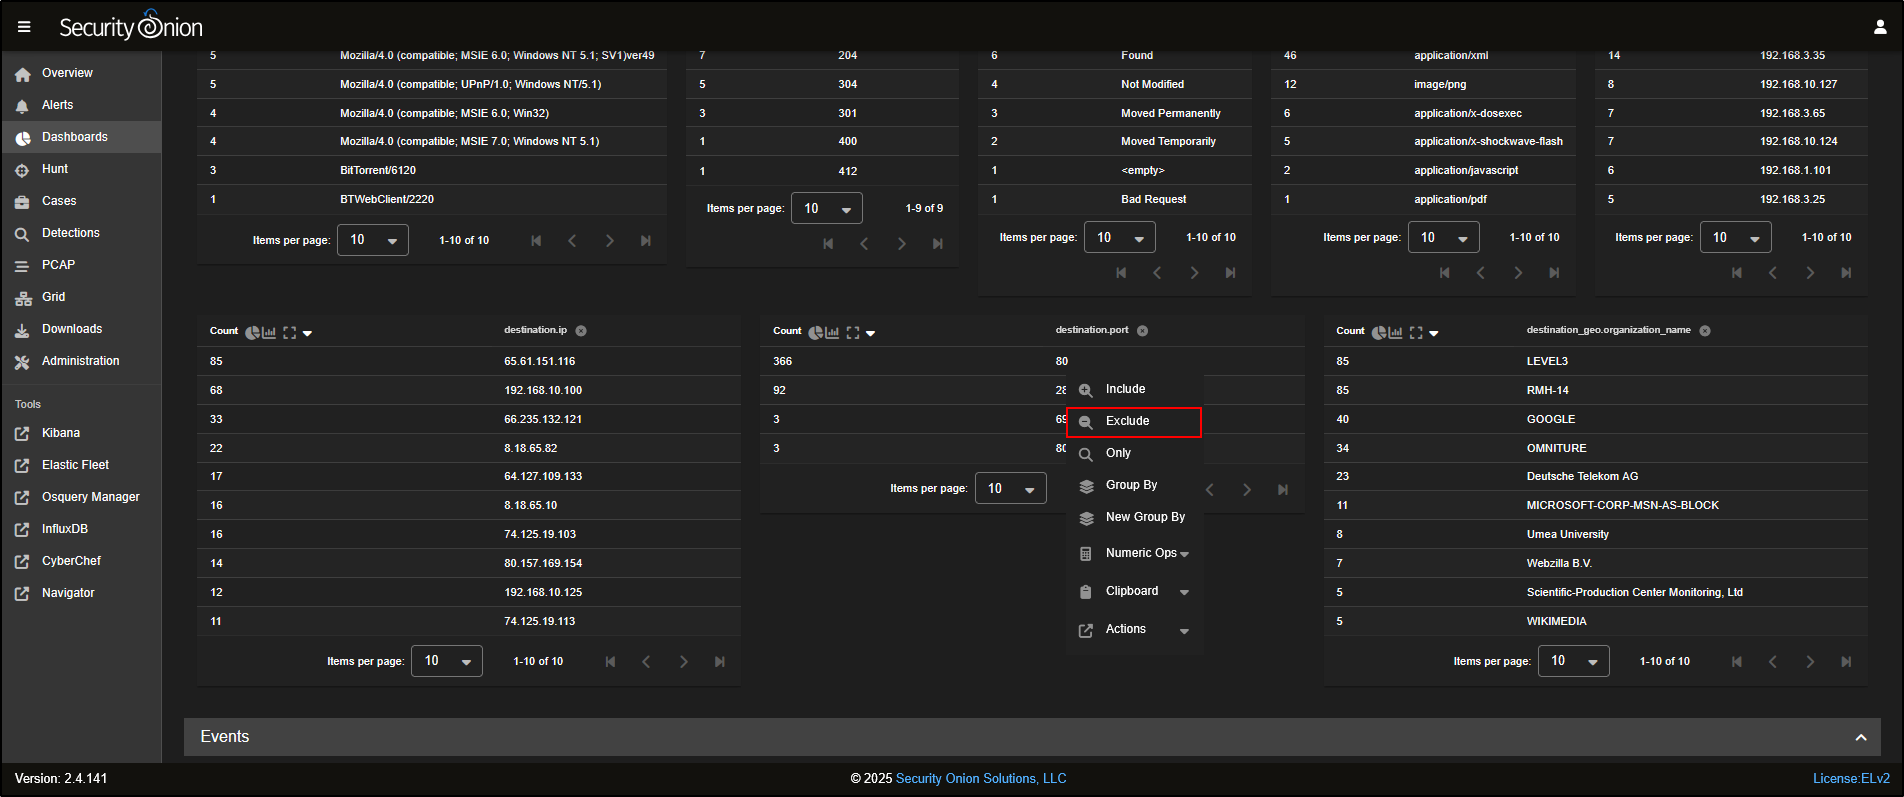
You will now see HTTP traffic that is using non-standard ports, which could indicate unusual or suspicious behaviour.
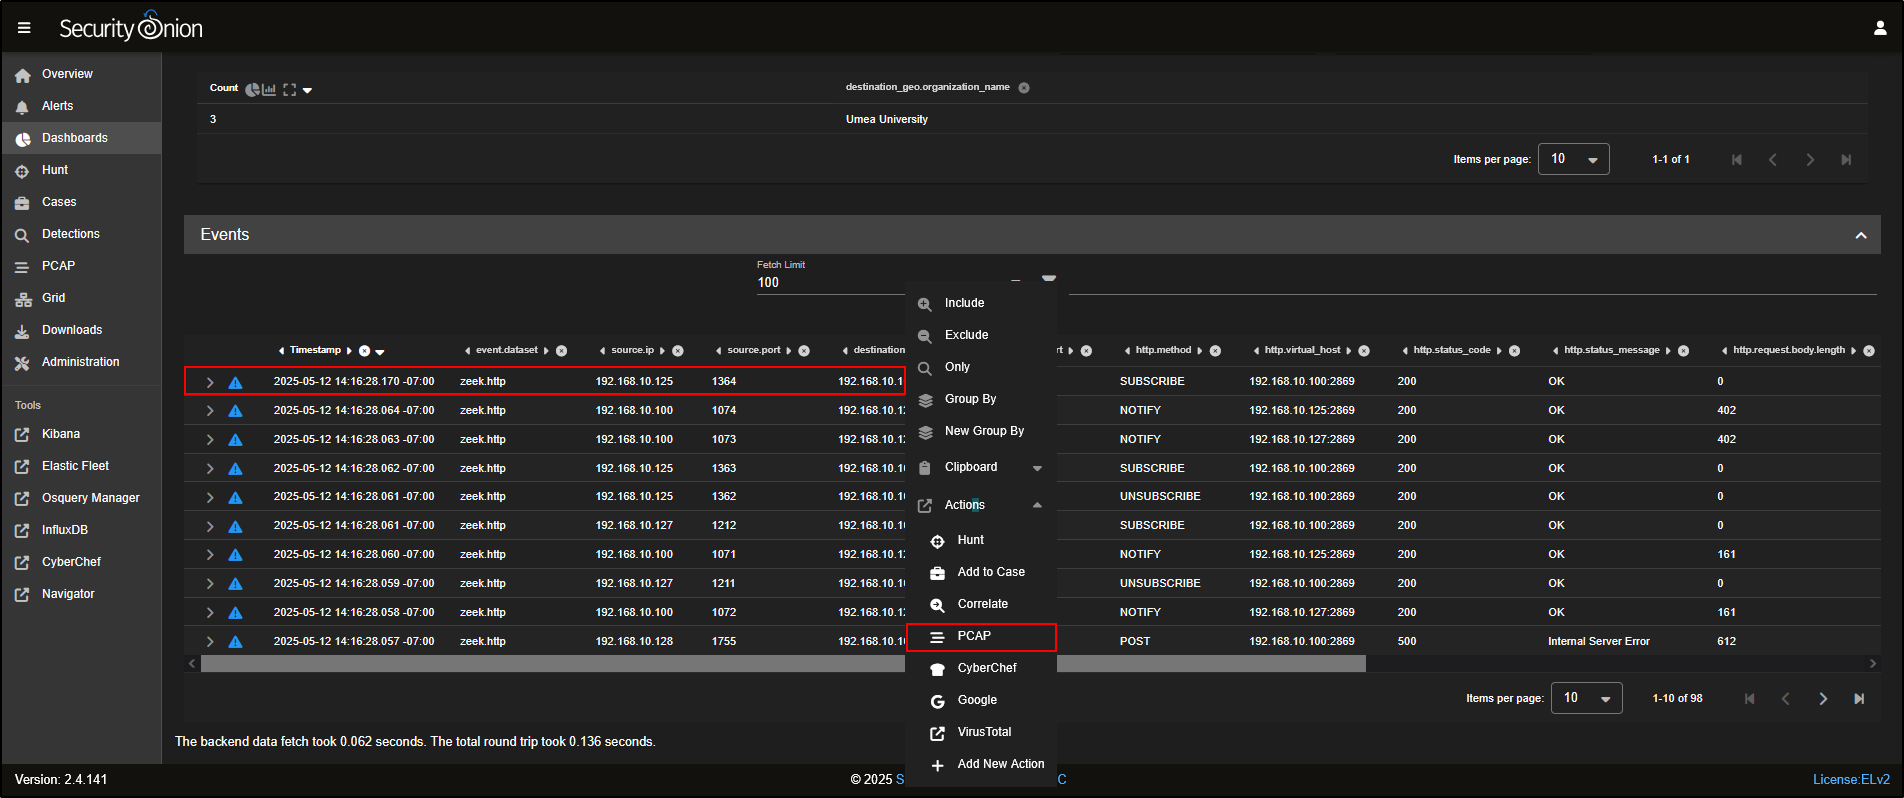
Security Onion also captures full network traffic using packet capture (PCAP). To view a packet capture:
- Scroll down to the event list
- Click on the first record
- Select Actions, then click on PCAP to open the capture for that specific network flow.
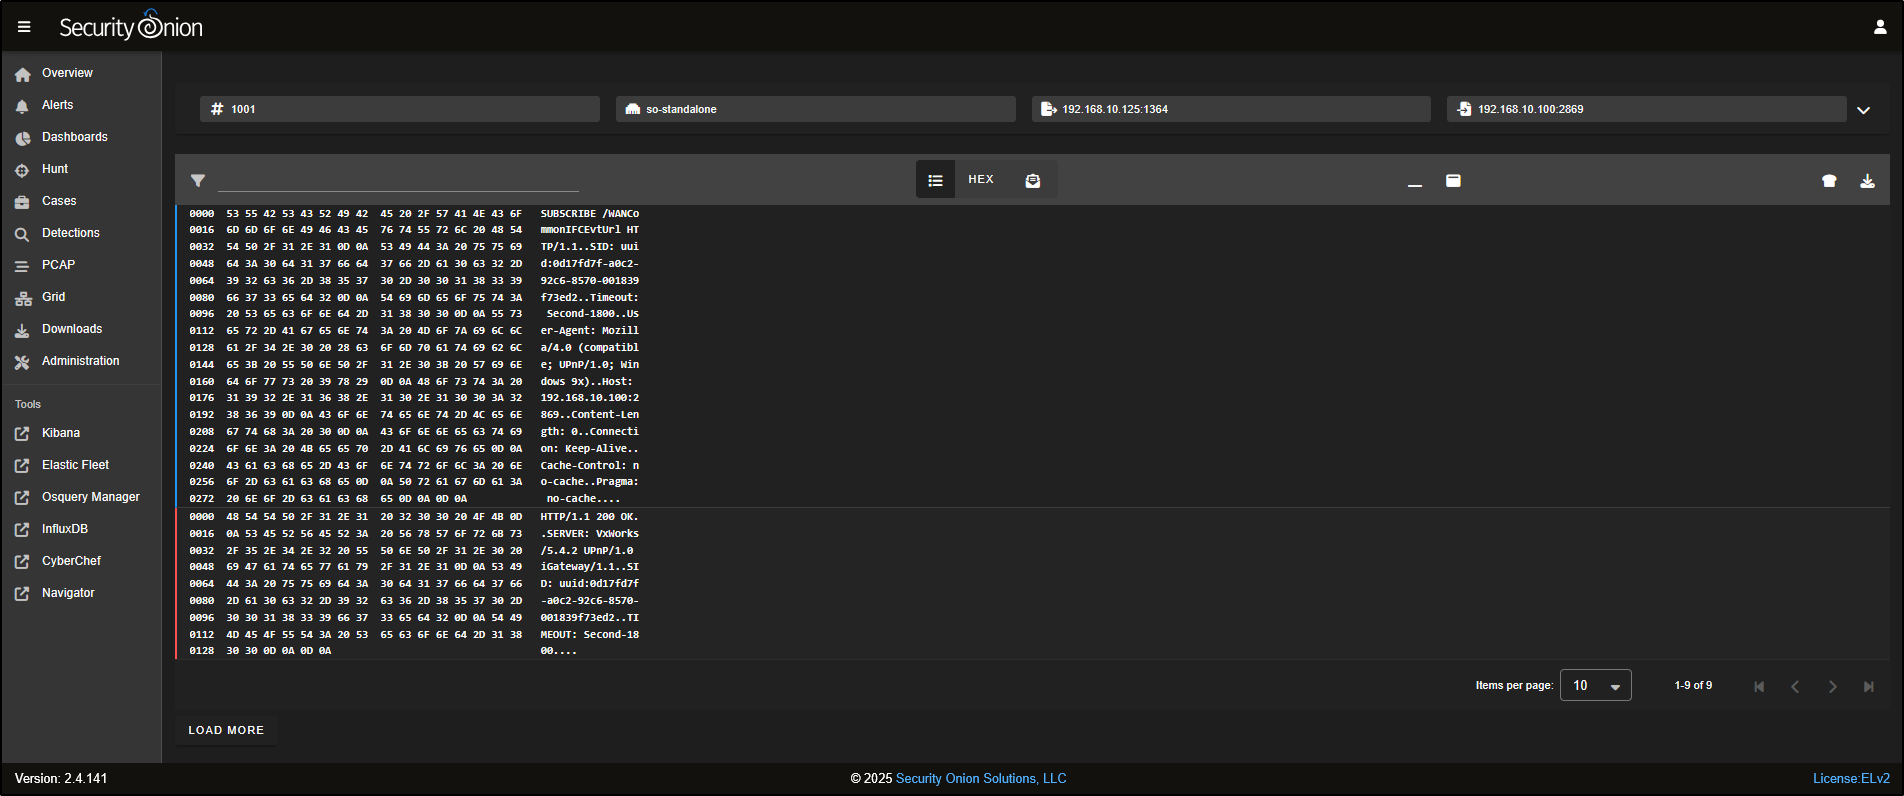
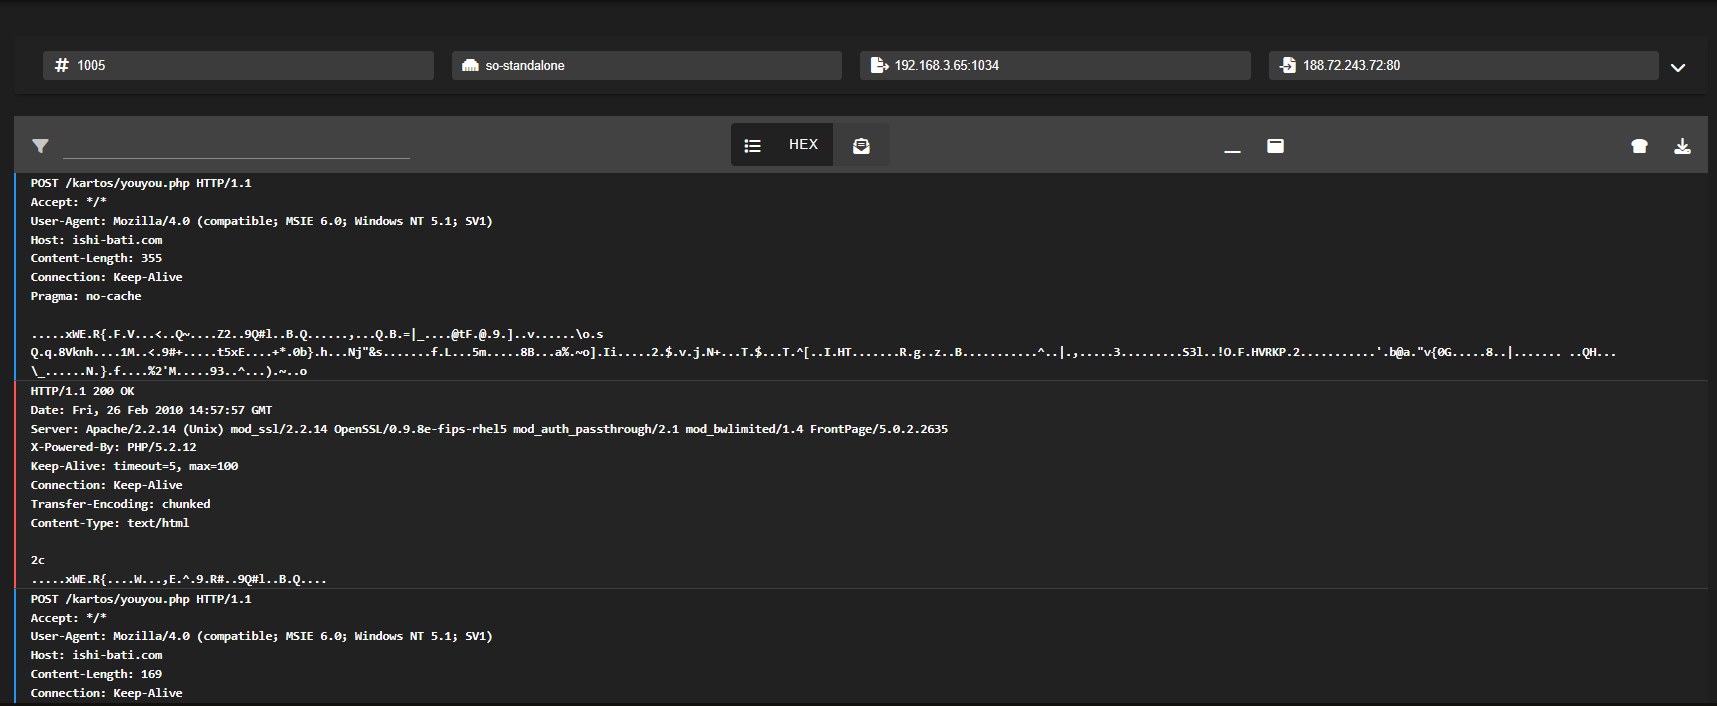
This opens a web-based PCAP viewer, similar to Wireshark, but accessible through your browser. Here, you can inspect details like the source and destination IPs, port numbers, and TCP flags involved in the connection.
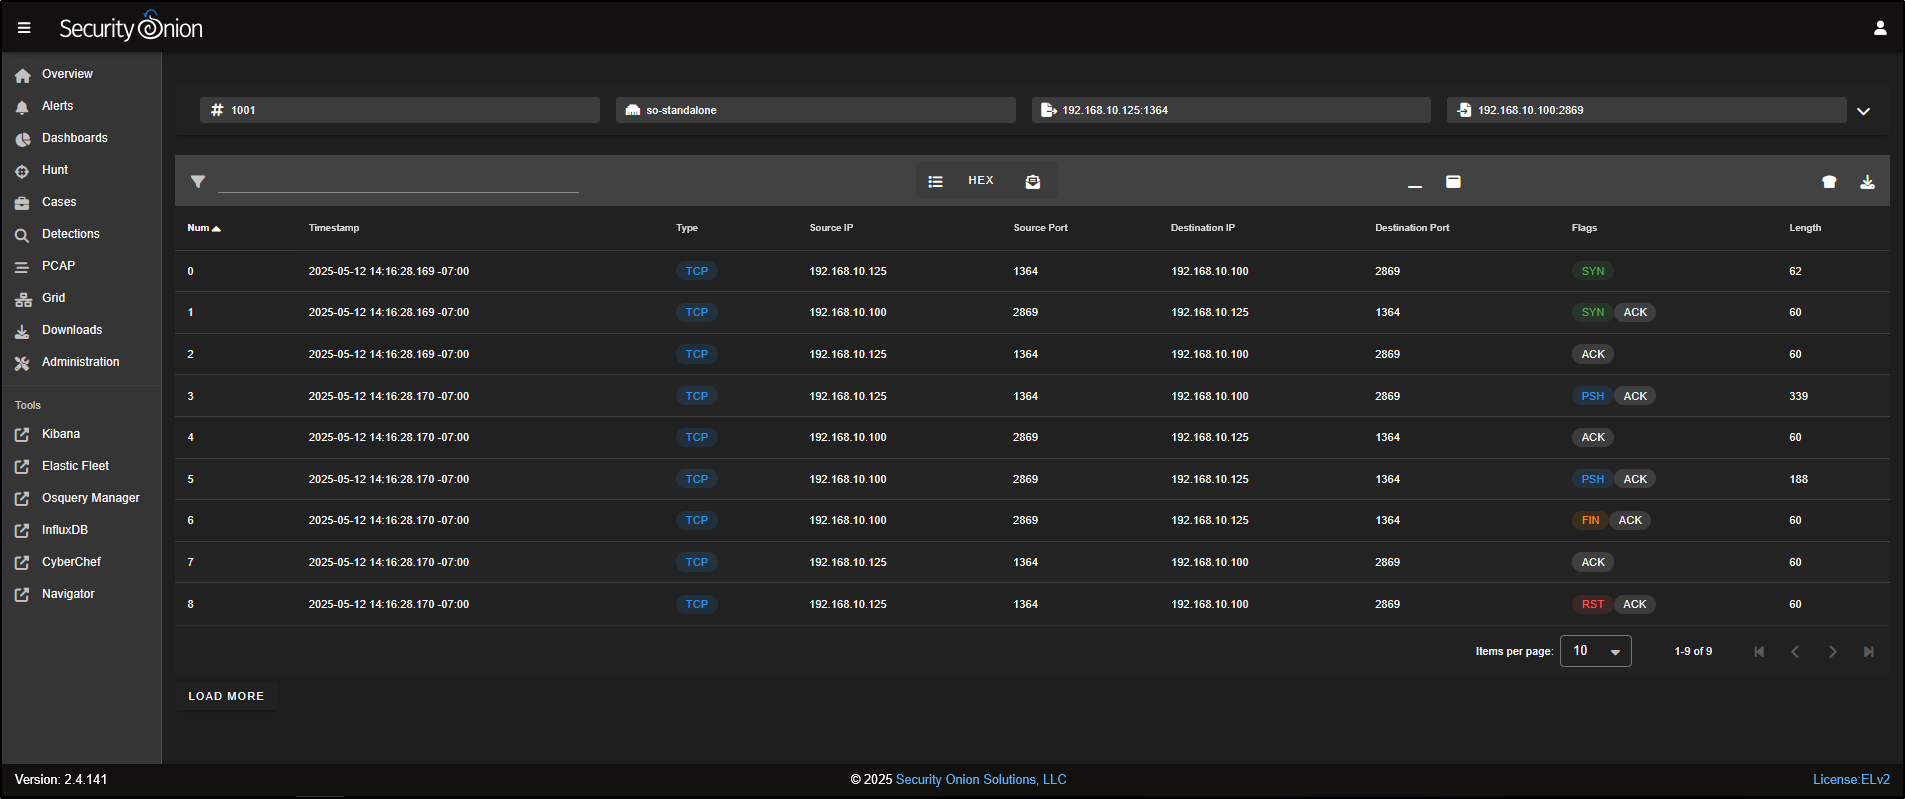
To view the raw packet data, click on the list icon at the top of the PCAP interface.
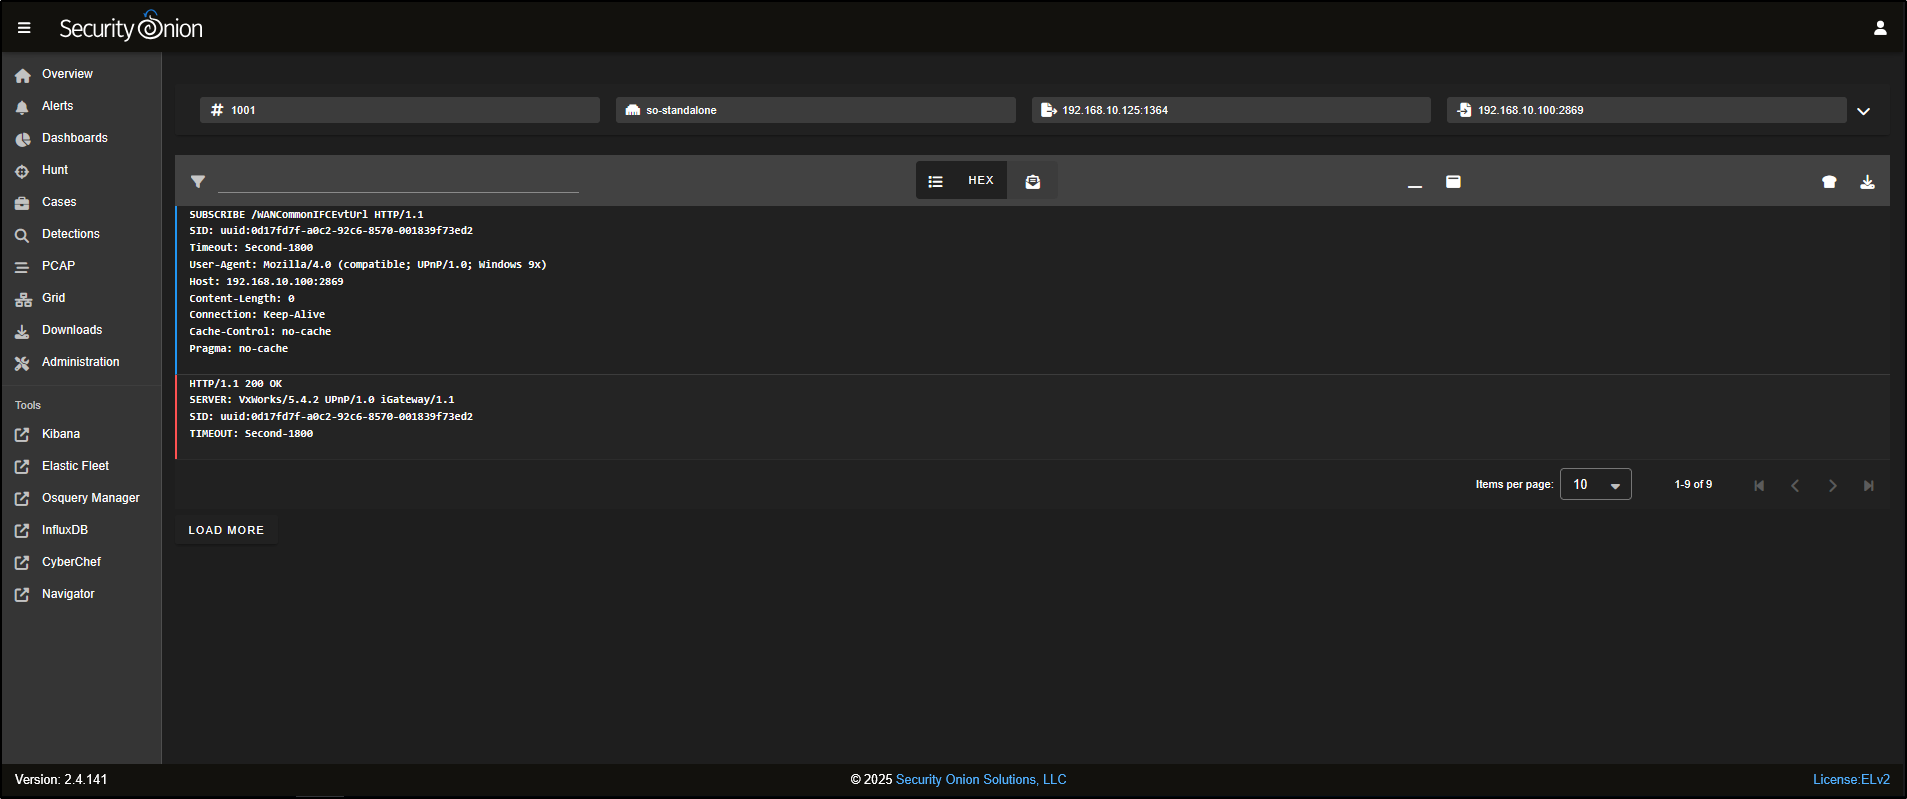
To hide the hex dump and switch to a plain-text view of the TCP session, click on the HEX icon at the top of the interface.
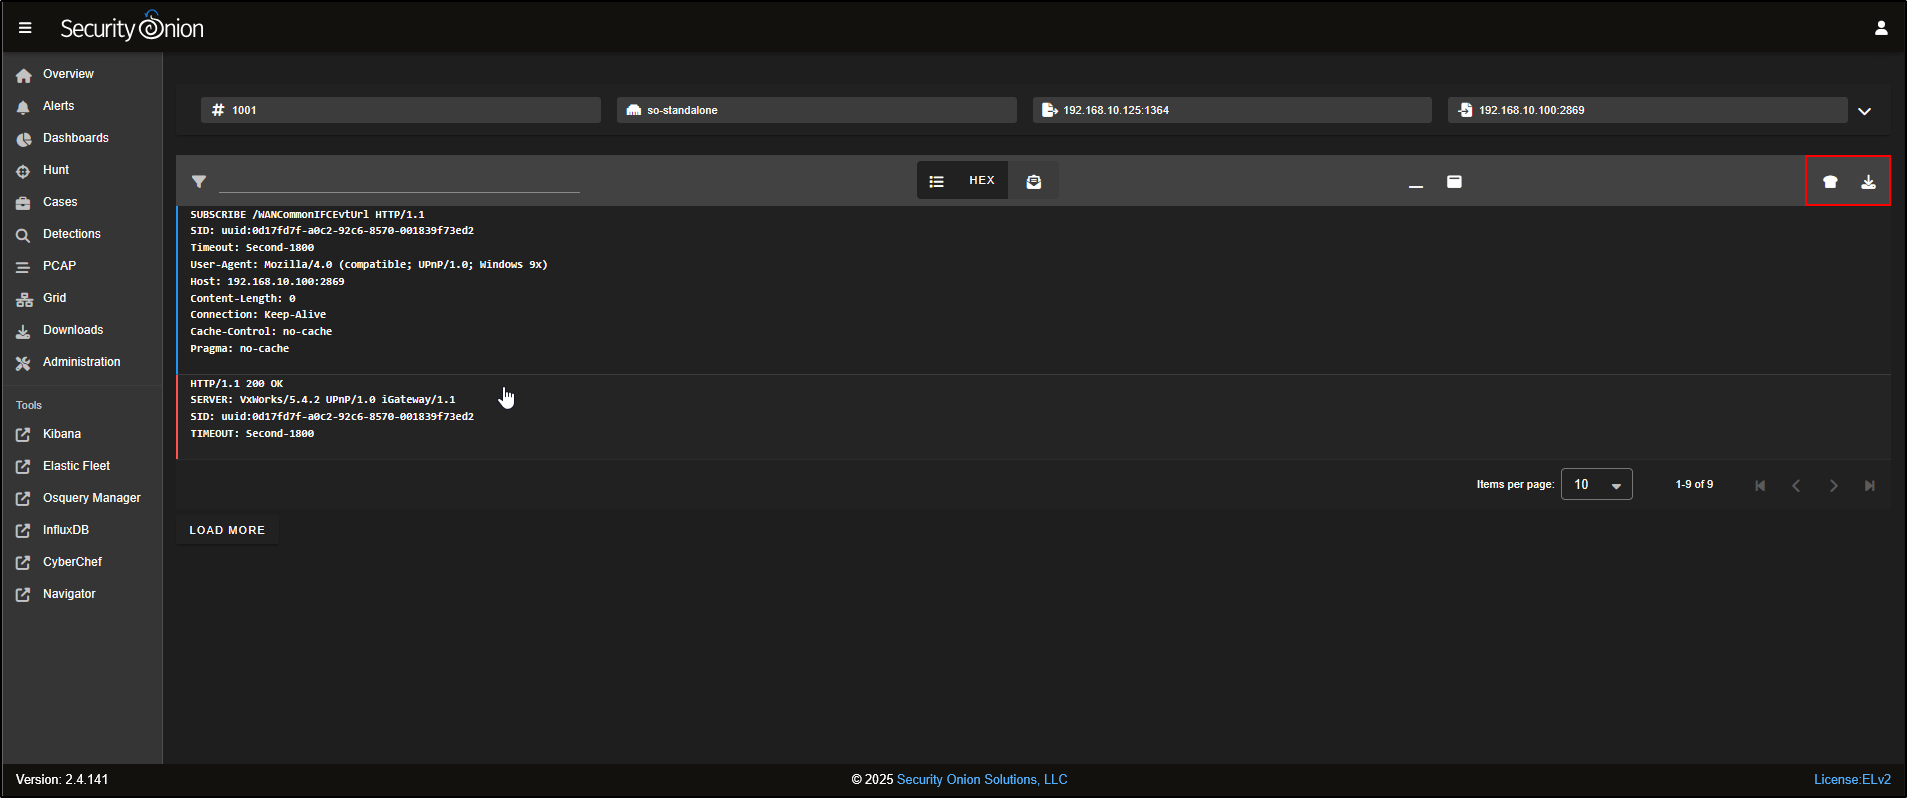
If you need to dig deeper, you can either download the PCAP using the Download PCAP button at the top right, or send it directly to CyberChef by clicking the CyberChef icon.
PCAP
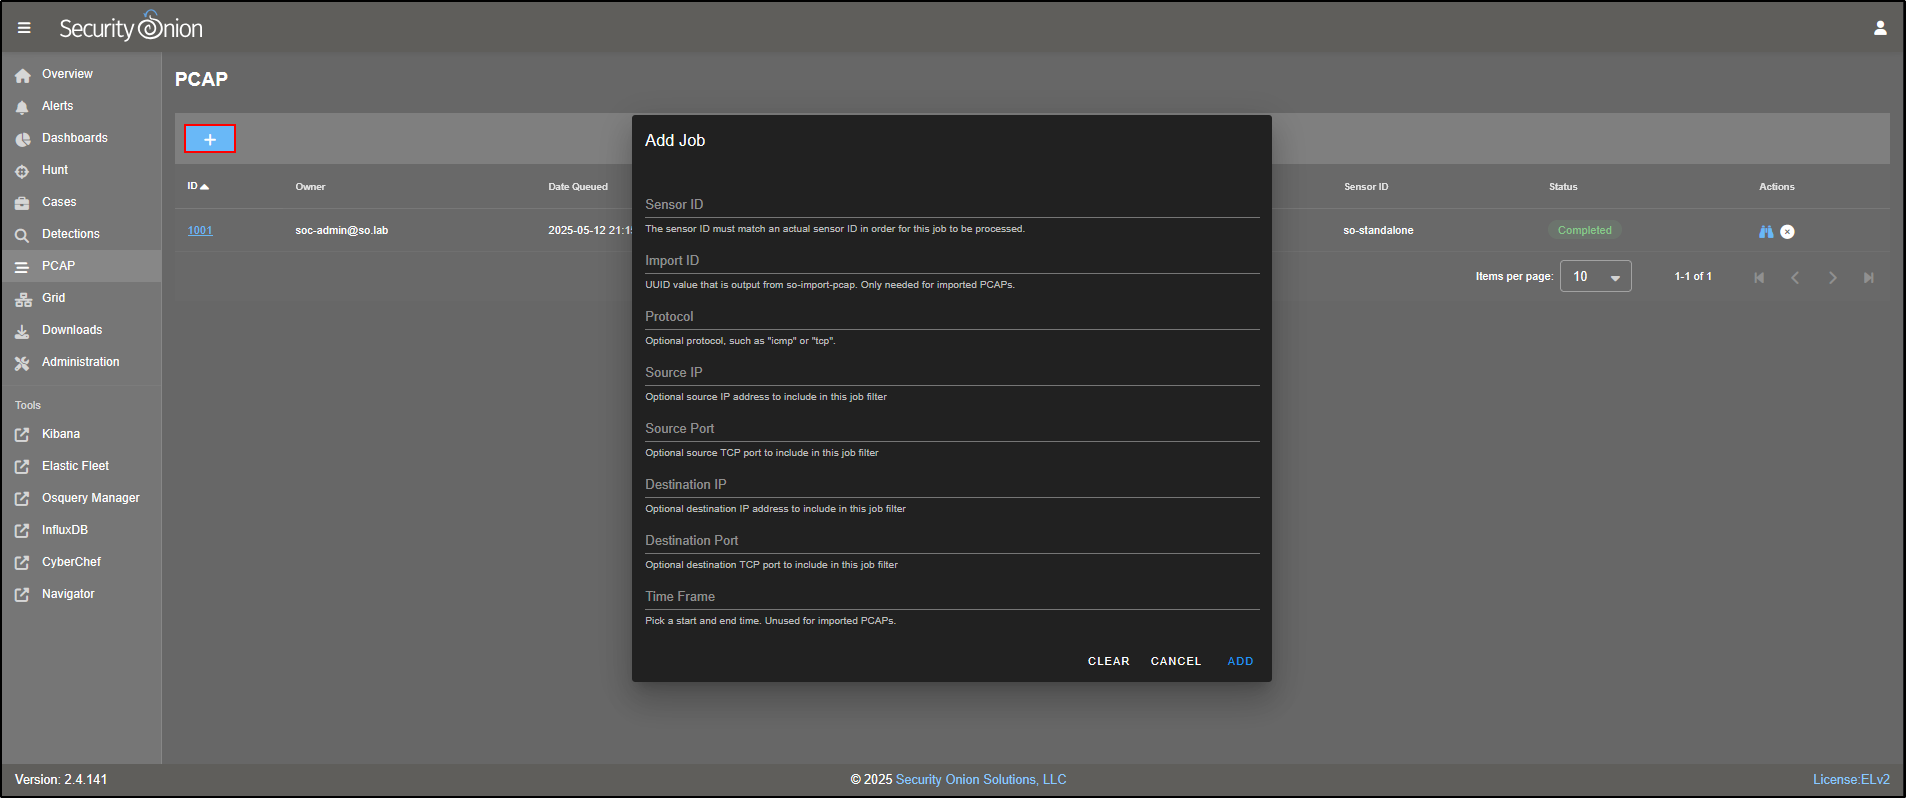
As well as pivoting into a PCAP from a specific alert or event, you can also pull custom PCAPs from your sensors based on your own search criteria.
To do this:
- Go to the PCAP tab in the SOC interface.
- Click the + icon to create a new request.
- Enter the parameters you want to filter by (e.g. IP address, port, time range).
- Specify the sensor ID you want to collect from.
Security Onion will then retrieve the matching packets and display them in the PCAP web interface for review.
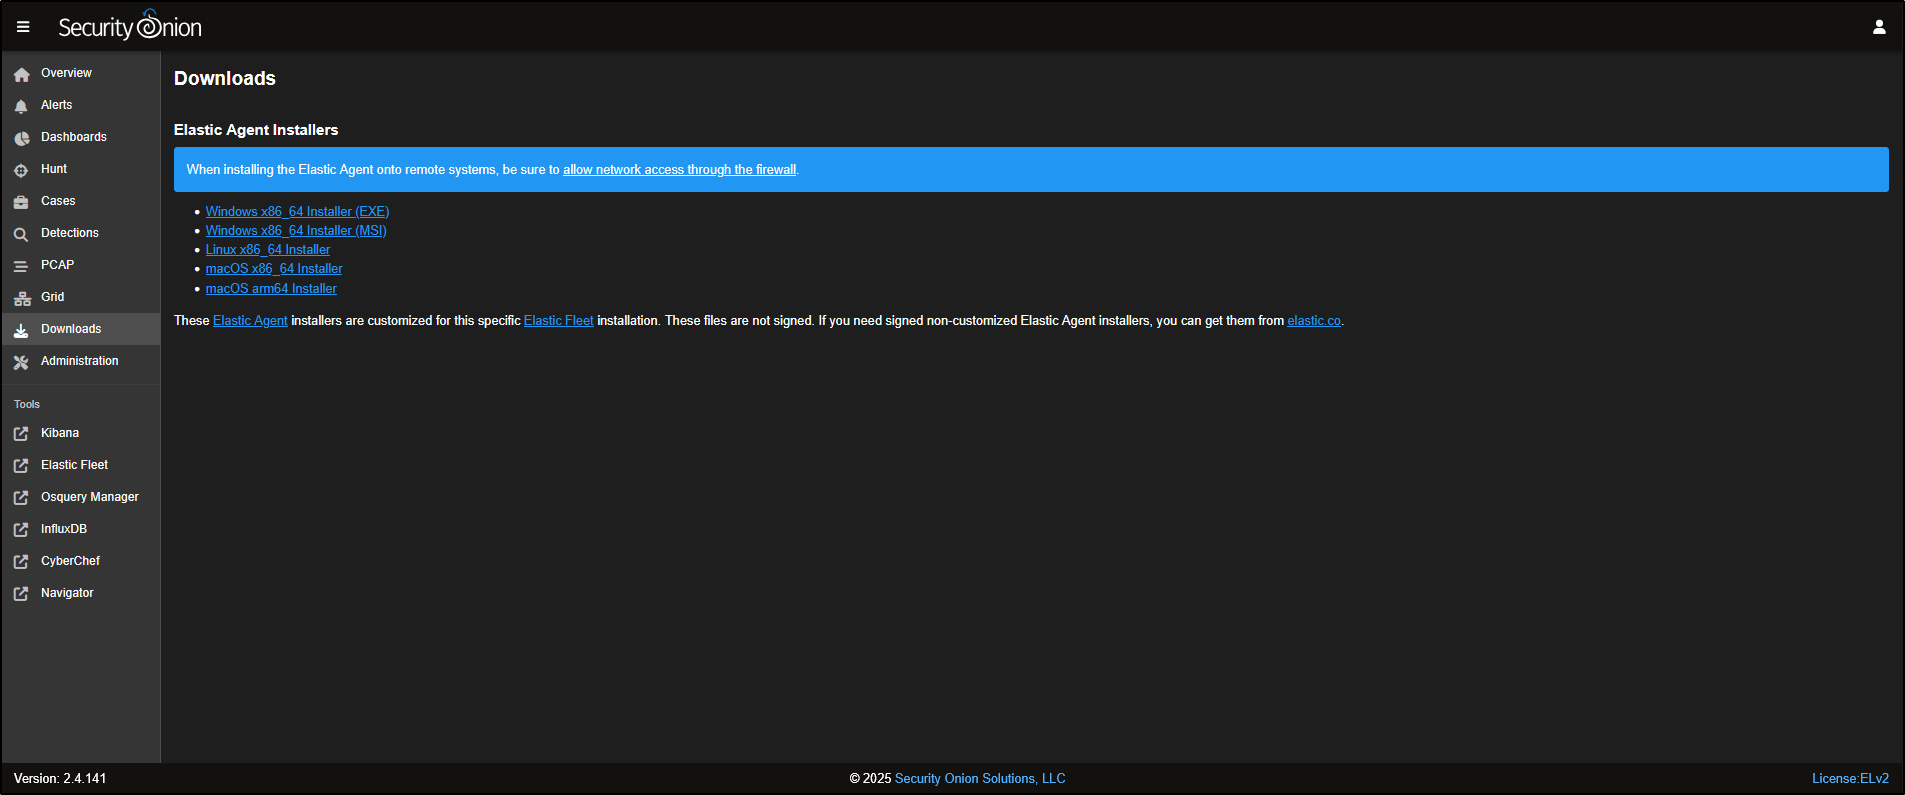
Downloads
Go to the Downloads tab in the SOC interface. Here, you can download the Elastic Agent that matches the operating system of your endpoint.
These agents are designed to collect telemetry data from the host and send it to Security Onion. They are prebuilt and automatically configured for your environment as part of the installation process.
Administration
Head to the Administration tab in the SOC interface. This section lets you manage and configure your Security Onion Grid.
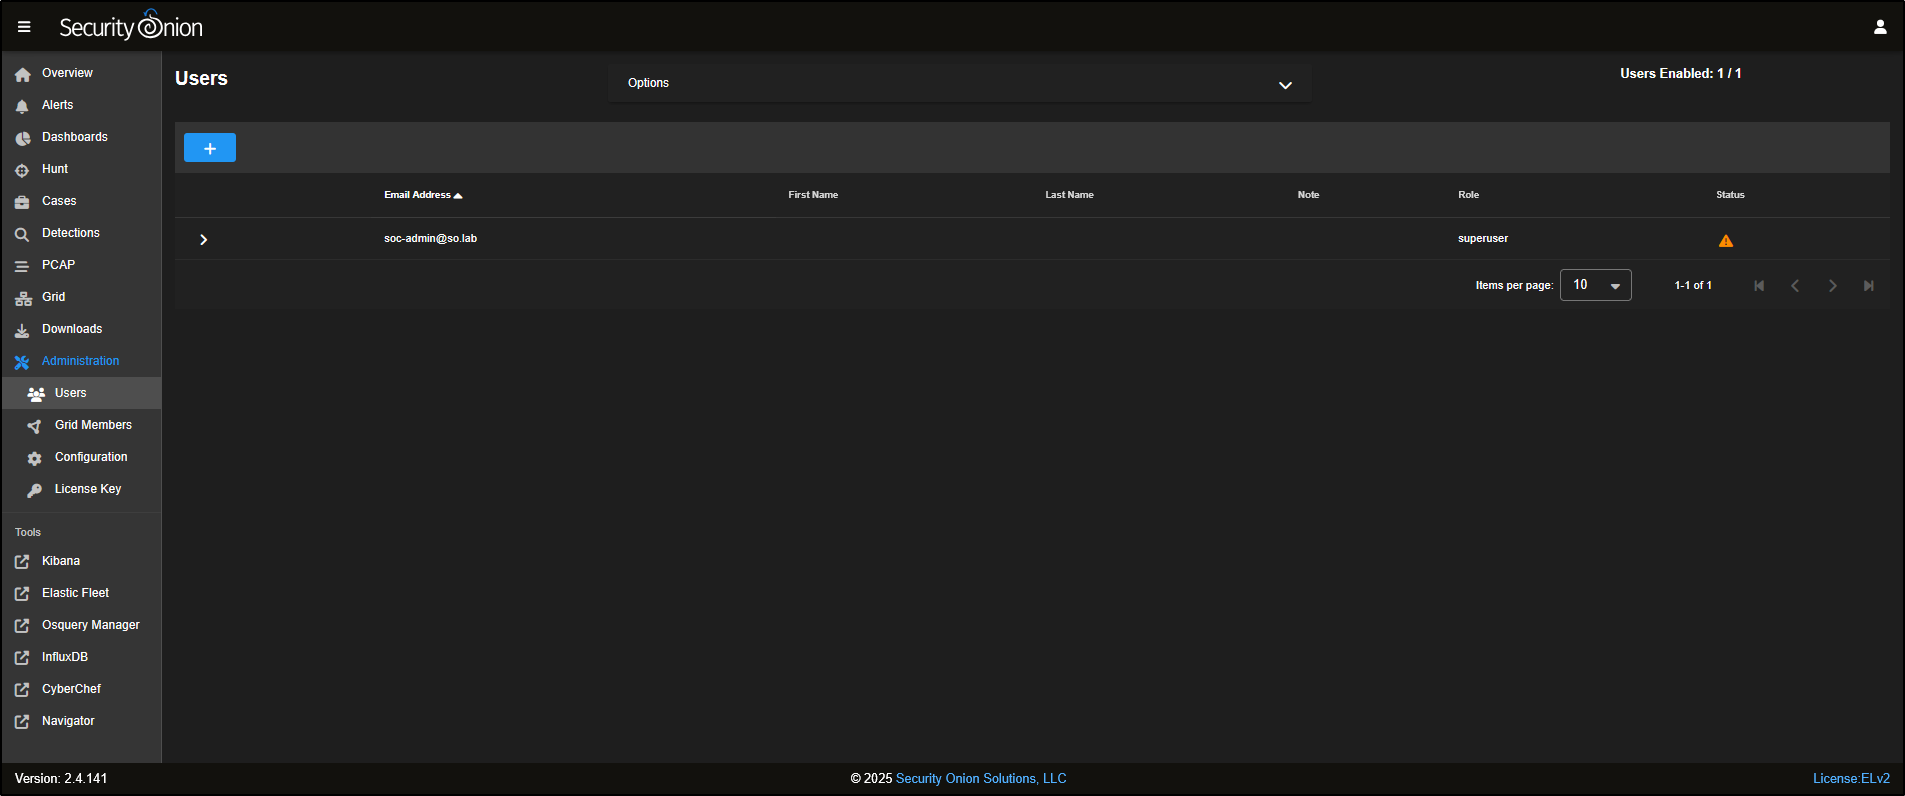
Under Users, you can create, disable, or edit user accounts for accessing the SOC web interface.
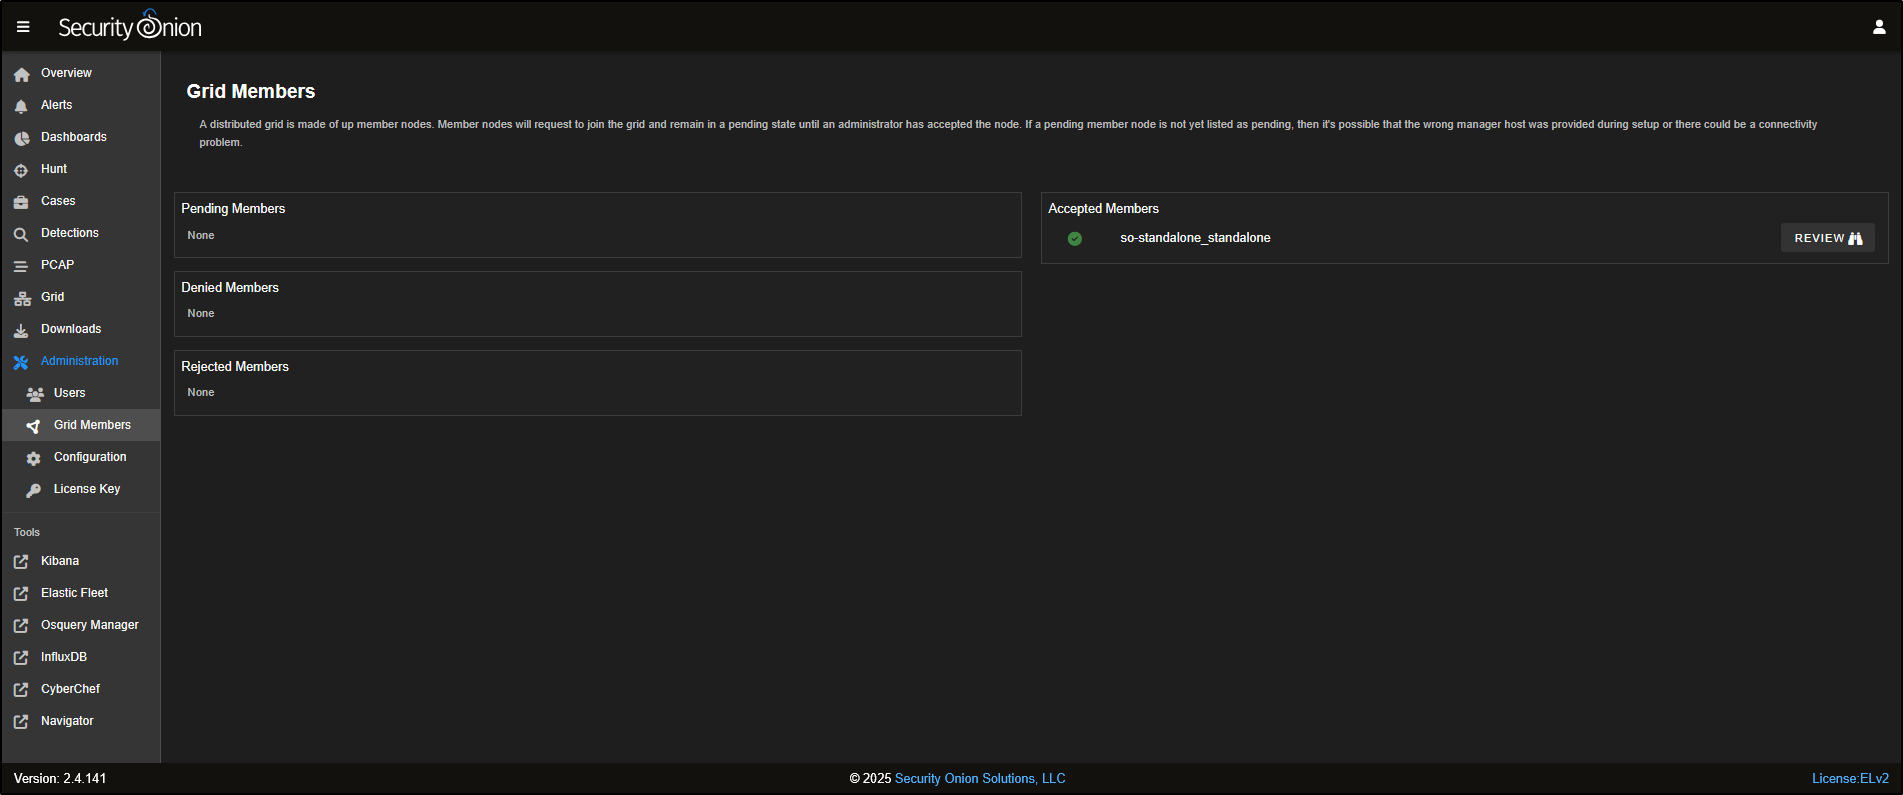
The Grid Members section is used to add or remove nodes from your Security Onion deployment, allowing you to scale or manage your environment as needed
The Configuration section provides access to various platform settings, including options for updating firewall rules and adjusting log retention periods to suit your environment.
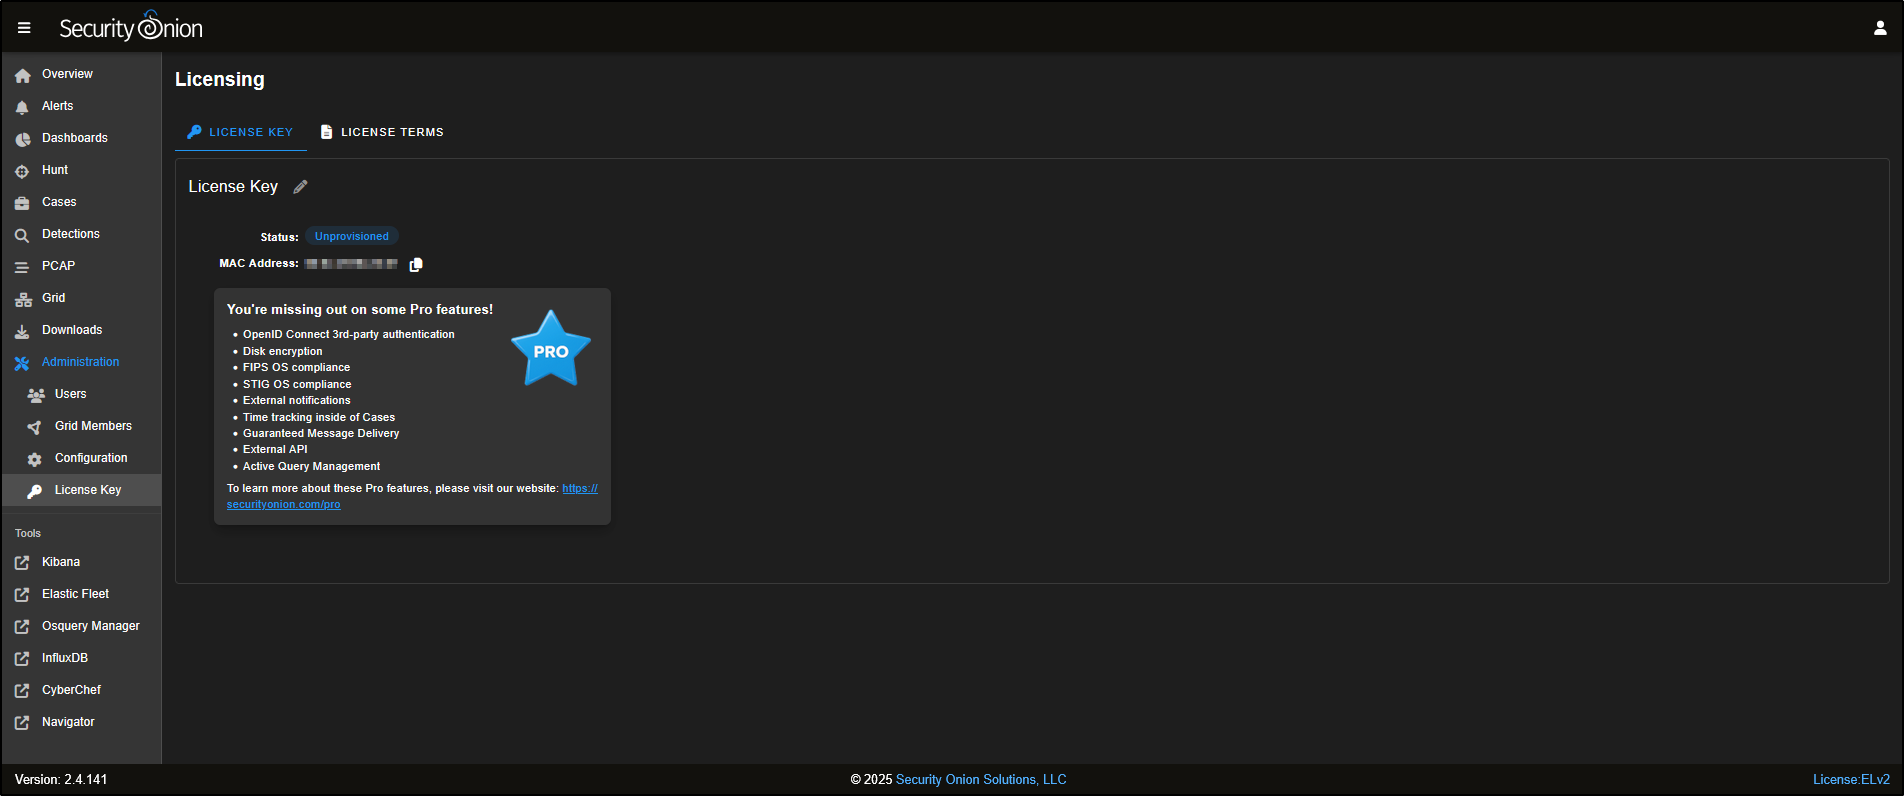
The License Key section is used to activate certain advanced enterprise features (also known as Pro features) that aren’t available in the free version.
Kibana
Kibana is Elastic’s web-based interface for exploring and visualising data stored in Elasticsearch. Security Onion includes a range of ready-to-use Kibana dashboards to help you analyse this data in more depth.
Clicking on Kibana from the SOC interface will open it in a new browser tab.
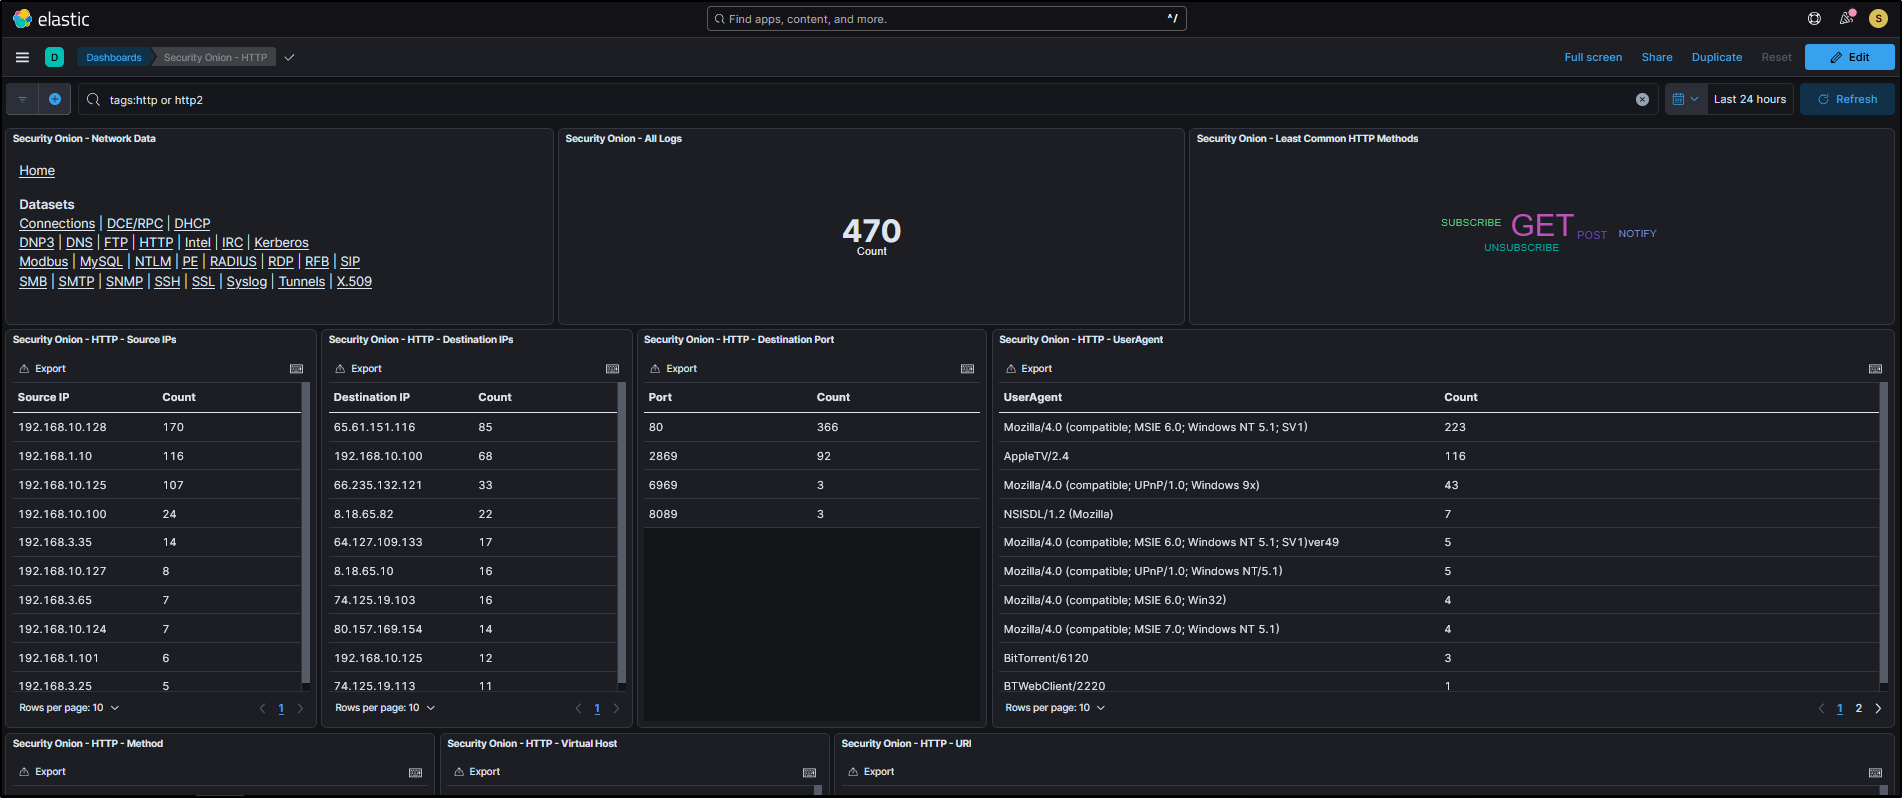
To focus on specific data, for example, HTTP logs, click Network under the Event Category, then choose HTTP under Datasets.
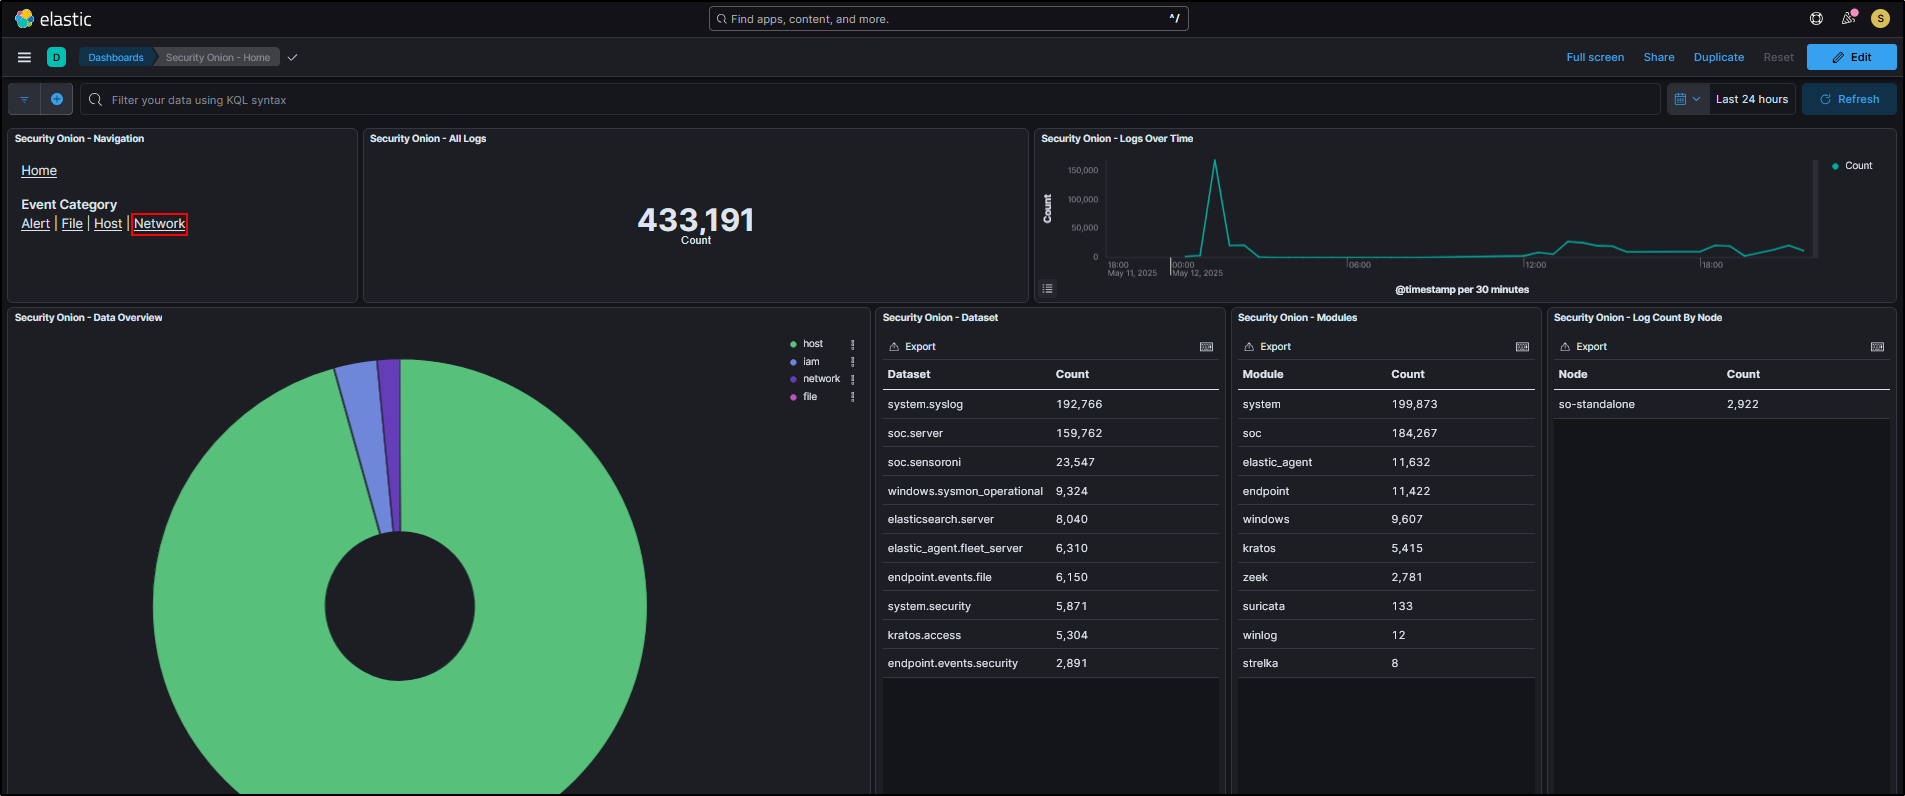
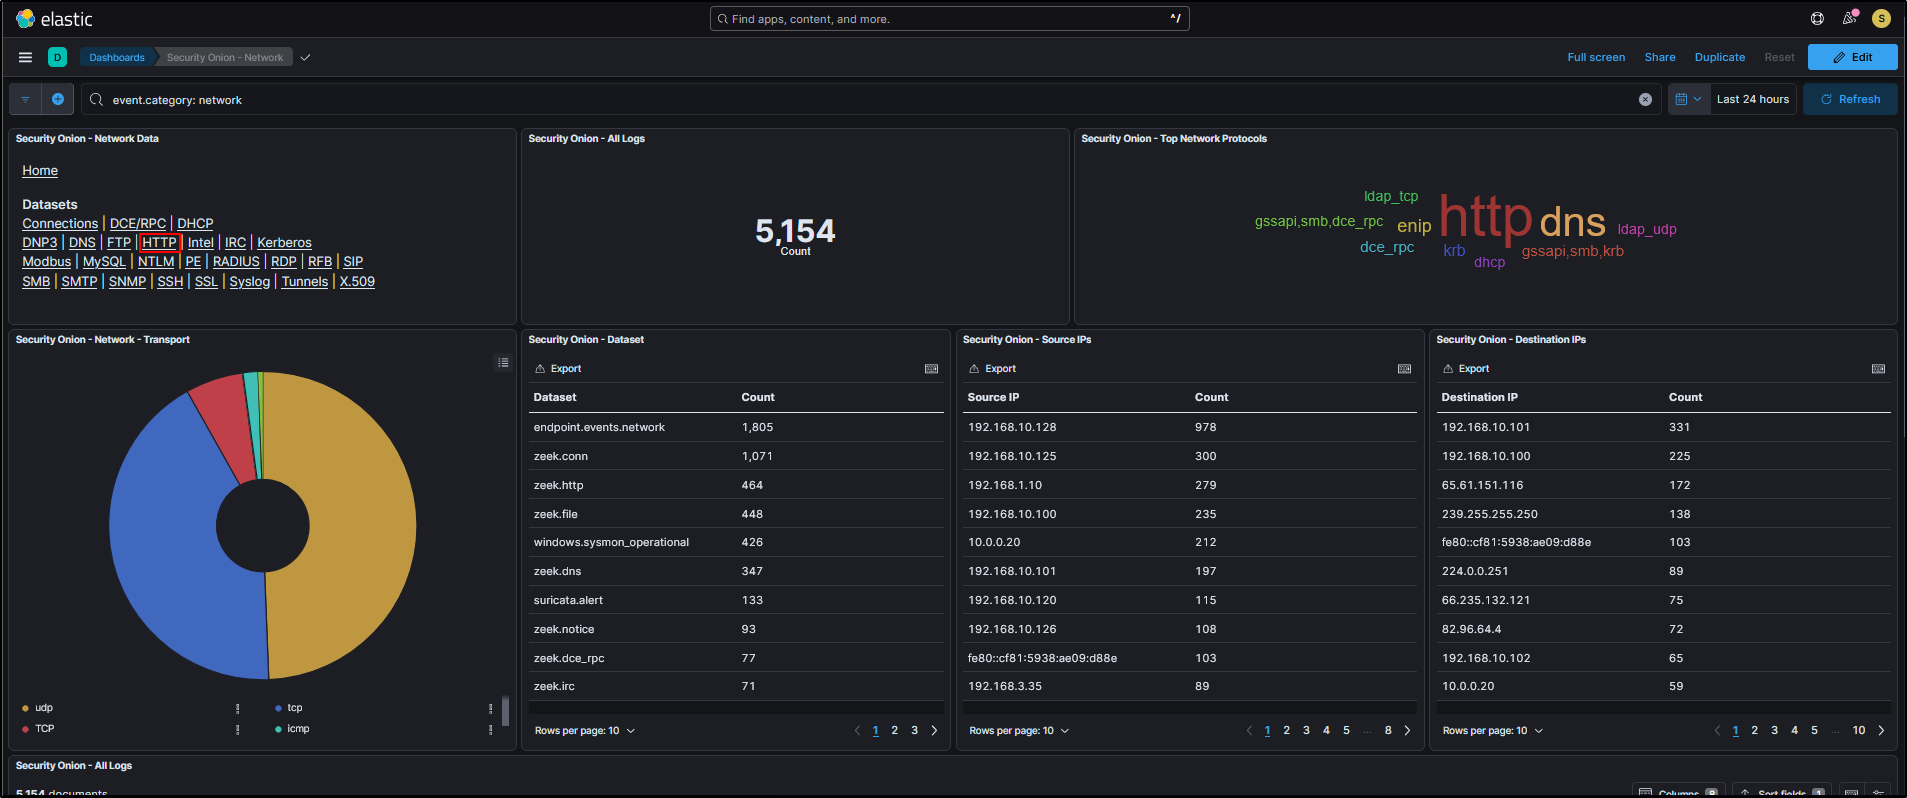
You will now see detailed tables and visualisations specifically related to HTTP data, similar to what you would find in the SOC Dashboards.
Individual events appear at the bottom of the page.
Whether you are using SOC or Kibana, you are viewing data from the same underlying Elasticsearch database. It is just presented through different interfaces.
Elastic Fleet
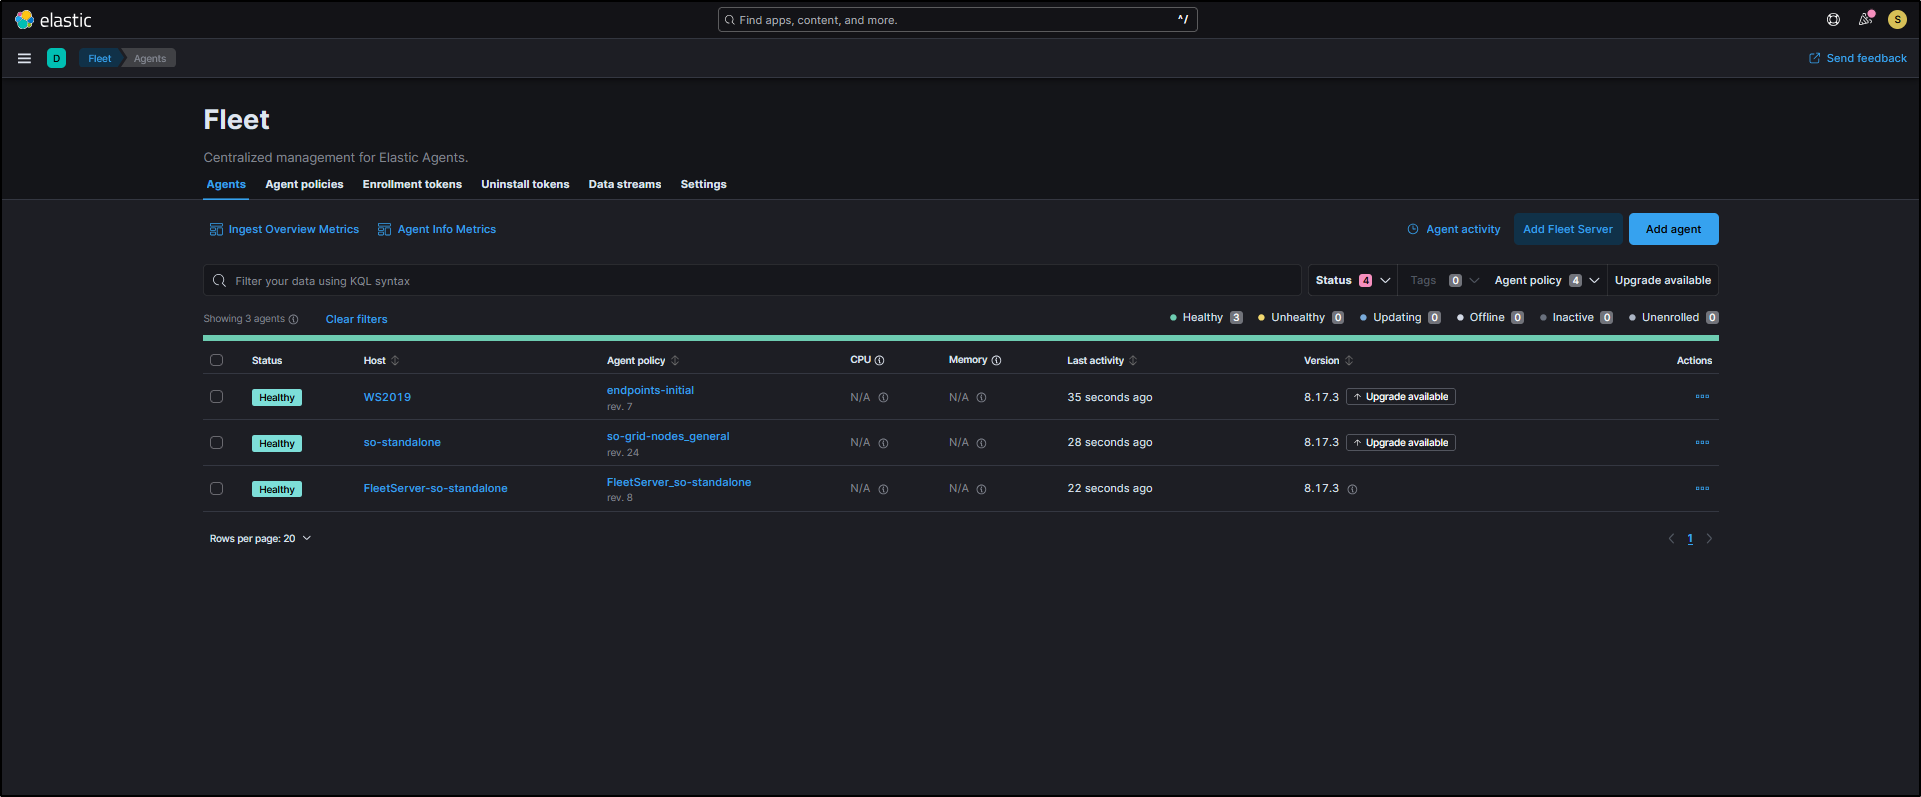
Elastic Fleet is where you manage and configure your Elastic Agents.
Clicking on Elastic Fleet in the SOC interface opens it in a new tab. You’ll see a list of registered agents, for example, WS2019, so-standalone, and FleetServer-so-standalone. These represent the hosts currently enrolled and reporting data to Security Onion.
Osquery Manager
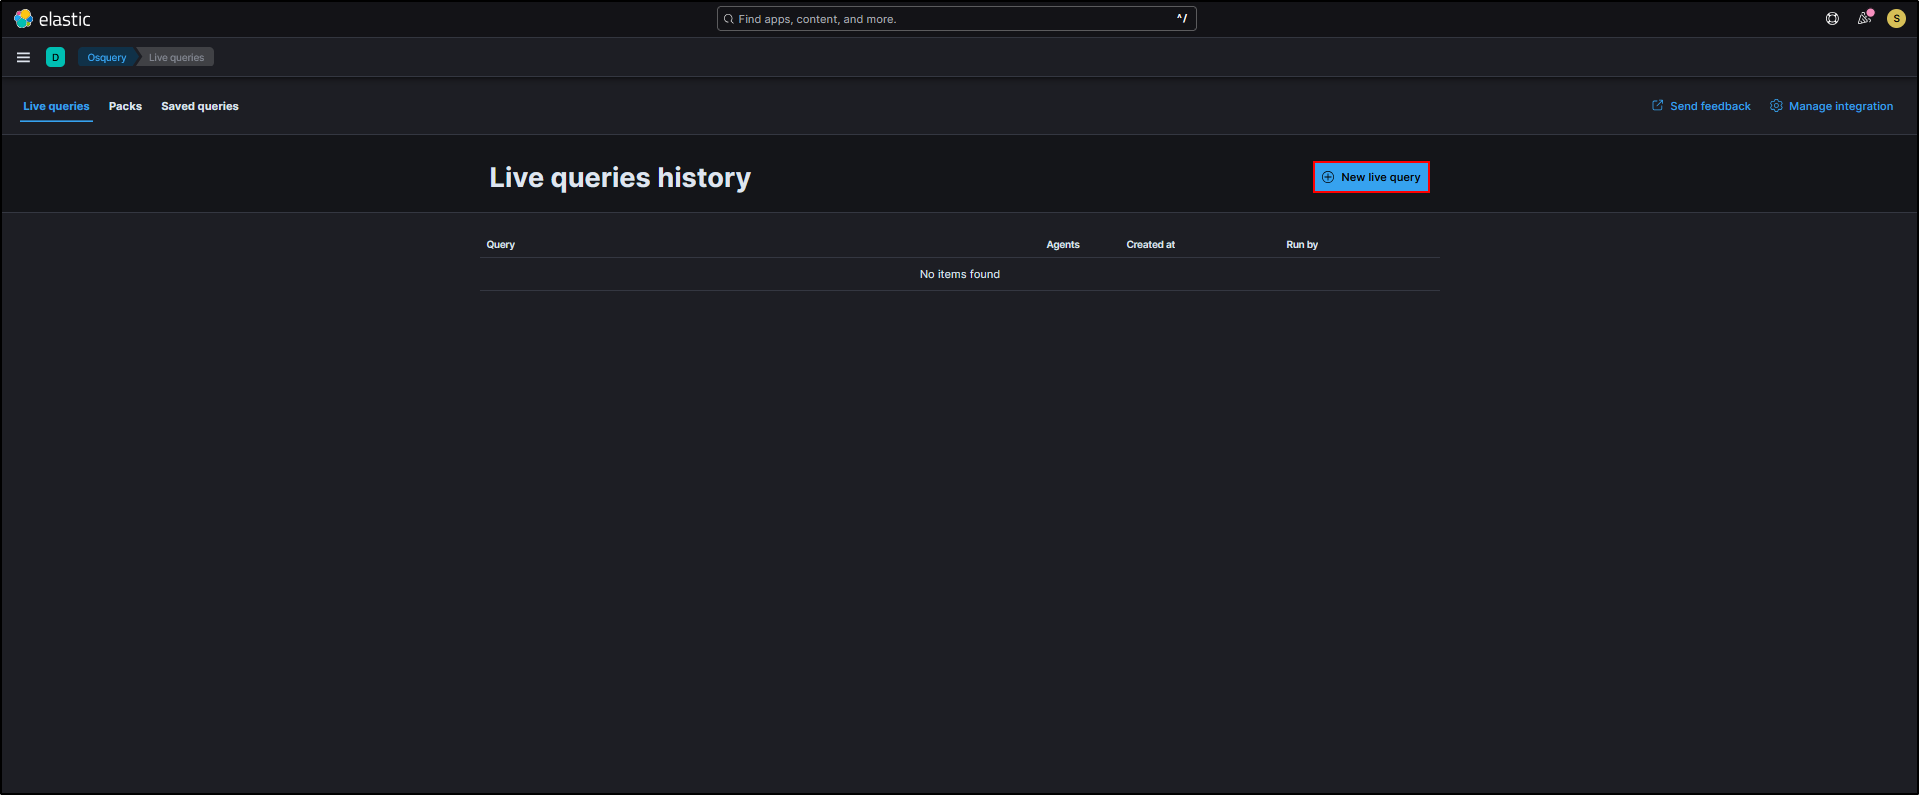
The Osquery Manager lets you send live Osquery to endpoints where Elastic Agents are installed. Originally developed by Facebook, Osquery treats endpoints like databases, allowing you to run structured queries against them.
Clicking on Osquery Manager in SOC opens it in a new tab. To get started, click New live query.
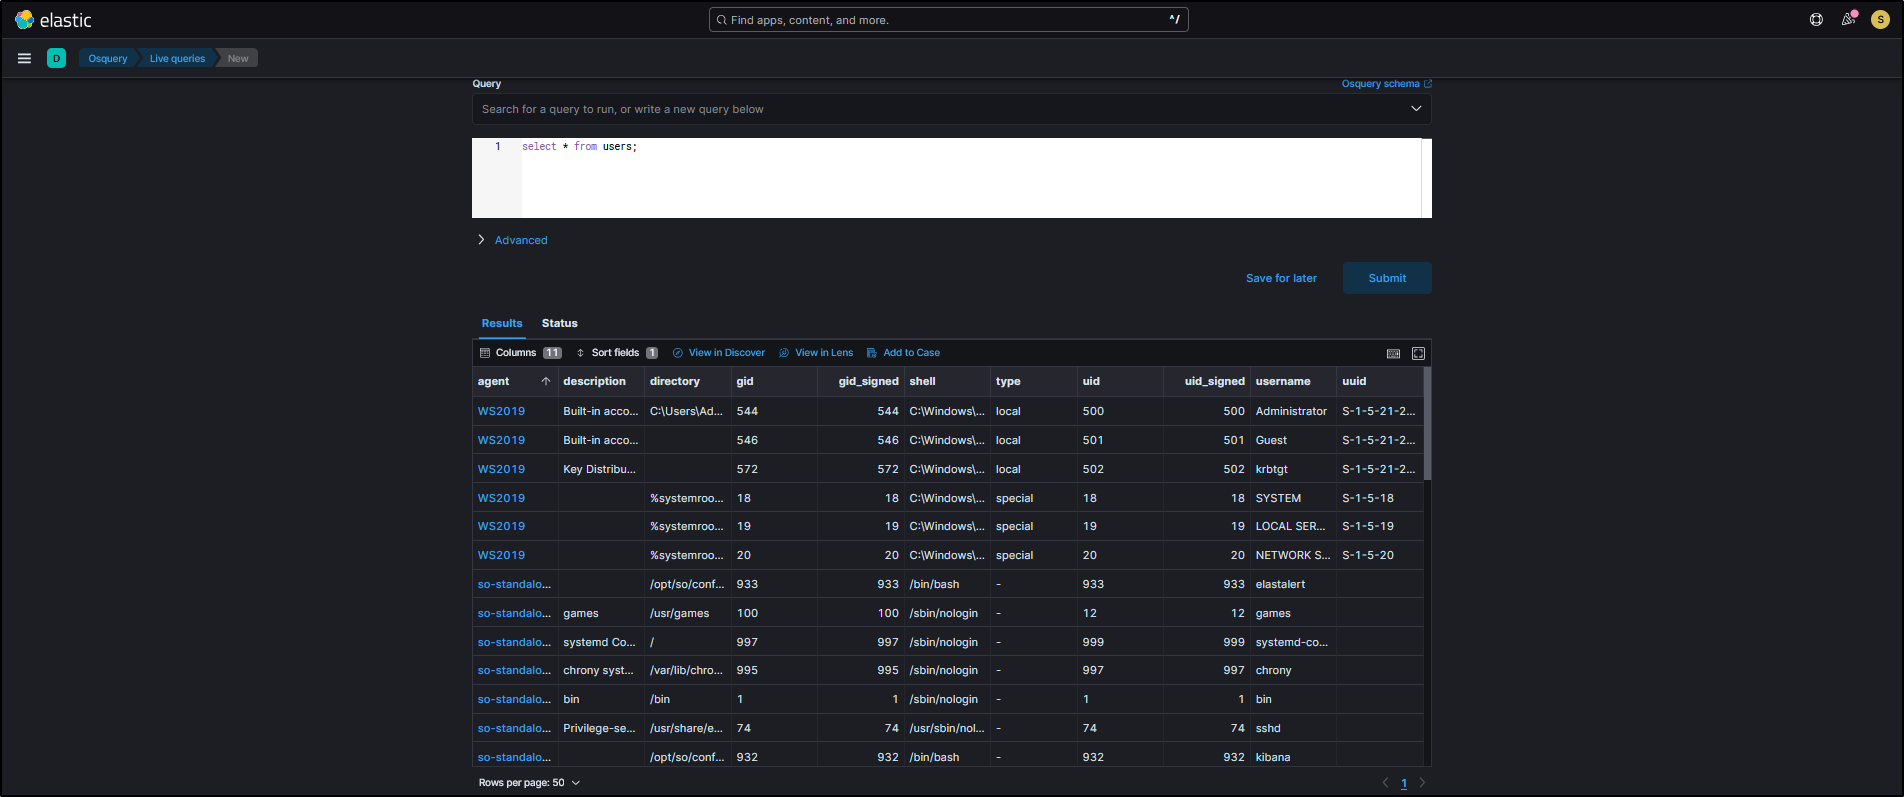
For example, if you want to gather a list of all user accounts across the machines in your network, you can run this Osquery across all agents:
For Query type, select Single query. For Agents, select All agents. For Query, enter the following query and click Submit.
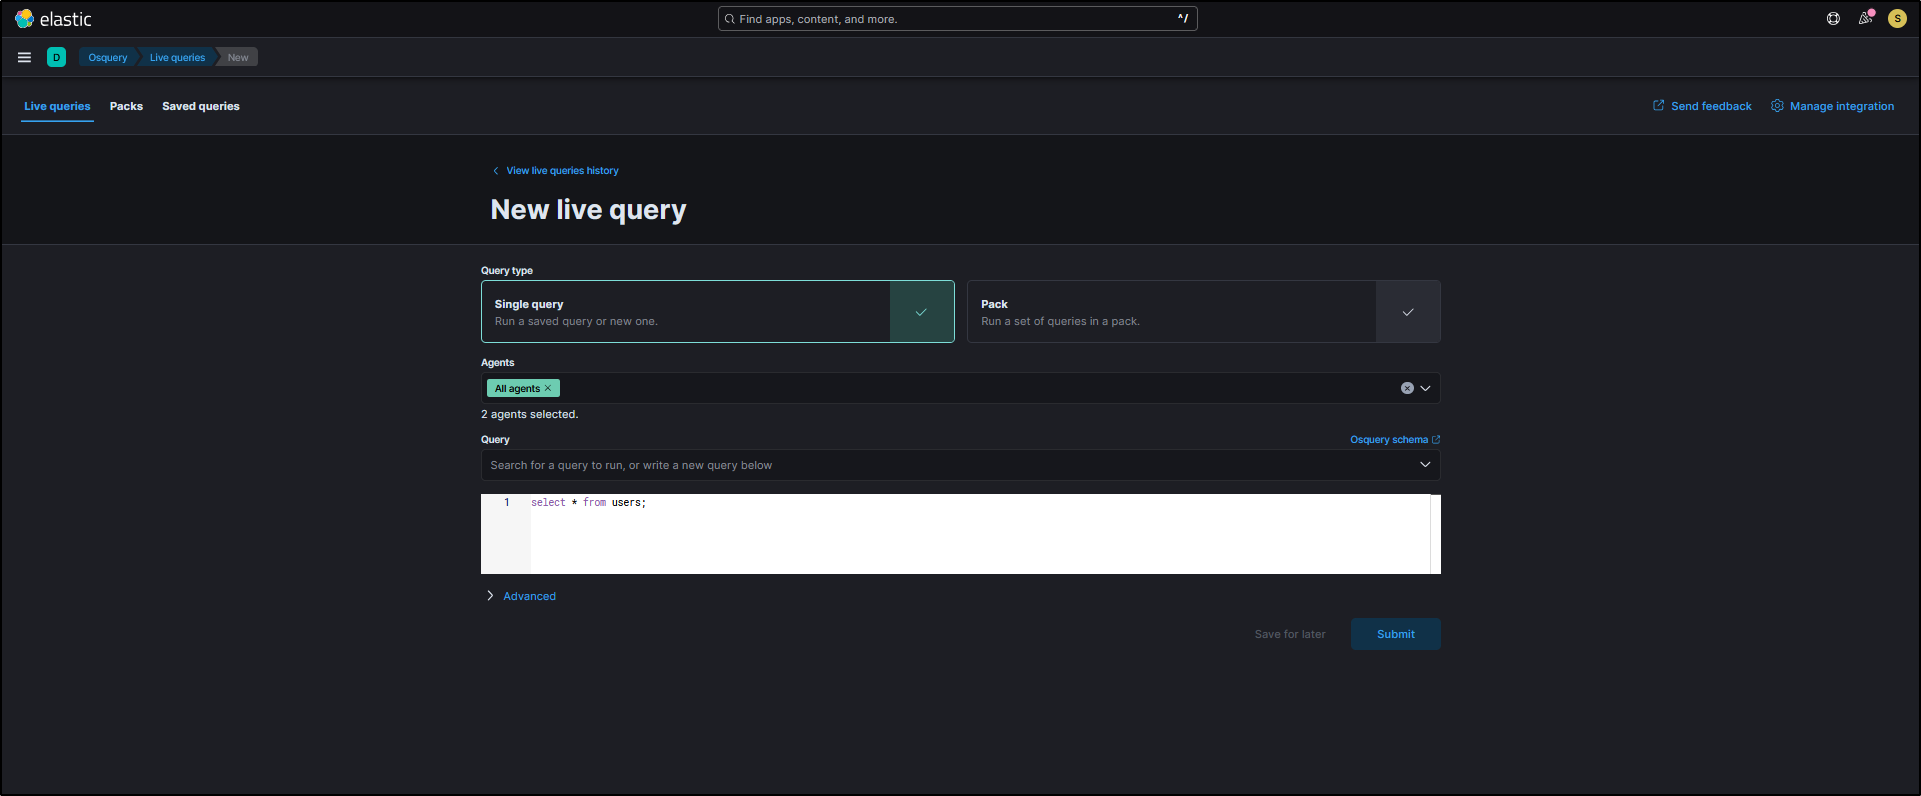
Security Onion will then contact all selected agents and request user account information regardless of what operating system each endpoint is running.
InfluxDB
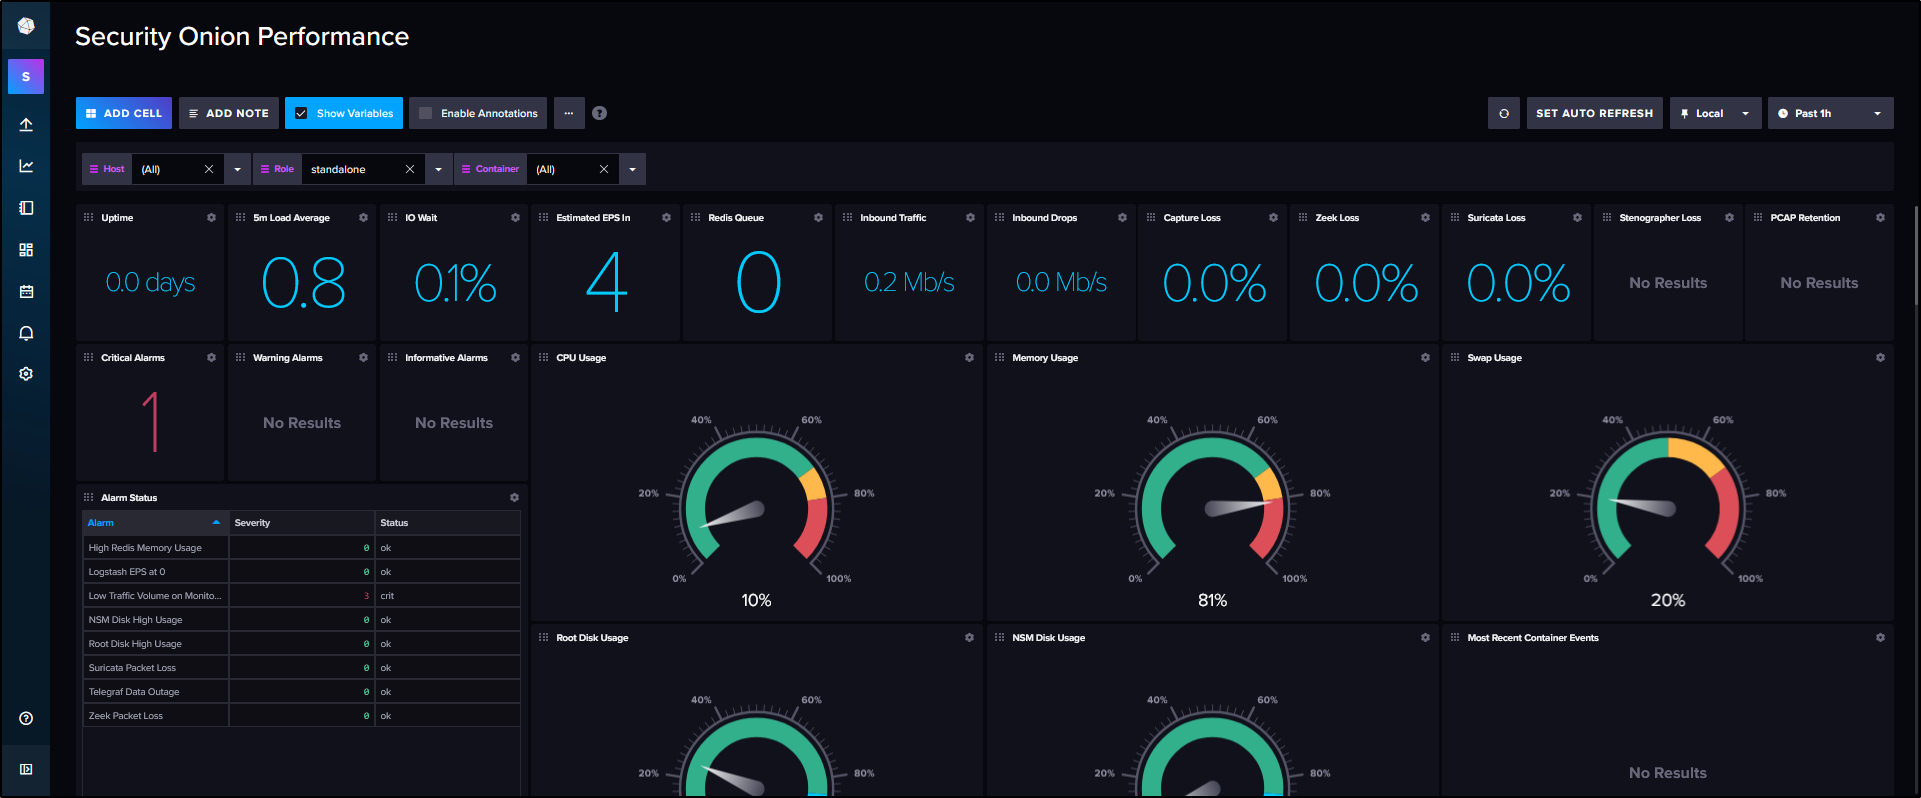
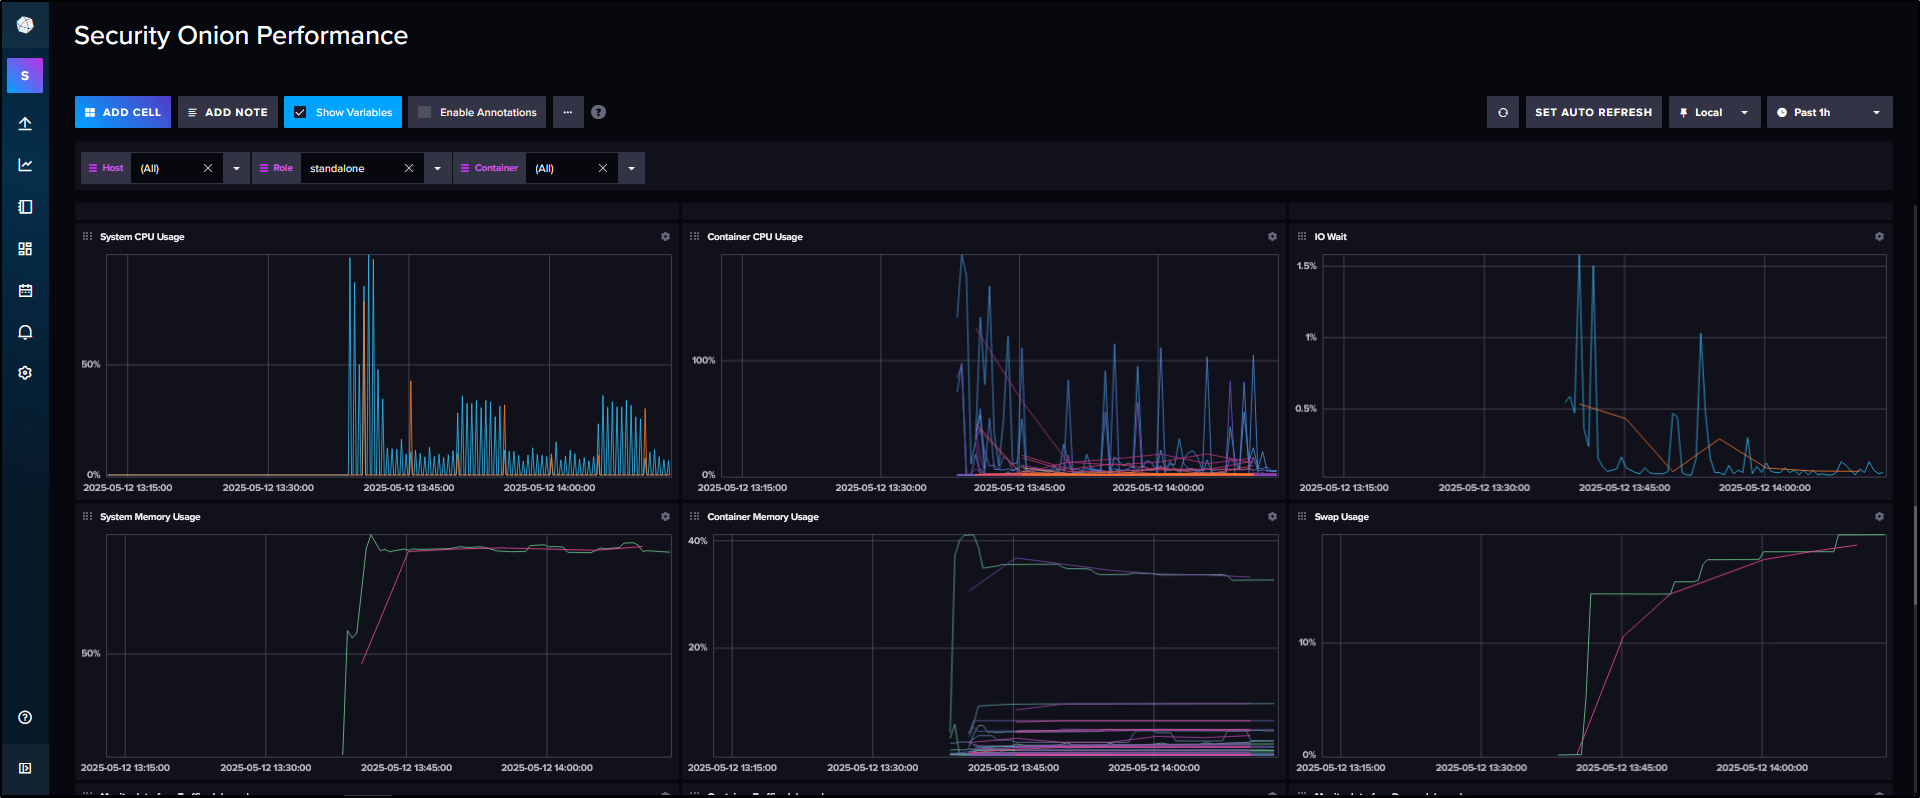
InfluxDB shows similar information to what you see on the Grid screen, but with one key difference - it provides historical telemetry, not just real-time status. This is especially useful for spotting trends, such as changes in CPU usage over time.
You can open InfluxDB by clicking InfluxDB in the SOC menu, or by clicking the node status icon at the bottom of the Node Status pane in the Grid view. Both will open it in a new tab.
CyberChef
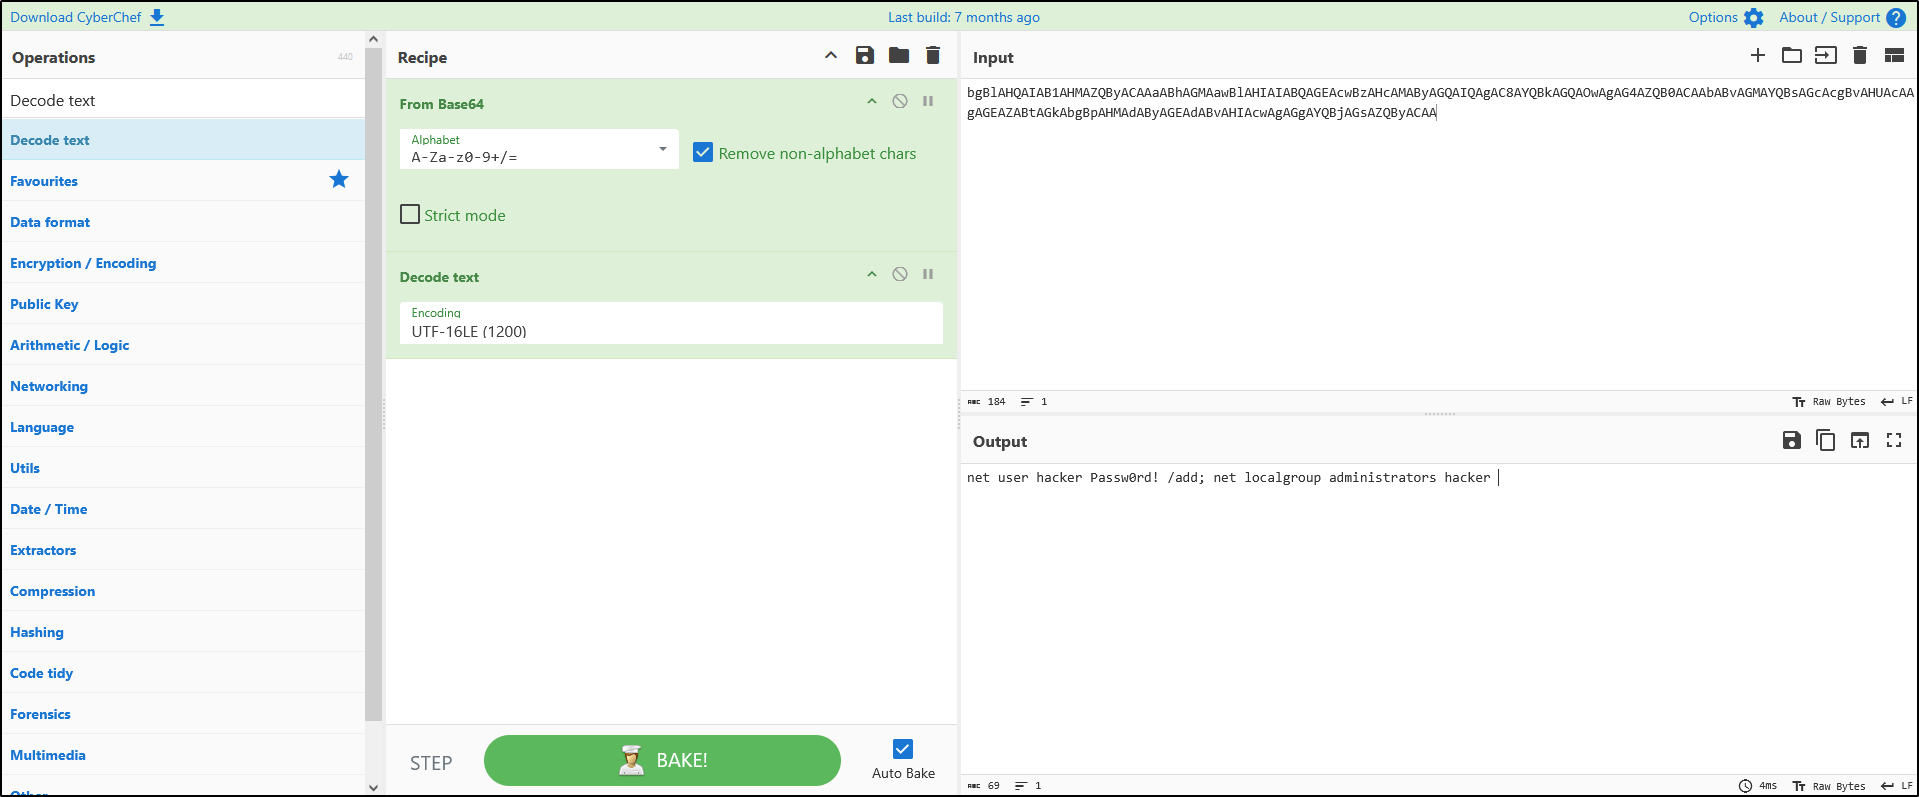
CyberChef is a browser-based tool used for encoding, decoding, and analysing data. It is especially useful for tasks like decoding Base64, converting binary, or analysing encoded payloads in threat investigations.
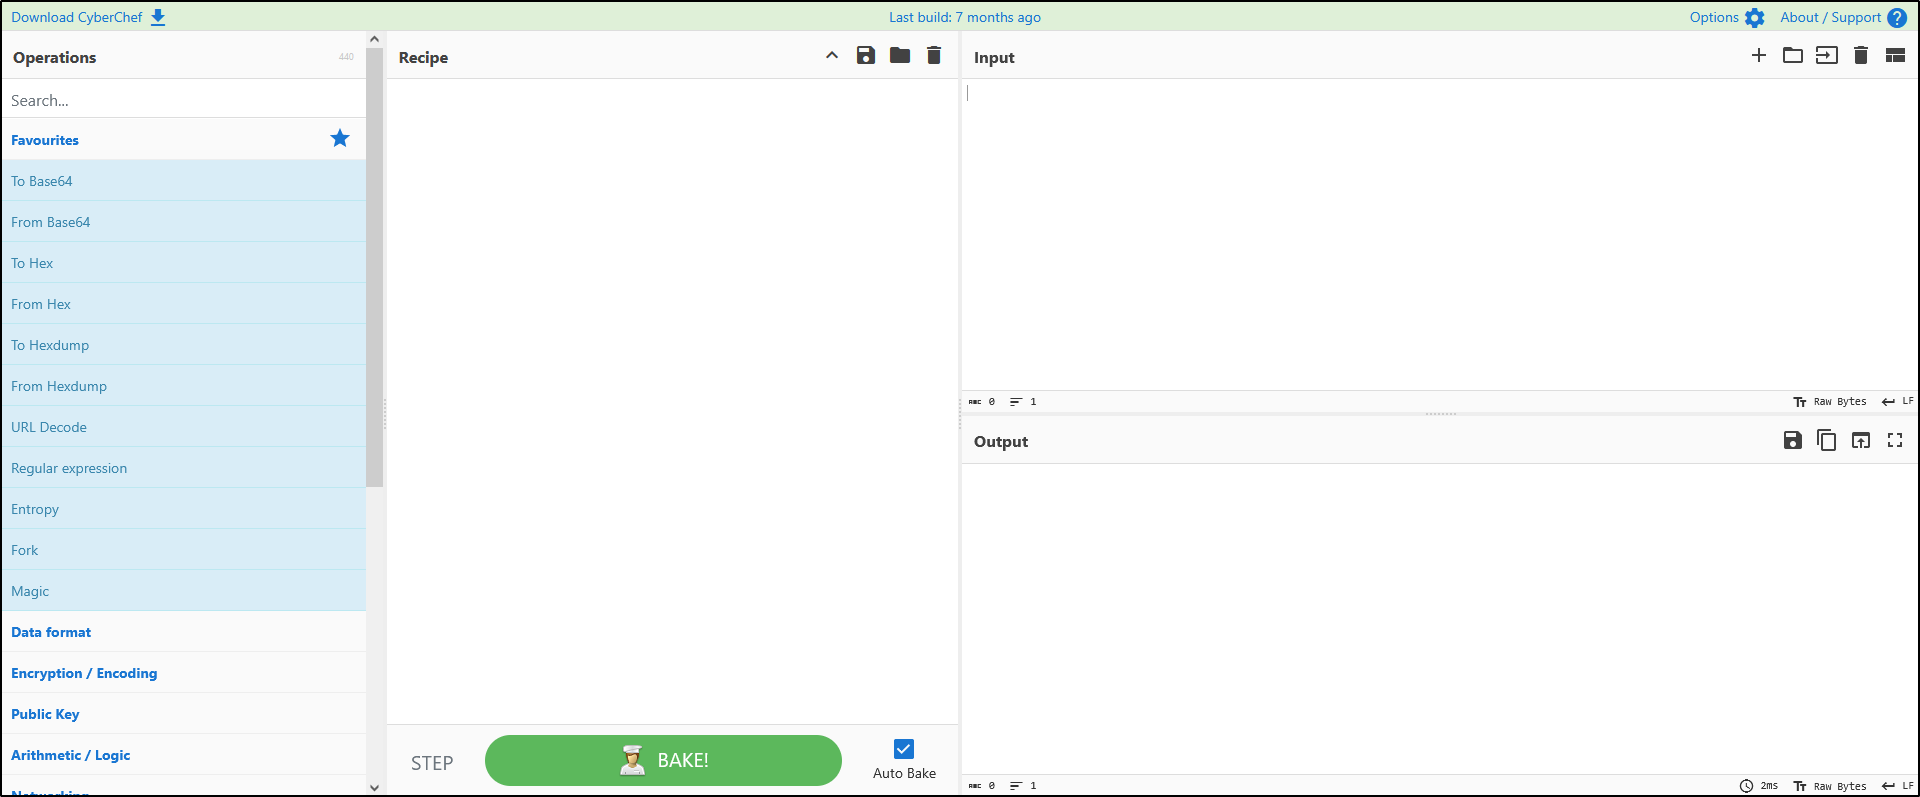
Copy and paste the following string into the Input box:
bgBlAHQAIAB1AHMAZQByACAAaABhAGMAawBlAHIAIABQAGEAcwBzAHcAMAByAGQAIQAgAC8AYQBkAGQAOwAgAG4AZQB0ACAAbABvAGMAYQBsAGcAcgBvAHUAcAAgAGEAZABtAGkAbgBpAHMAdAByAGEAdABvAHIAcwAgAGgAYQBjAGsAZQByACAA
Drag and drop From Base64 and Decode text into the Recipe panel from the Operations list. For Decode text, select the UTF-16LE encoding. You should now see the decoded command in the Output. The command appears to show the attacker adding themselves to the local administrators group.
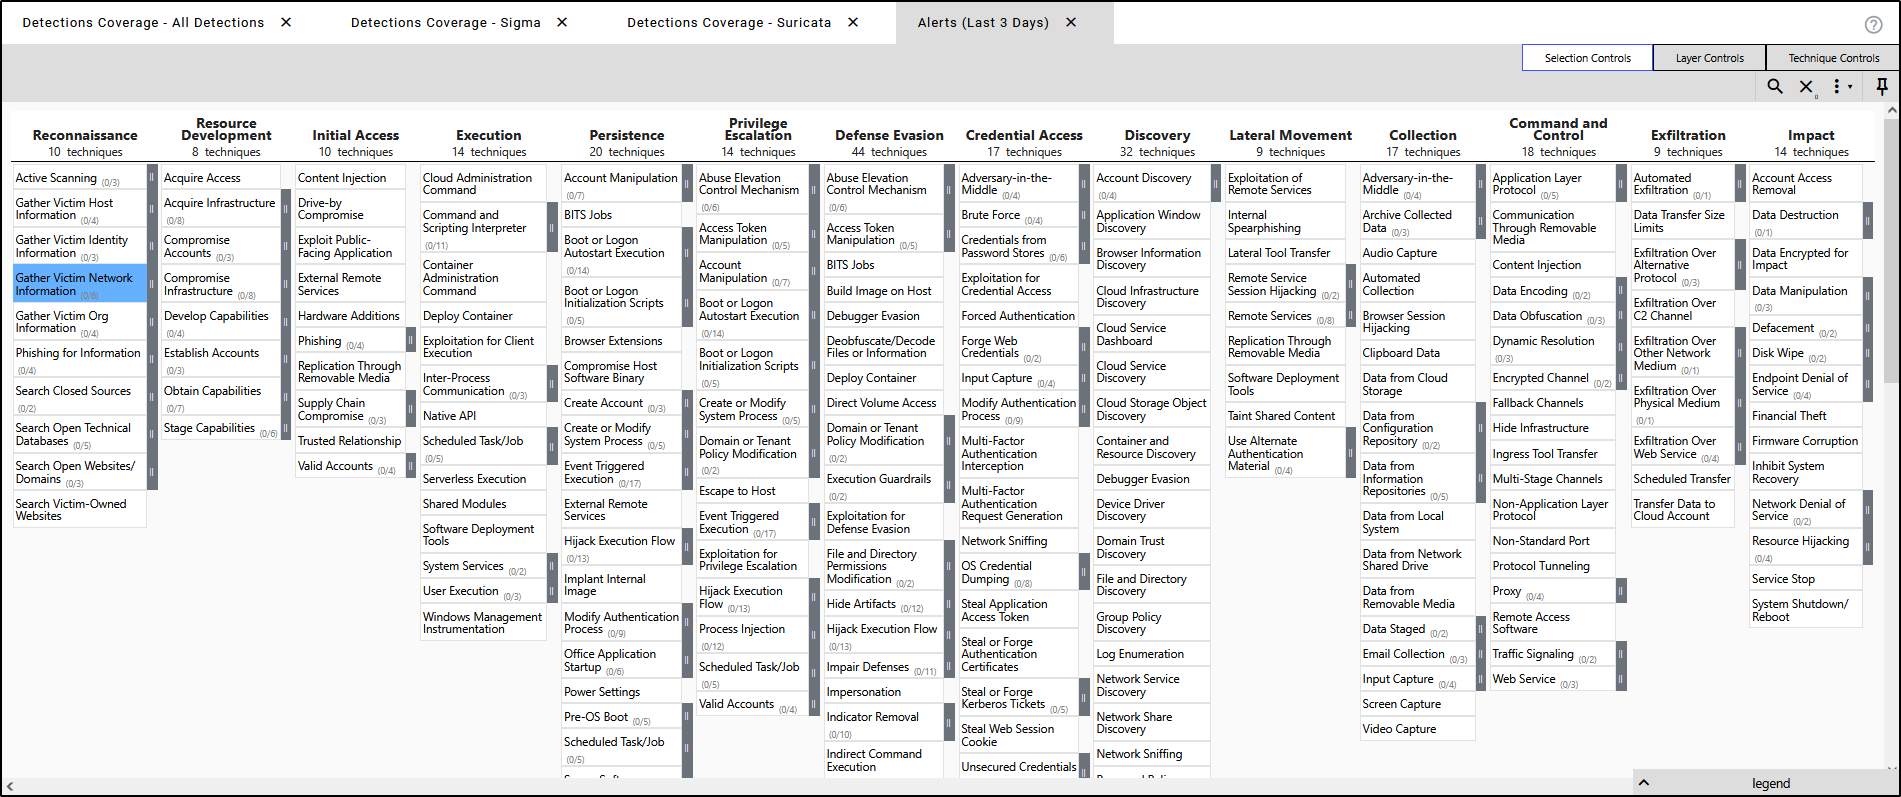
Navigator
The Navigator in Security Onion is a visual tool built on the MITRE ATT&CK framework, showing which attacker techniques your environment is currently able to detect.
It does this by mapping your enabled Sigma rules to specific ATT&CK techniques, with colour coding used to indicate which areas are covered.
As you enable more rules, the chart updates automatically helping you spot any gaps in your detection coverage at a glance.
Updating Security Onion
The easiest way to check for Security Onion updates is by visiting the Security Onion Blog, which you can access from the Overview tab in the SOC interface.
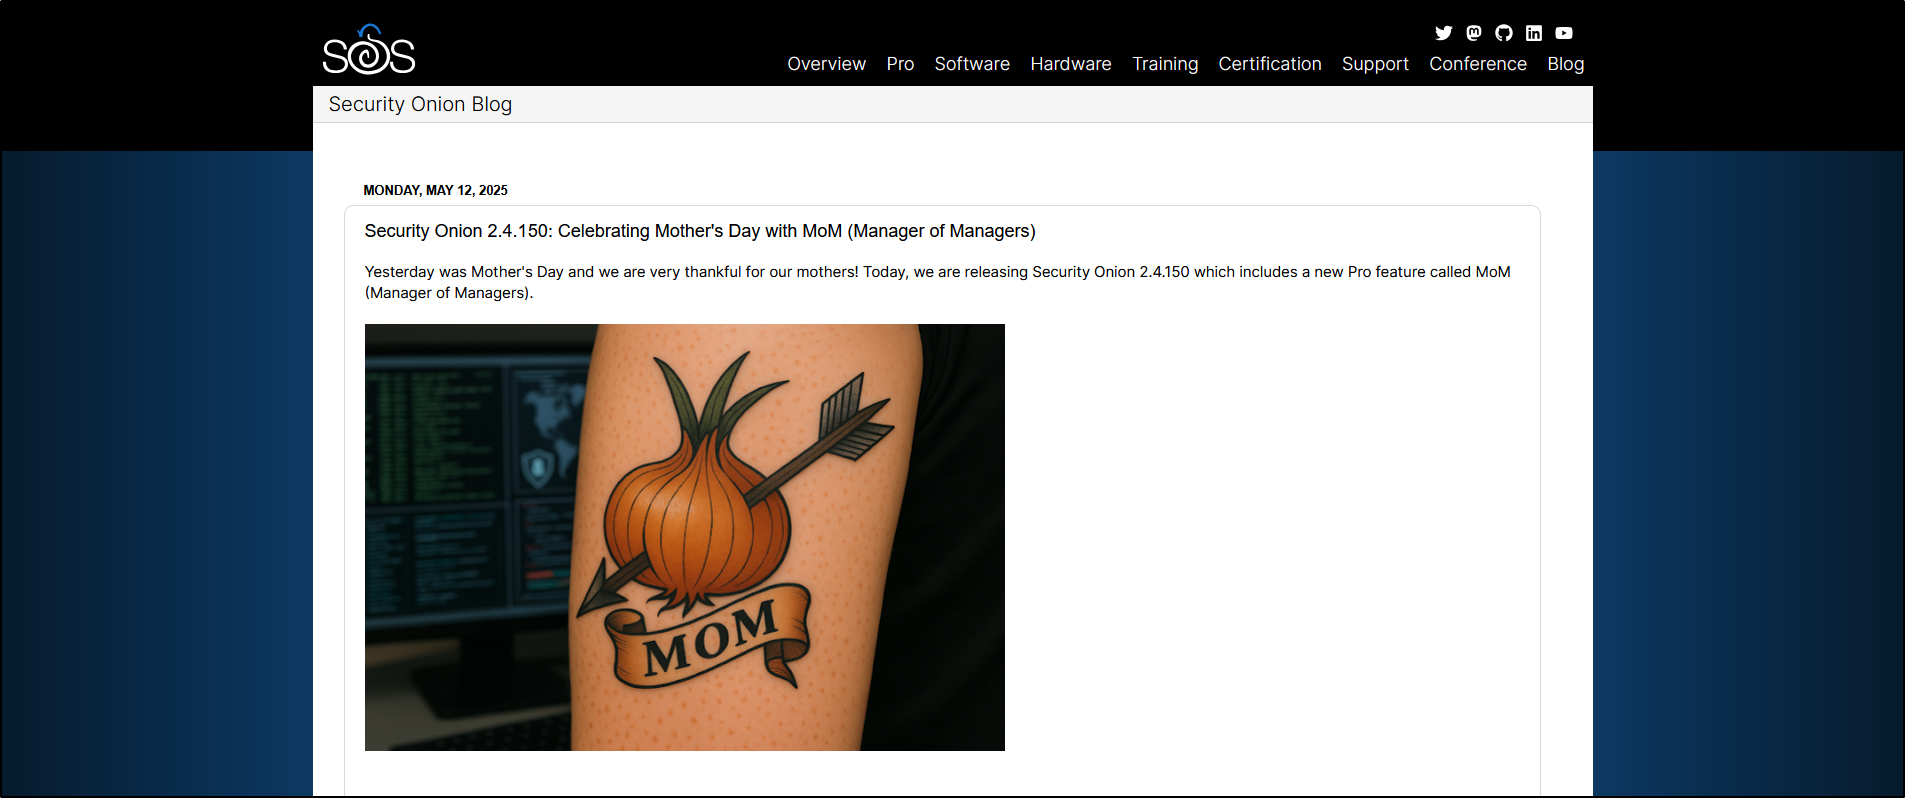
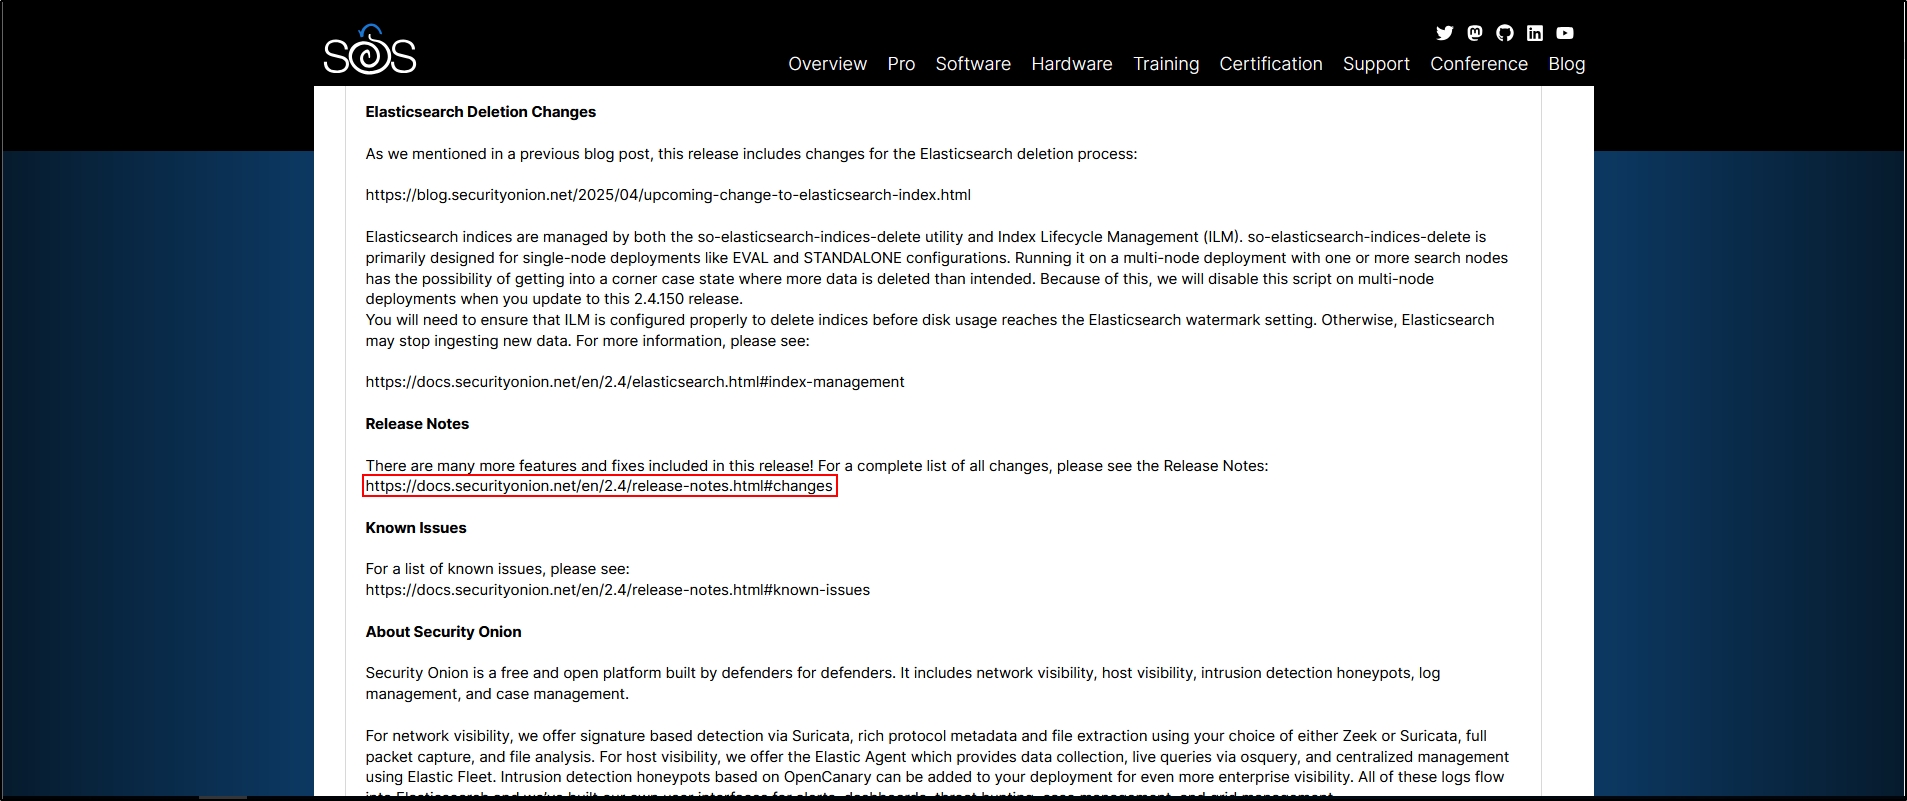
You can also keep an eye on Security Onion’s social media channels for update announcements. These usually include a direct link to the Release Notes.
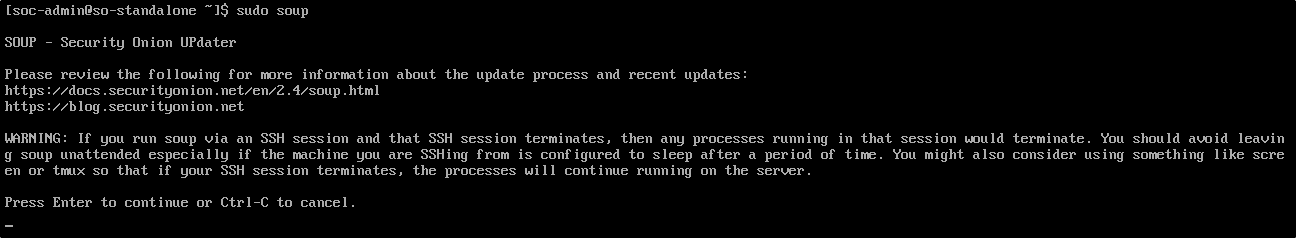
To install updates, Security Onion provides a built-in tool called Security Onion Updater, or soup for short.
Updating Security Onion with Internet Access
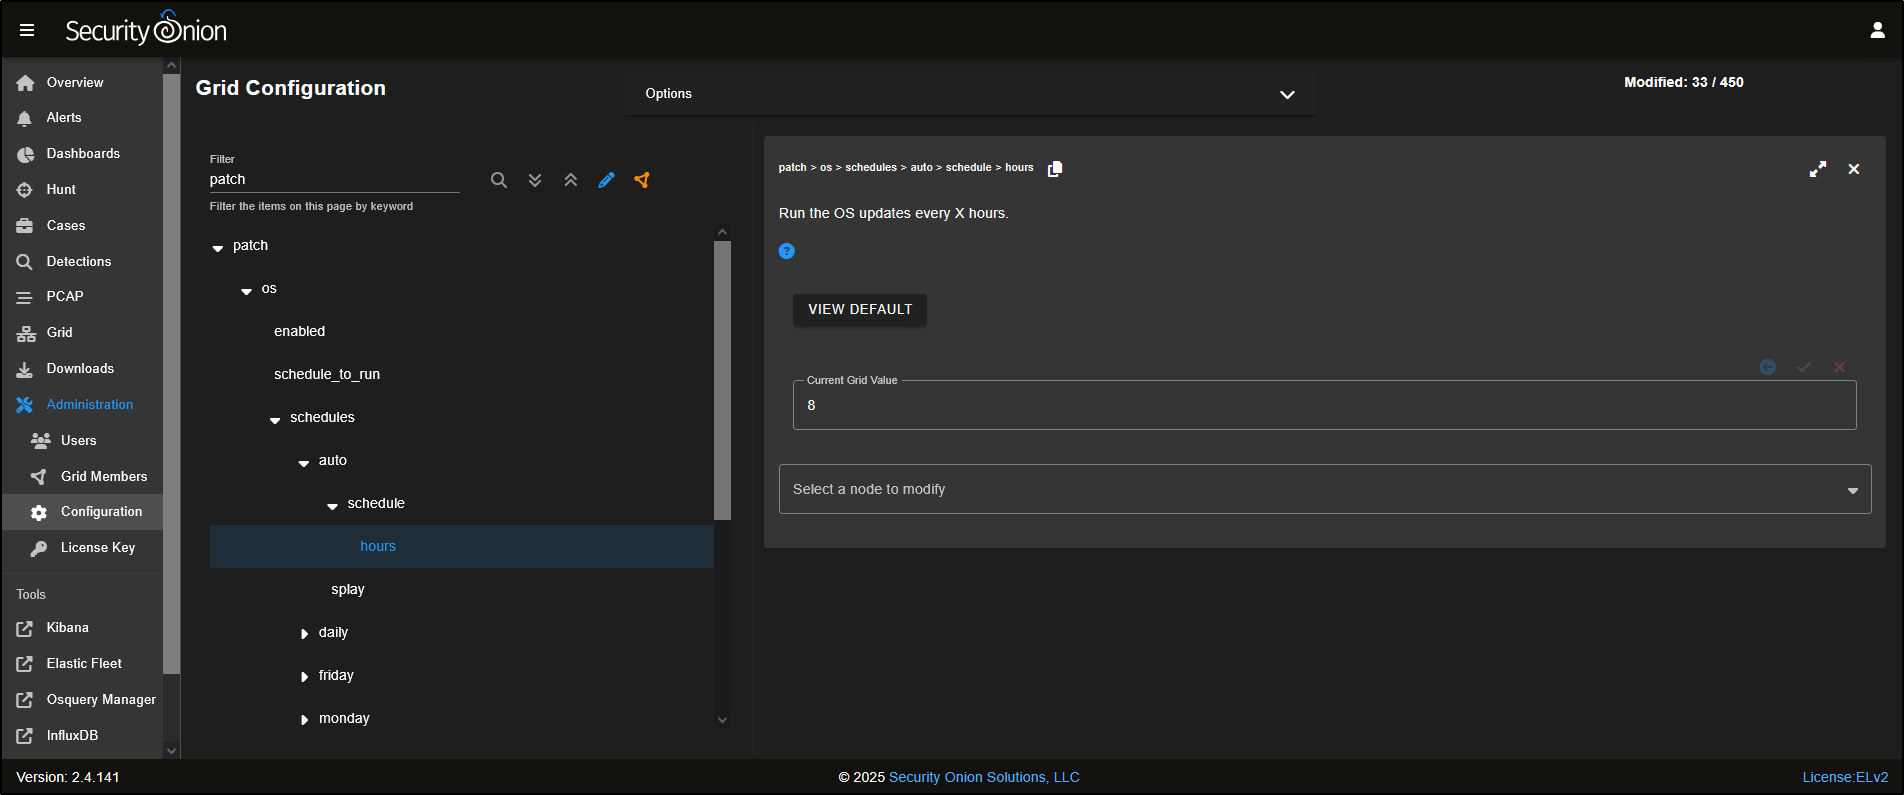
If you chose the standard install from the Security Onion ISO and your system has internet access, the underlying Oracle Linux OS will automatically check for and apply updates every eight hours by default.
If you would like to change this schedule, you can do so in the SOC interface by navigating to:
Administration → Configuration → patch → os → schedules → auto → schedule → hours.
Open the local console for your Standalone Security Onion VM and log in with your administrator credentials. To check the current status of the platform, run:
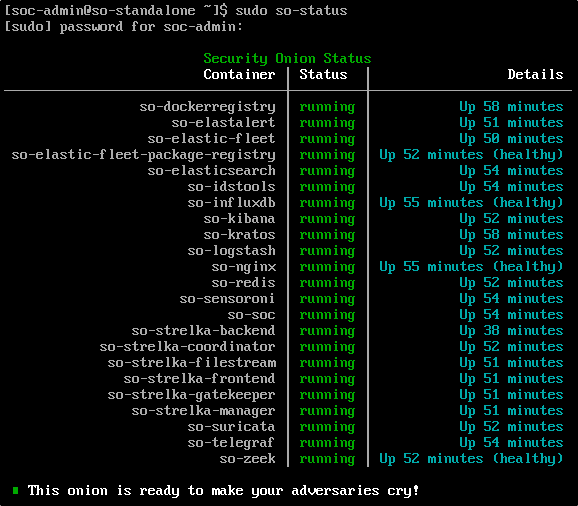
If any of the containers are showing as missing or failed, you will need to resolve those issues before continuing with the update.
To check the current version of Security Onion, run:
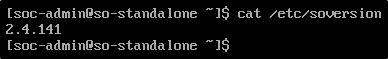
In this example, the current version is 2.4.141.
To start the update process, run:
You will likely need to run soup twice:
- The first run updates the soup script itself.
- The second run executes the new script and downloads the updated Docker images and Salt files needed for the upgrade.
Updating Security Onion in an Air-Gapped Environment
If your Security Onion deployment is running in an air-gapped environment (i.e. no internet access), updates need to be applied using a local copy of the ISO.
First, download the latest ISO from another internet-connected machine.
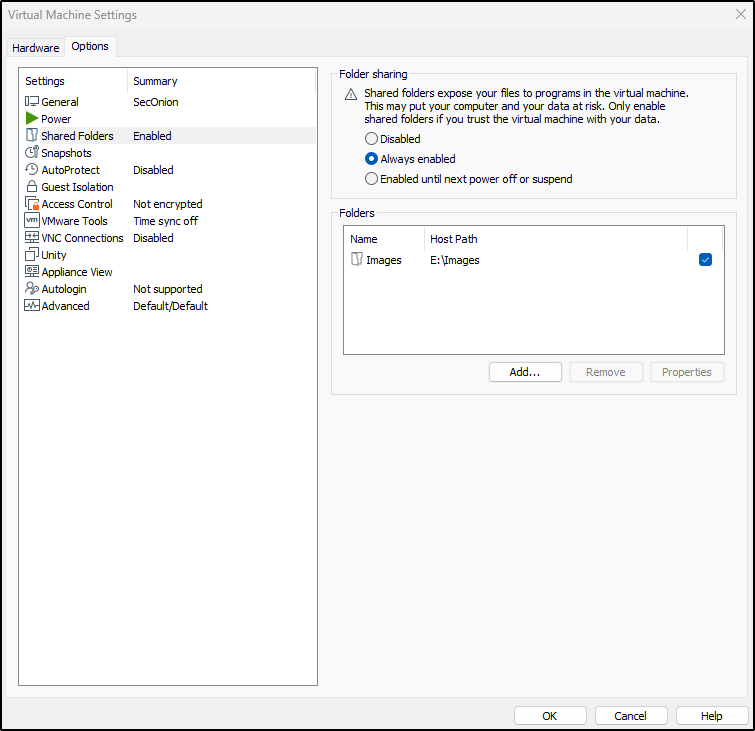
In VMware Workstation, go to your VM’s settings and navigate to Shared Folders.
Select the folder where your new ISO is stored, tick Always enabled, and click OK to save.
Next, open the local console for your Standalone Security Onion VM and log in with your administrator credentials.
To confirm that the shared folder and ISO are accessible, run:

As shown above, the updated ISO file securityonion-2.4.150-20250512.iso is available in the shared folder.
If you cannot access the shared folder, try the following:
- Disable the shared folder in VMware settings.
- Re-enable it and try again.
If it still does not work, temporarily connect the VM to the internet and install VMware Tools:
sudo dnf install open-vm-tools open-vm-tools-desktop -y
sudo systemctl enable --now vmtoolsd
sudo reboot
To check the system’s global configuration, run the following command:
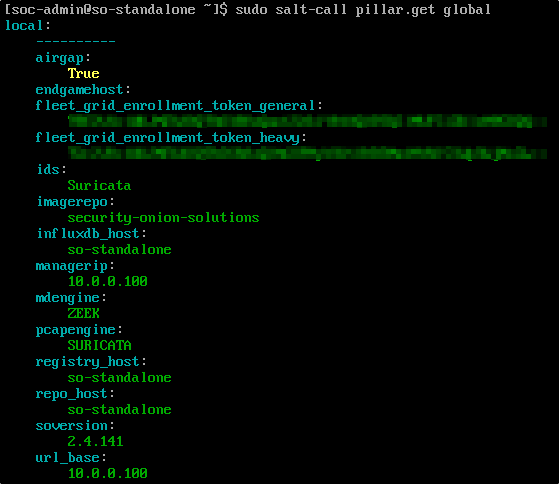
As shown in the output, the global configuration confirms that airgap: True, which means the system is set up for offline updates only.
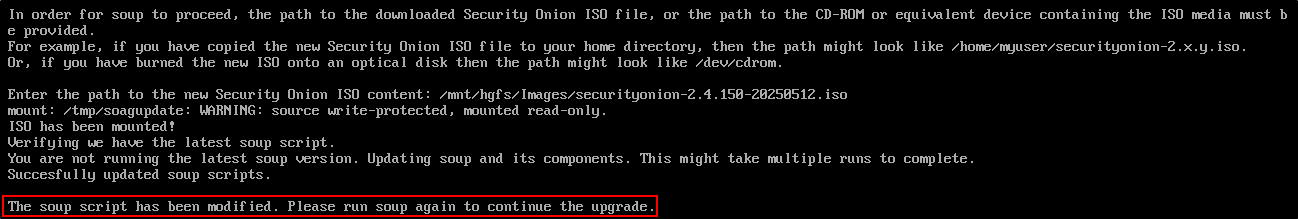
To begin the update process, run sudo soup and this will request location for the new ISO file.
Press Enter and then enter the full path to the new Security Onion ISO.
The first run completes the update of the soup script.
Now run sudo soup again to begin the full update process:
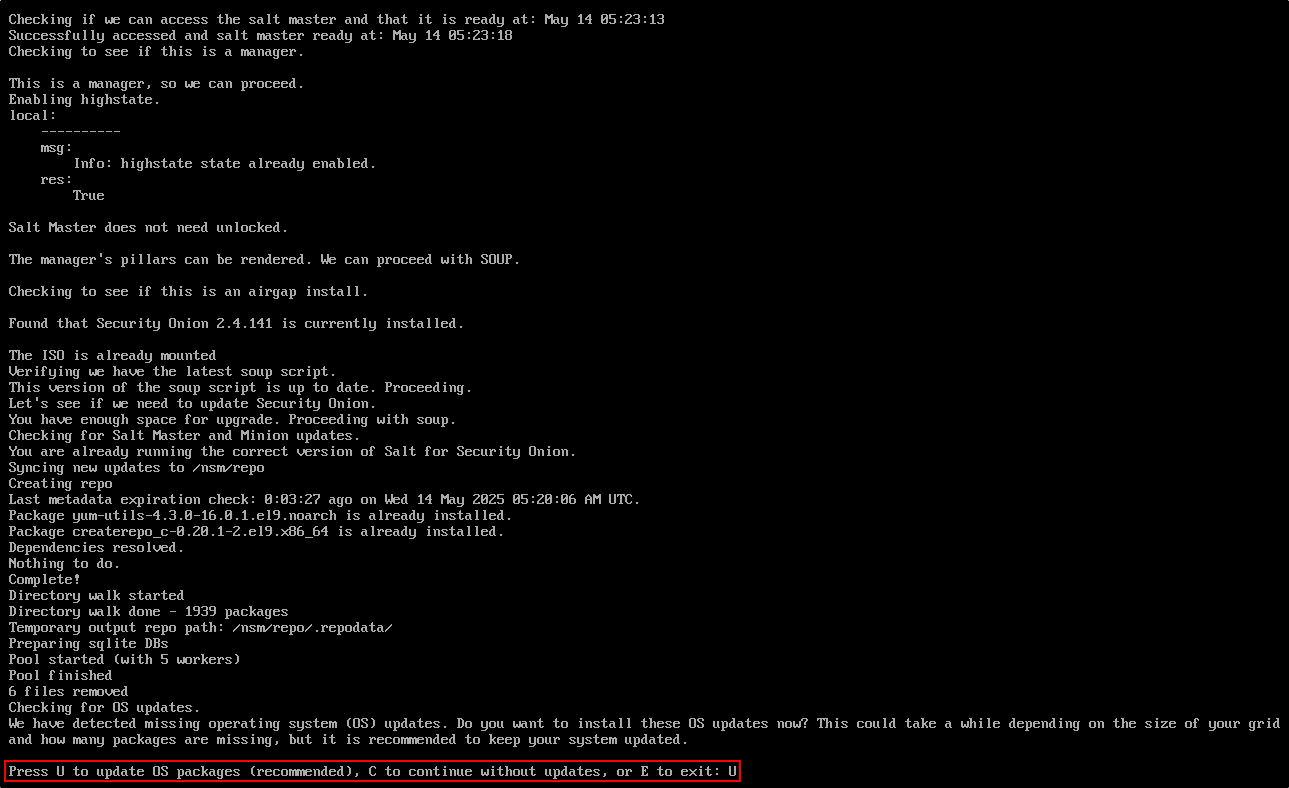
Since this is an air-gapped installation, the updater will also include operating system patches bundled with the ISO.
When prompted, press U to confirm the OS updates. The system will now install both Oracle Linux updates and the latest Security Onion components. Note that this process can take a while.
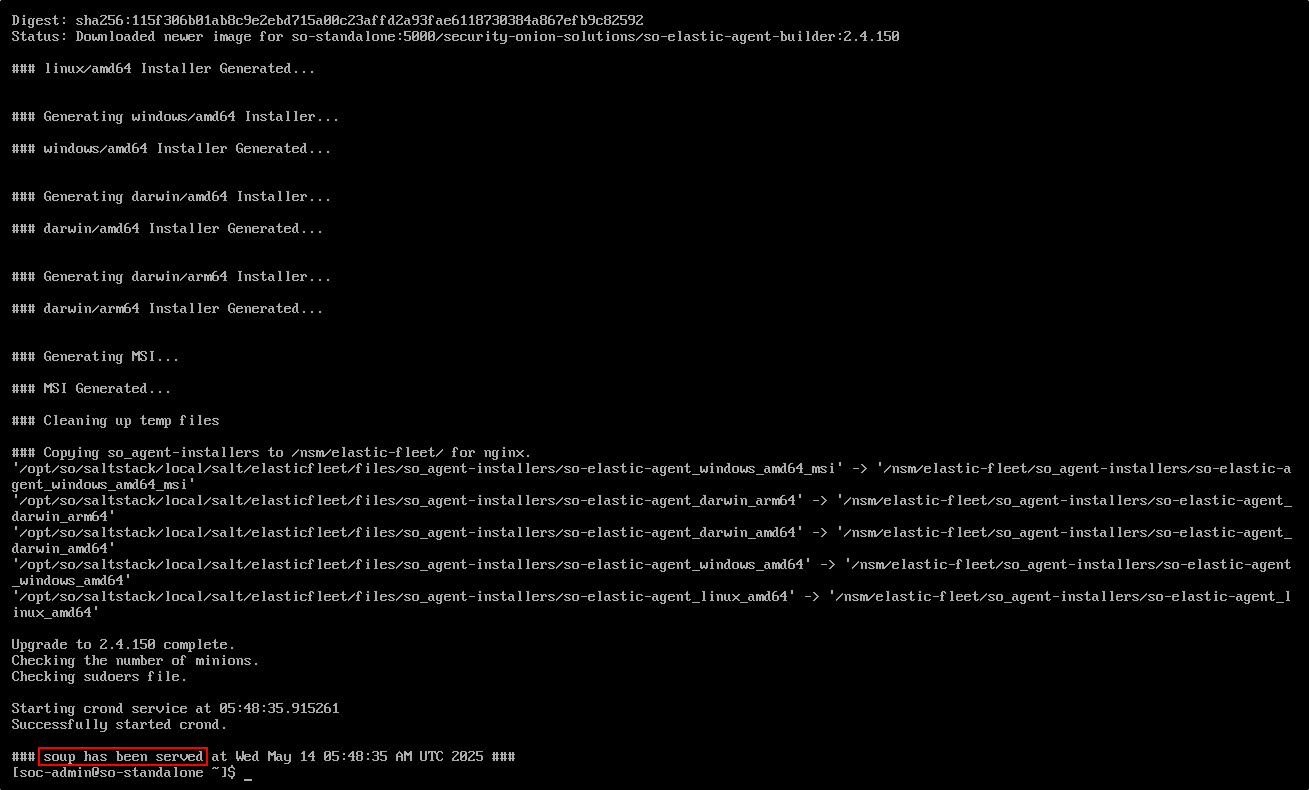
When the update is complete, we will see the message soup has been served.
Verify the version by running:
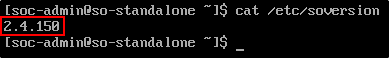
We can now see that the version is 2.4.150.
Verify the node and container status by running:
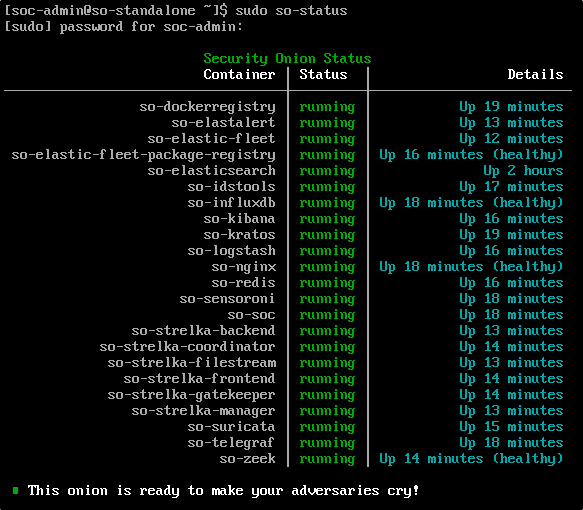
Typically after kernel update, the Security Onion VM needs to be rebooted.
Alert Triage and Case Creation
To begin reviewing security alerts, go to the Alerts tab in the SOC web interface. This is where all triggered alerts are displayed, helping you identify suspicious or potentially malicious activity in your environment.
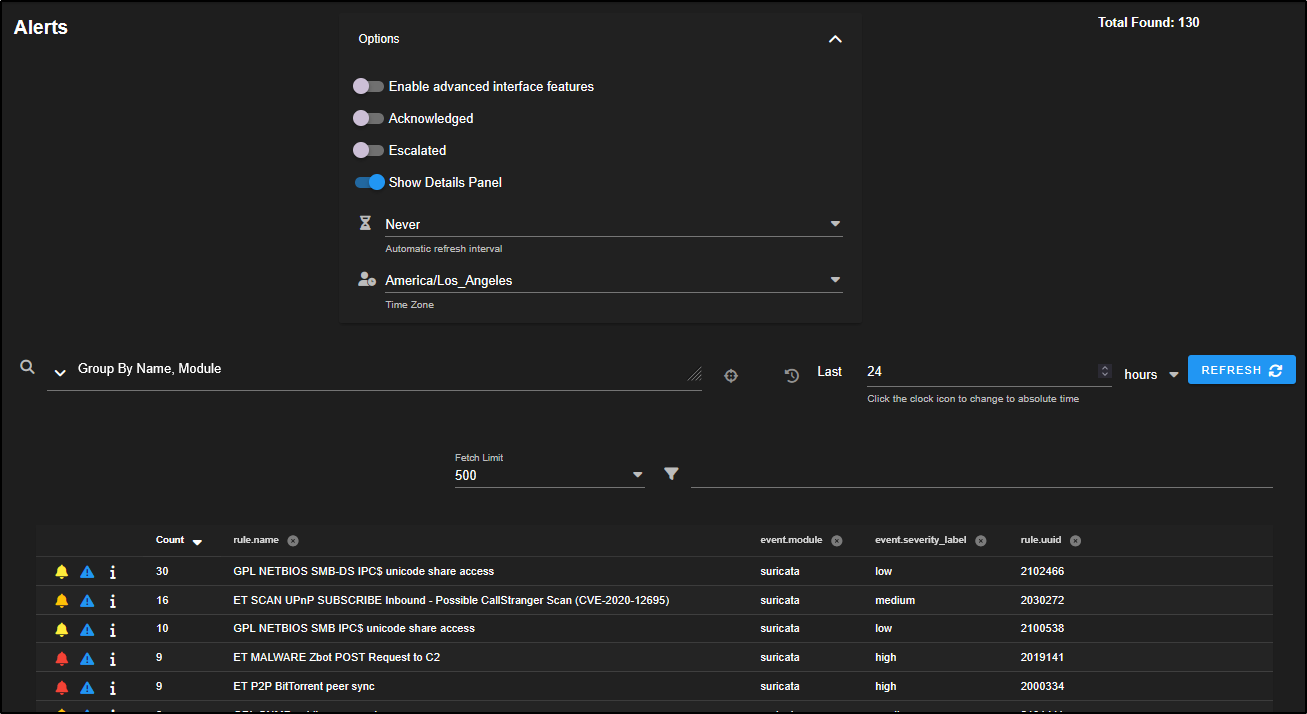
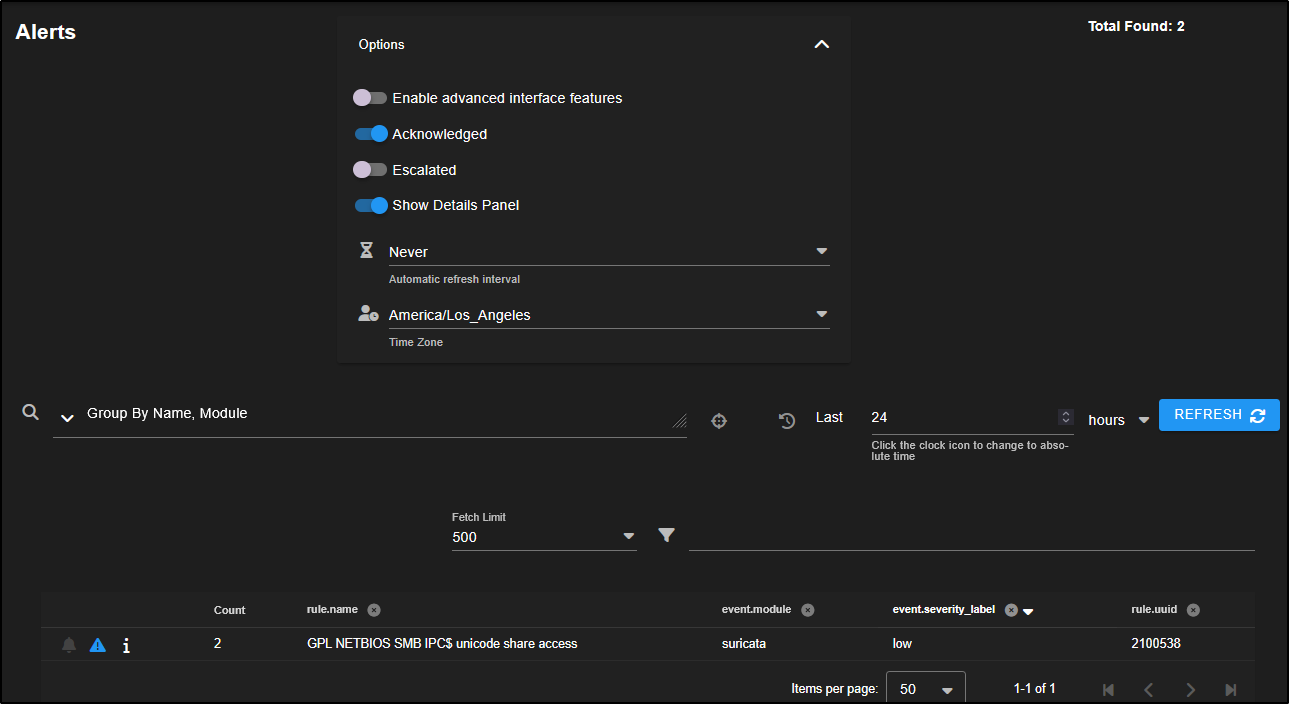
At the top of the Alerts page, there is an Options drop-down menu that lets you customise how alerts are displayed:
- Enable advanced interface features makes the alert view work more like the Hunt interface.
- Acknowledged shows alerts you have marked as false positives.
- Escalated shows alerts that have been turned into cases for further investigation.
- You can also set an auto-refresh interval to check for new alerts regularly.
- The time zone setting adjusts how timestamps appear. Logs are stored in UTC, but the web console converts them to your local time zone for easier viewing.
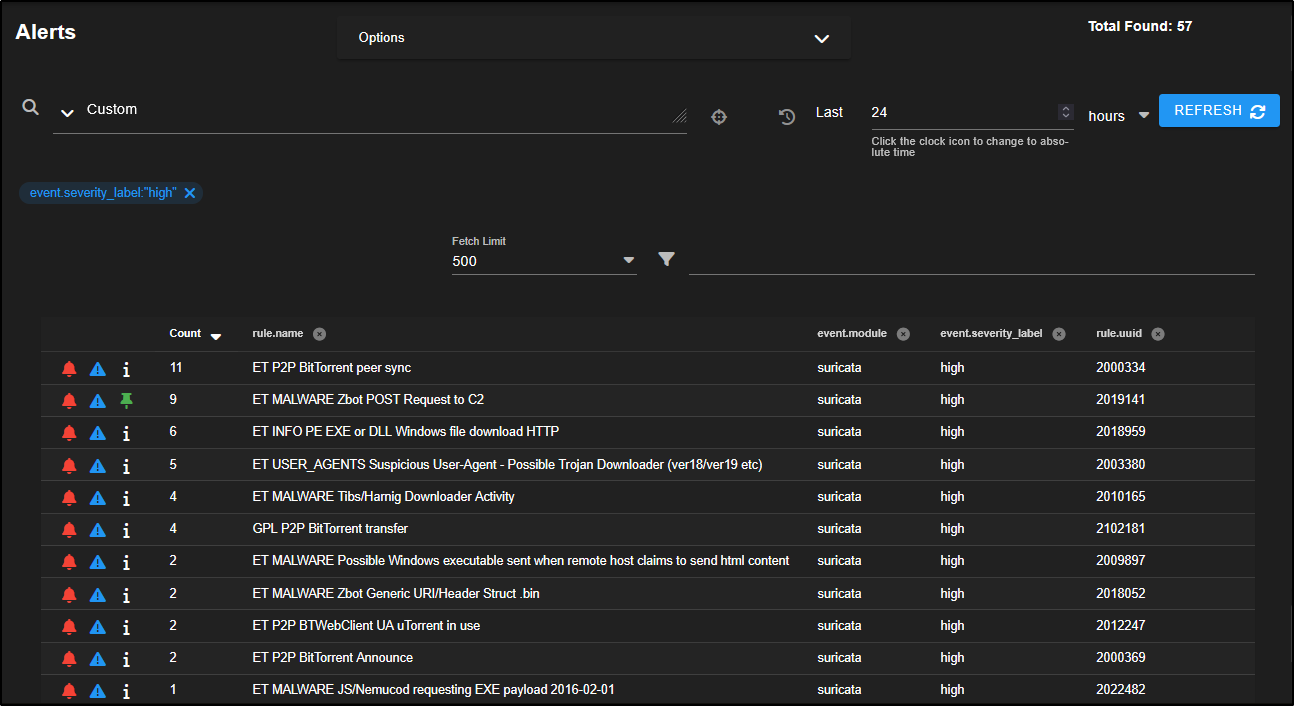
Total Found shows the number of alerts triggered during the selected time period. It counts every alert, not just the number of different rules that were matched.
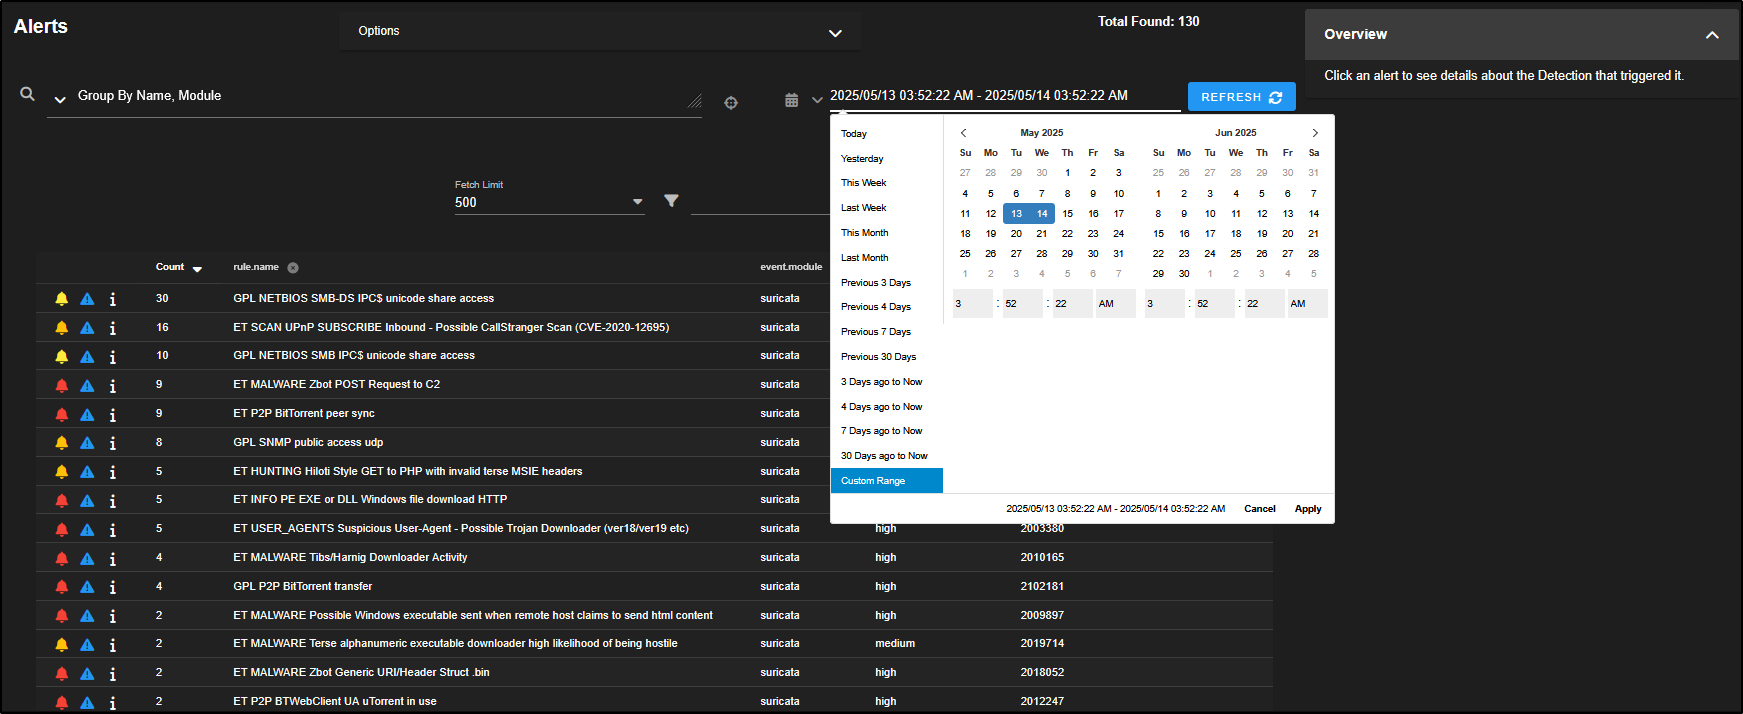
By default, the Time Selector is set to relative time, so we are looking at alerts from the past 24 hours. If needed, you can switch to a specific date and time by clicking the clock icon, but for now we will stick with the relative view.
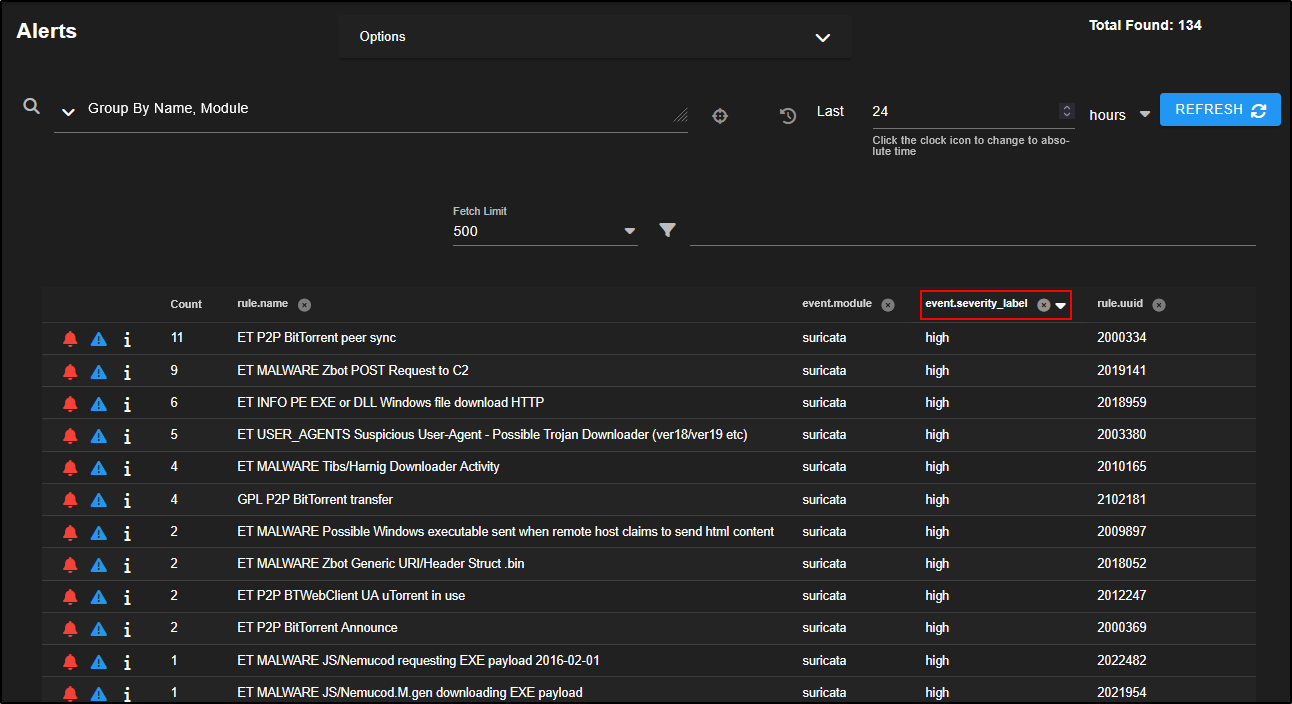
In the upper left corner, there is a query drop-down menu. By default, alerts are grouped by the rule name and the module that generated them typically from tools like Suricata, Strelka, or Sigma-based detections.
Each rule also has a severity level, which is defined in the rule itself. You can adjust this if it does not suit your environment.
To focus on high severity alerts, simply click on high, then choose Include to filter your results.
This adds the severity filter to your search query, shown as a blue tag labelled event.severity_label:"high".
You can also sort the alerts by severity level by clicking on the event.severity_level column heading.
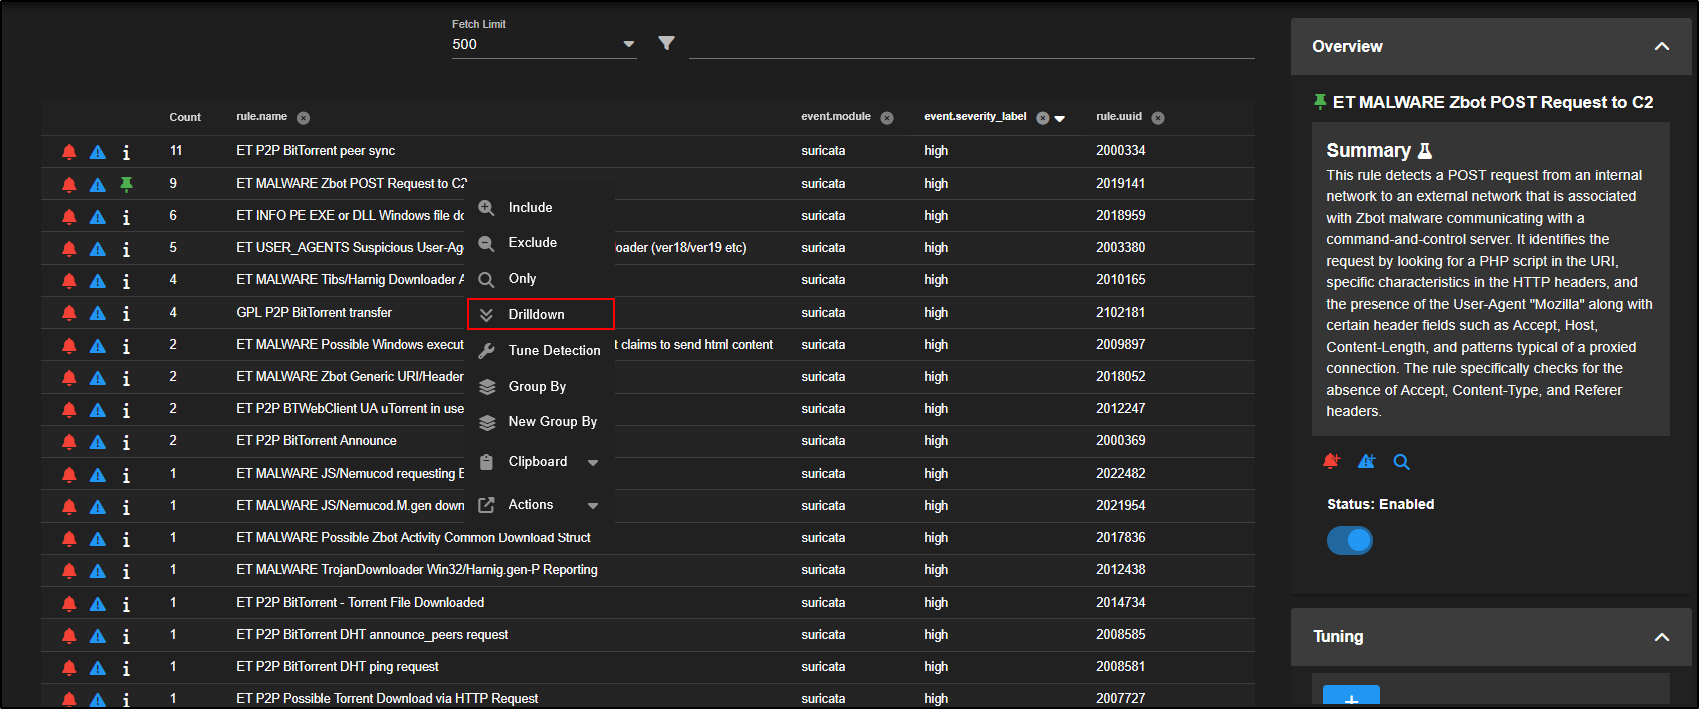
The Count column shows how many times a particular alert has been triggered.
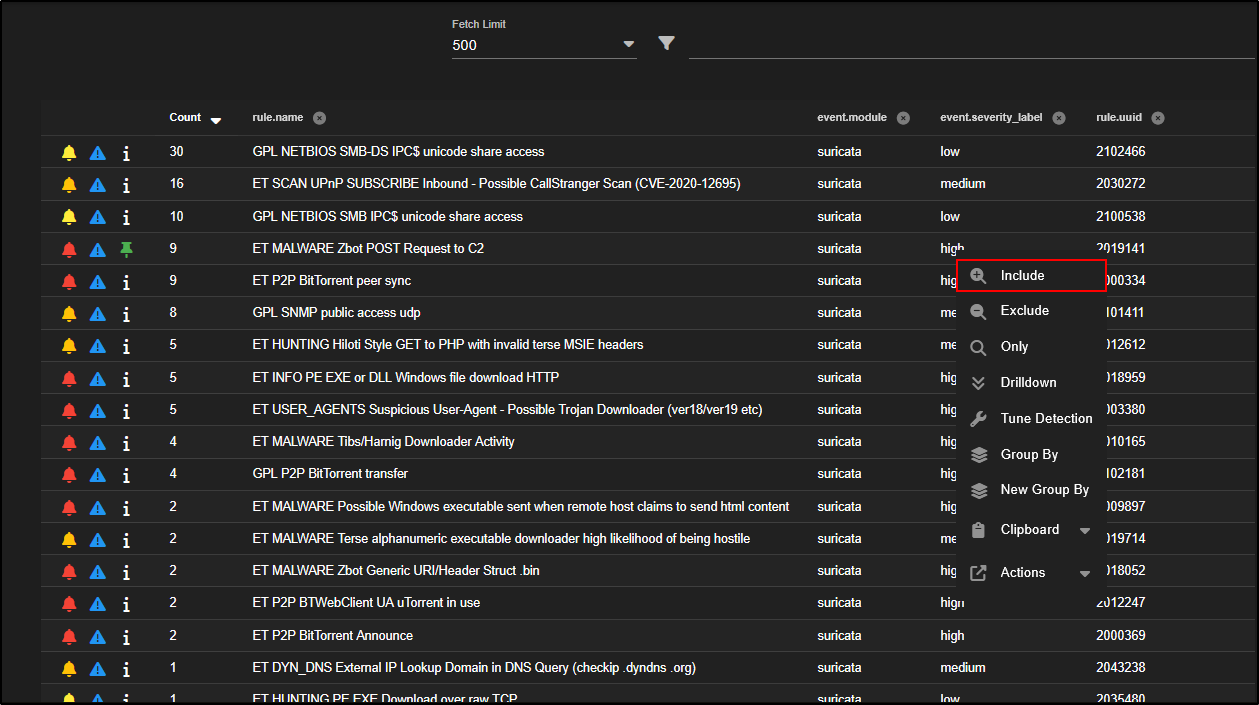
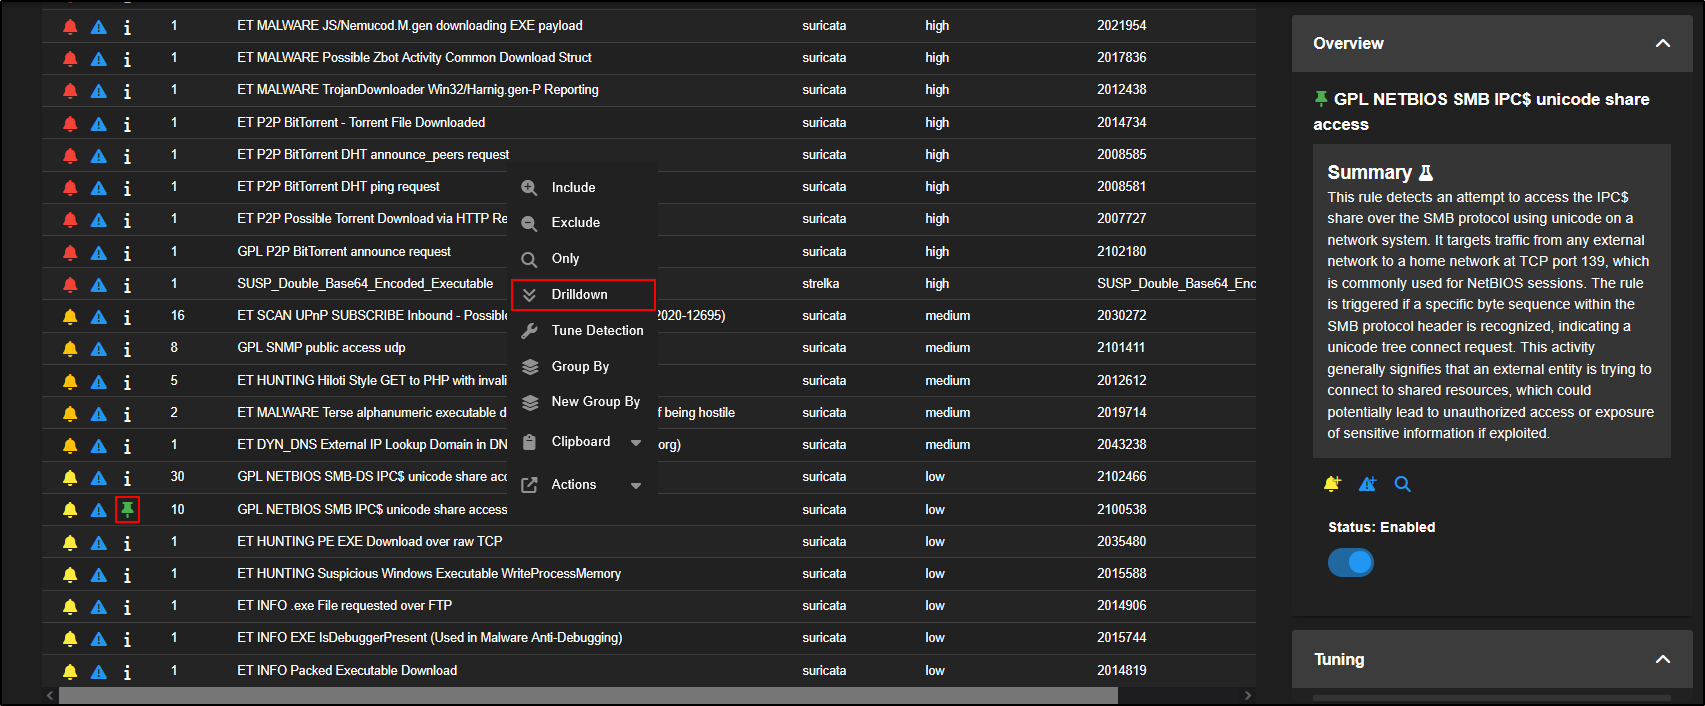
By default, alerts are grouped by rule name. If you want to see the individual alert events, click on the Count number or the rule name, then choose Drilldown.
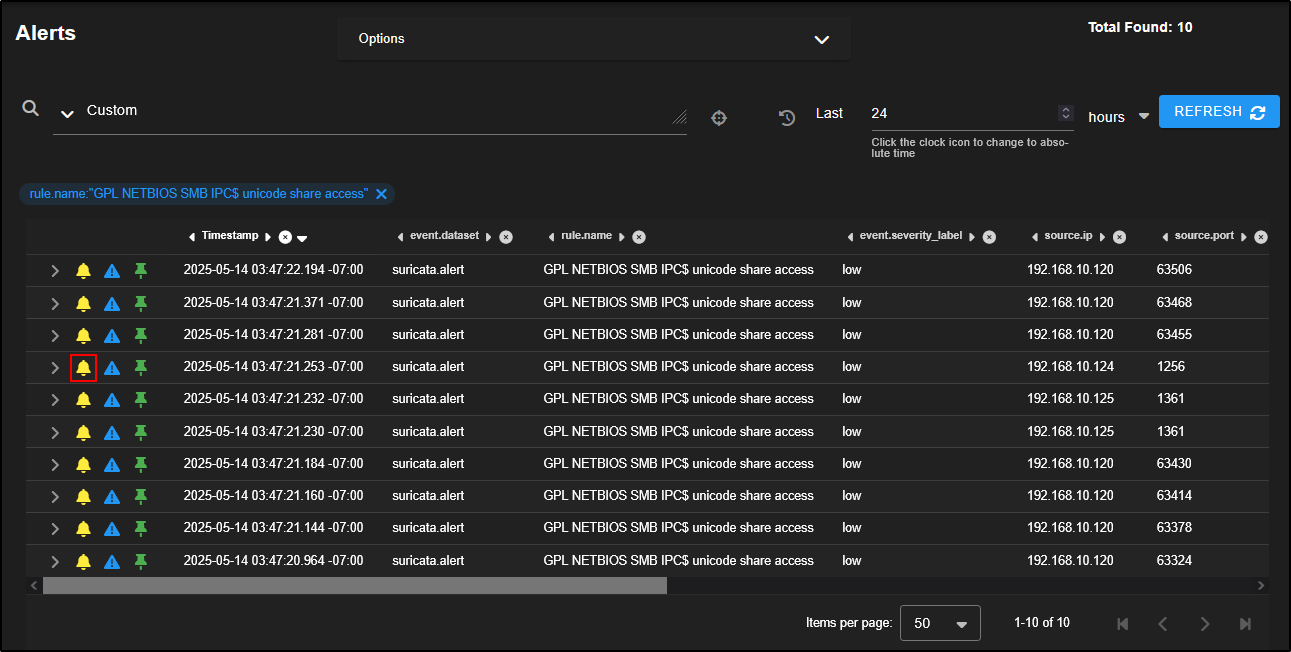
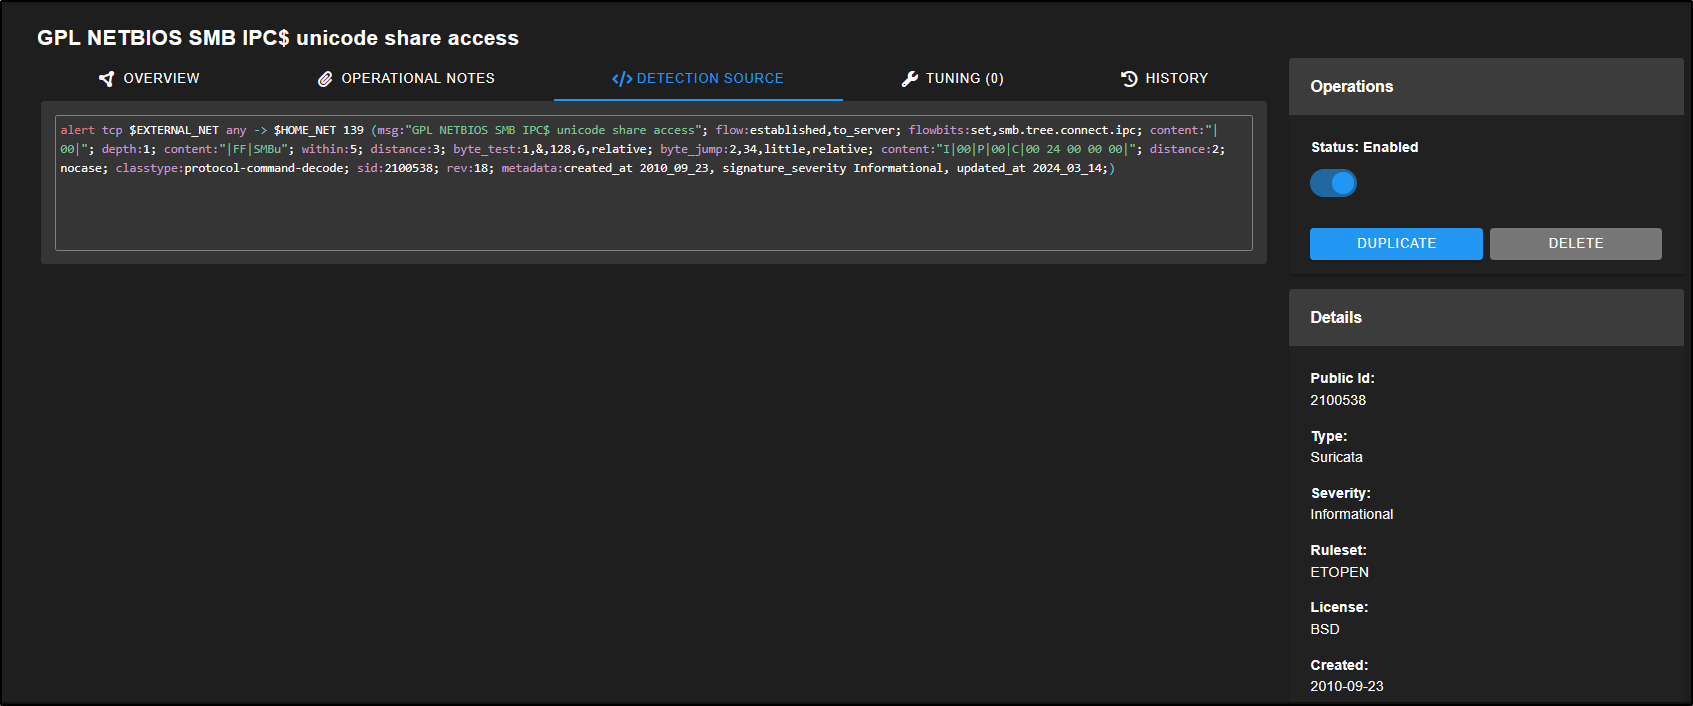
For example, click on GPL NETBIOS SMB IPC$ unicode share access and select Drilldown.
Note: Clicking the info icon next to the rule will turn it into a green pin and display a summary of what the rule is designed to detect in the side panel.
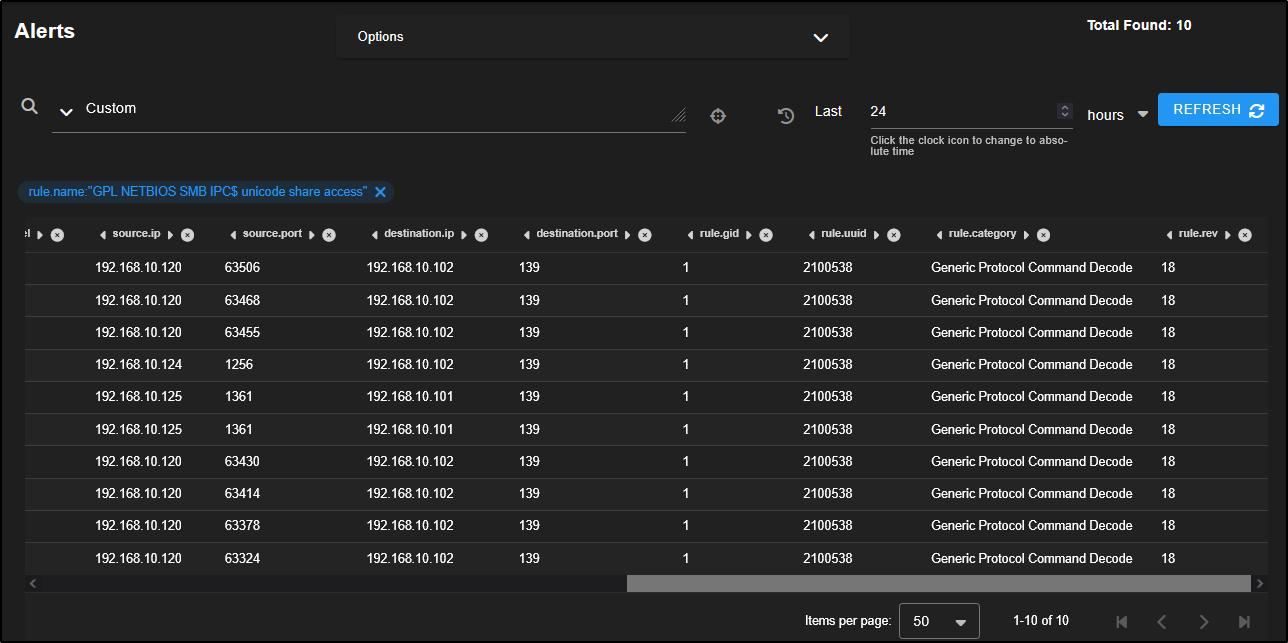
This reveals 10 individual alerts triggered by three different source IPs connecting over SMB to two different destination IPs.
When you see activity like this, it’s worth investigating further to determine whether the traffic is legitimate or potentially malicious.

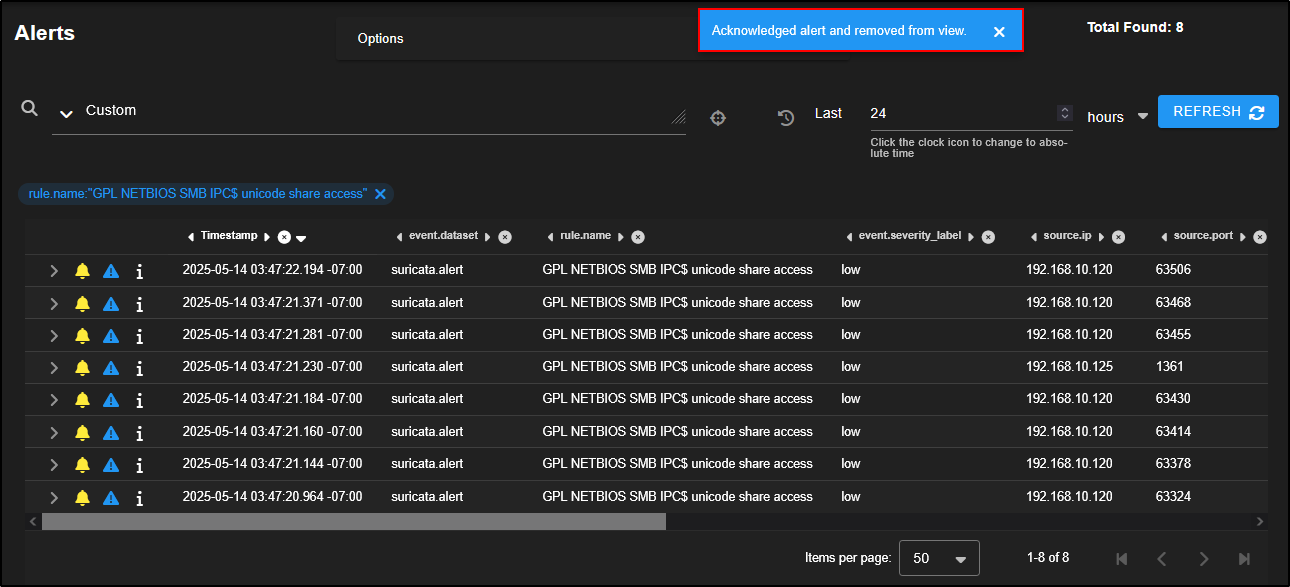
If the traffic is known to be safe (i.e. a false positive), you can make a note of it for future alert tuning, and then acknowledge the alerts by clicking the bell icon.
This will remove the alerts from the main queue but they are not deleted, just marked as reviewed.
You can also fine-tune how the rule behaves by clicking on the rule name and selecting Tune Detection from the menu.
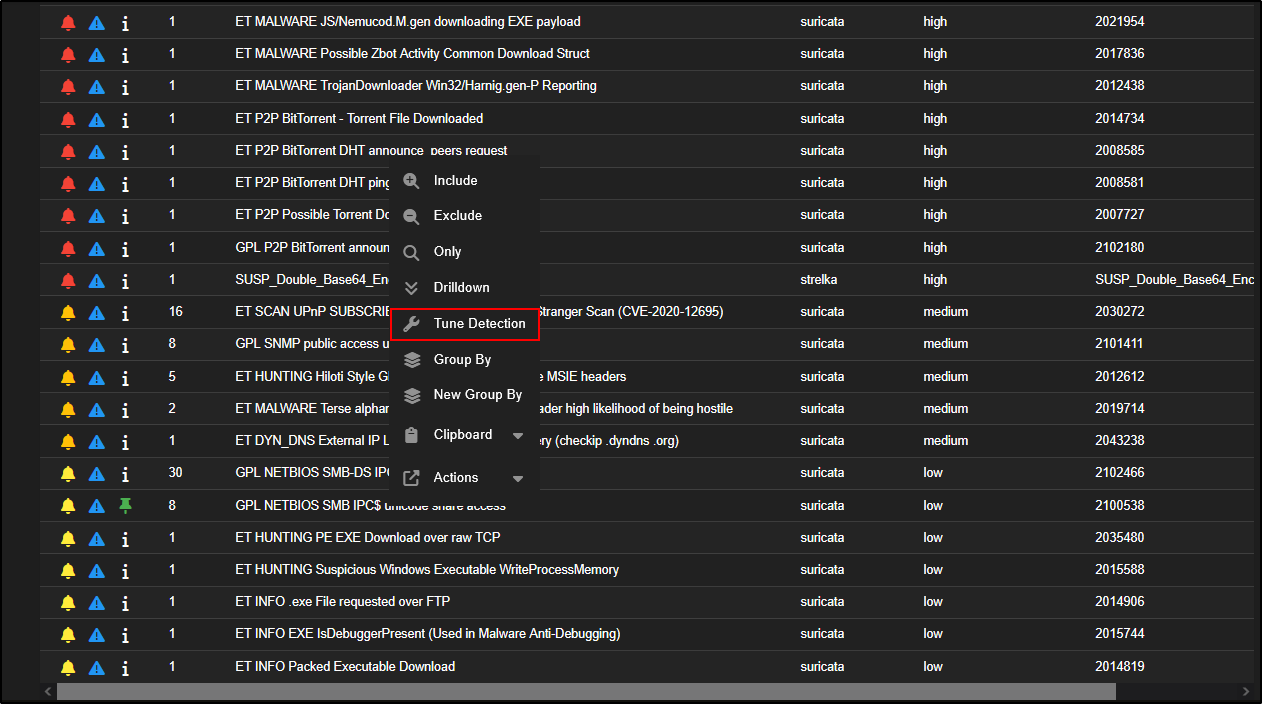
This opens the Tune Detection page, where you can either enable or disable the rule, or adjust it to better fit your environment.
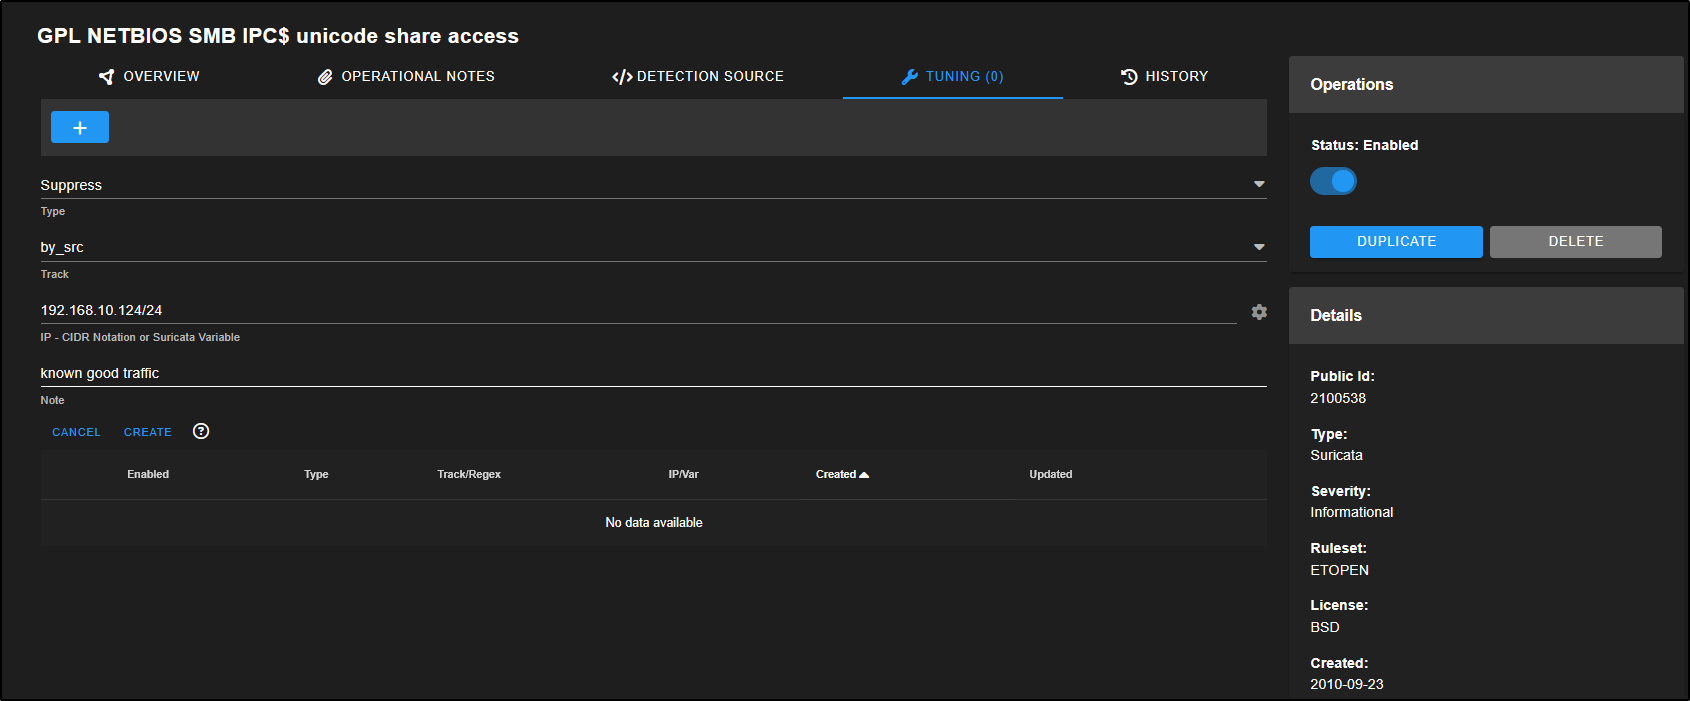
For example, to suppress alerts from a trusted source:
- Click the + icon
- Set Type to Suppress
- Set Track to by_src
- Enter the IP in CIDR format:
192.168.10.124/24 - Add a note like known good traffic
This helps reduce noise from alerts you’ve already verified as safe.
You can also edit the rule directly by going to the Detection Source section. This gives you access to the full rule definition, allowing for more advanced customisation if needed.
To view alerts you’ve previously acknowledged, return to the Alerts tab, click on Options, then select Acknowledged. This will display alerts you have marked as reviewed or false positives.
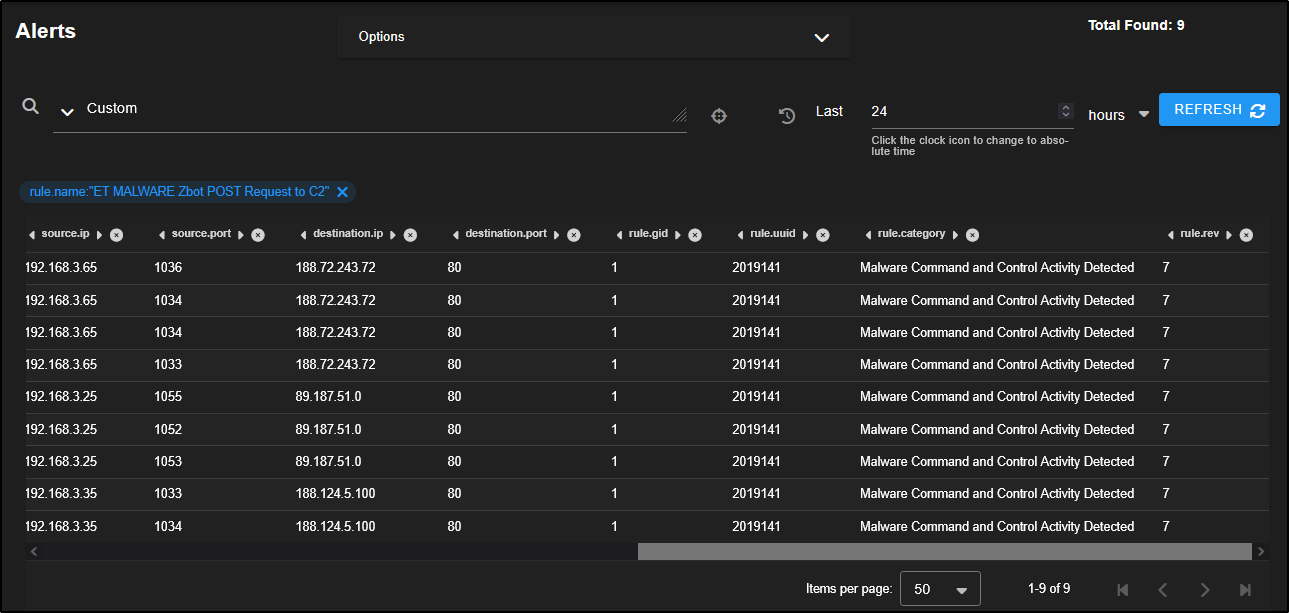
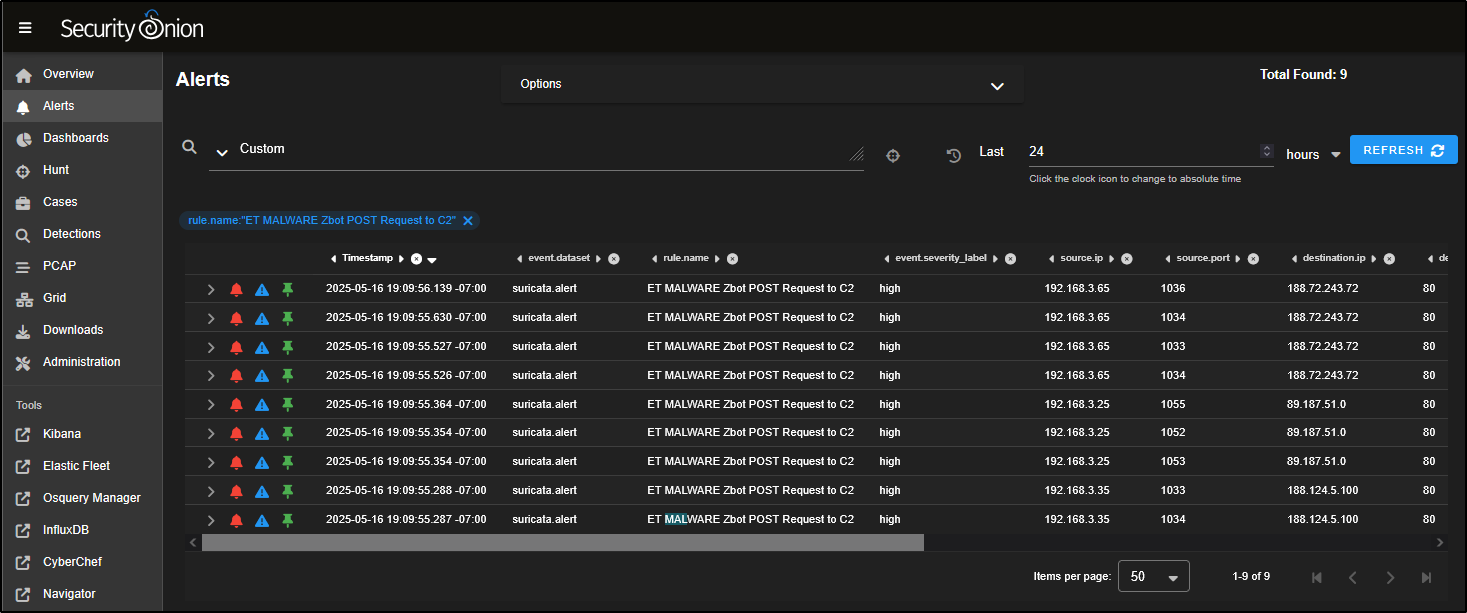
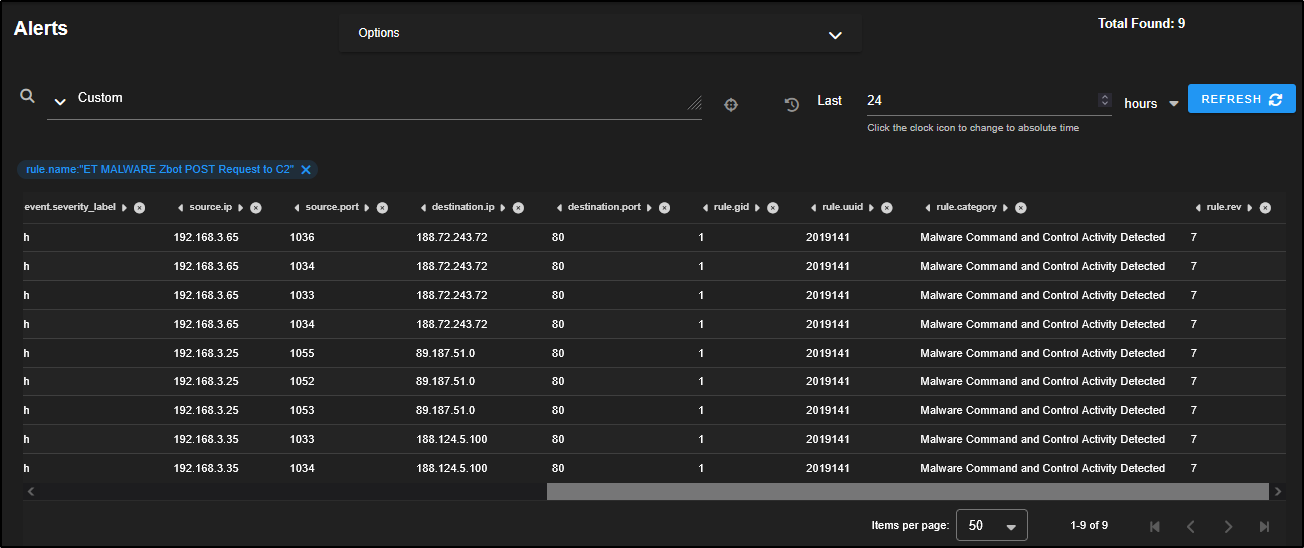
Now let’s focus on alerts that are more likely to indicate real threats. For example, drill down into the rule ET MALWARE Zbot POST Request to C2 to investigate activity that may involve communication with a command-and-control server.
This reveals nine alerts involving three separate source IPs making connections to three different destination IPs over port 80 which is a common port for HTTP traffic. This pattern could suggest coordinated or suspicious activity worth further investigation.
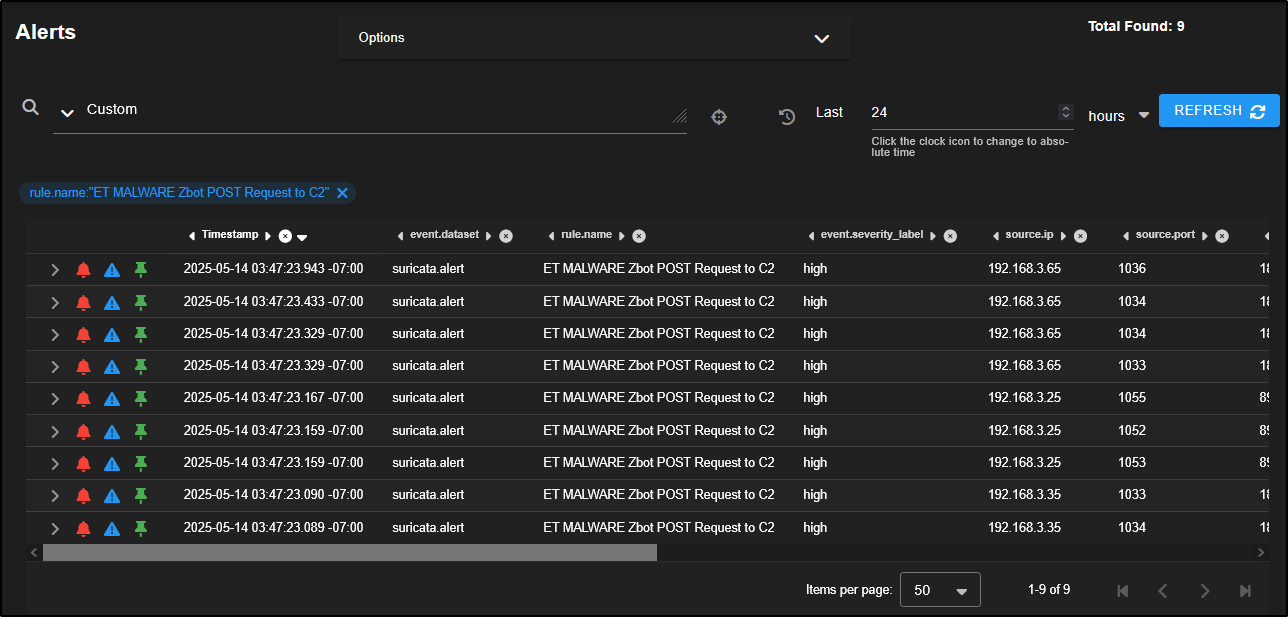
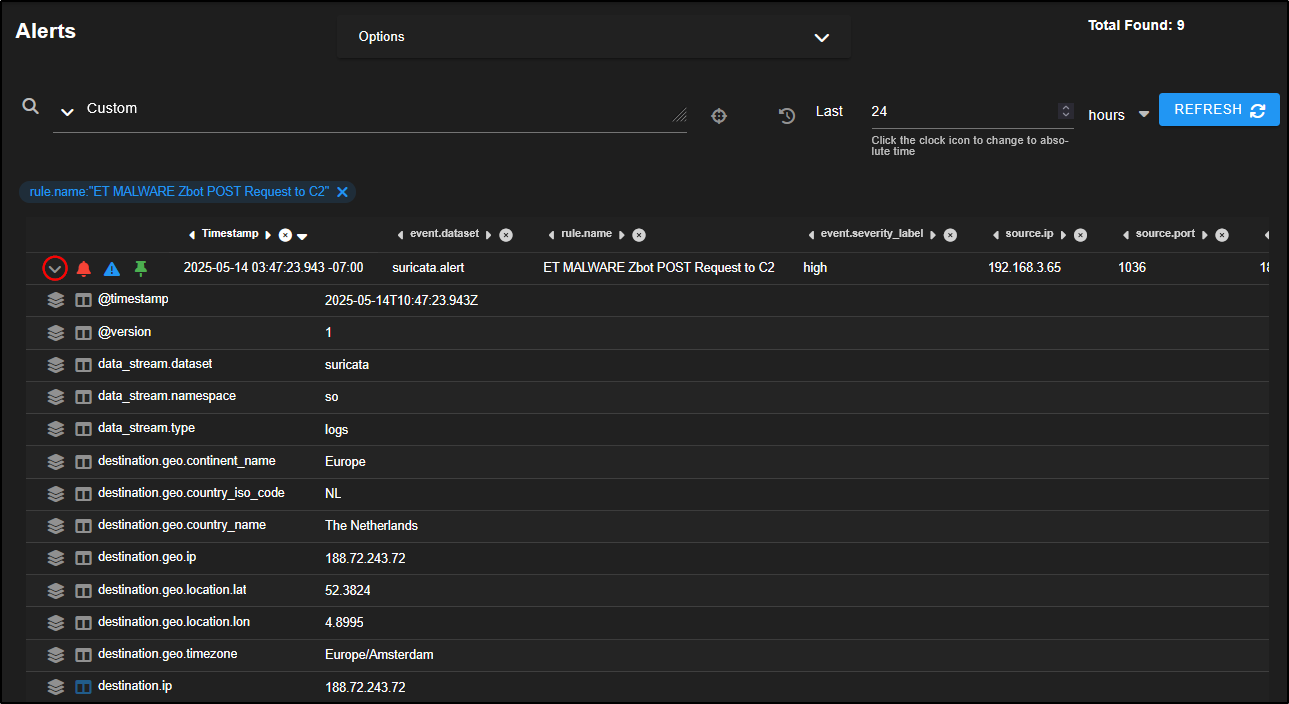
You can click to expand an individual alert for a closer look.
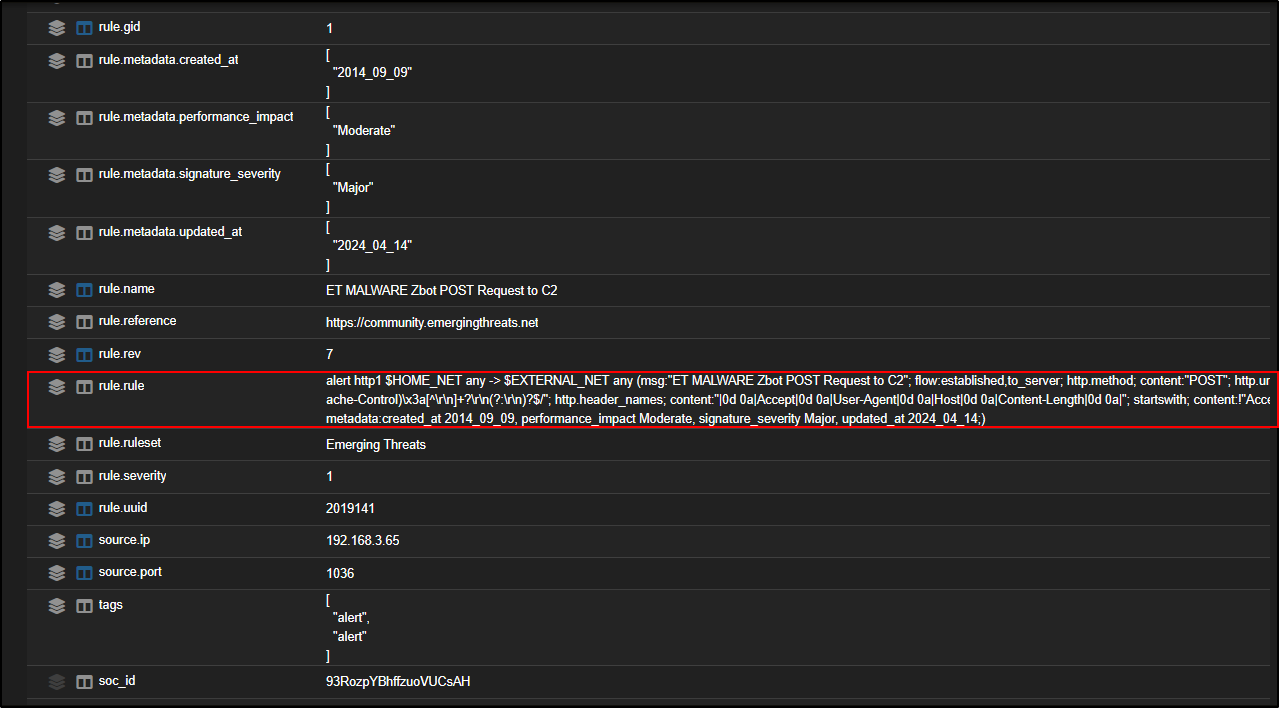
If you scroll down to the Suricata rule section (rule.rule), you will see that this alert is triggered by HTTP traffic flowing from your internal network to an external server. The rule is checking for specific HTTP headers within an established connection which is a common indicator of command-and-control activity or data exfiltration.
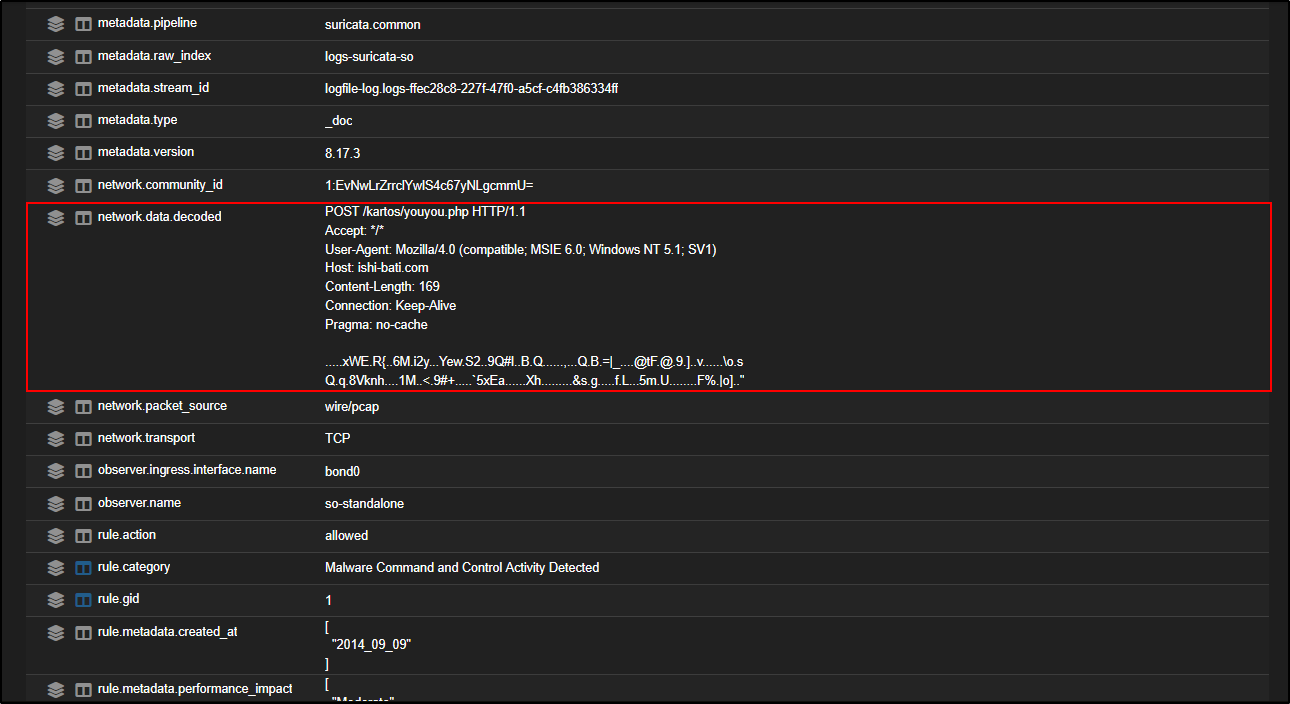
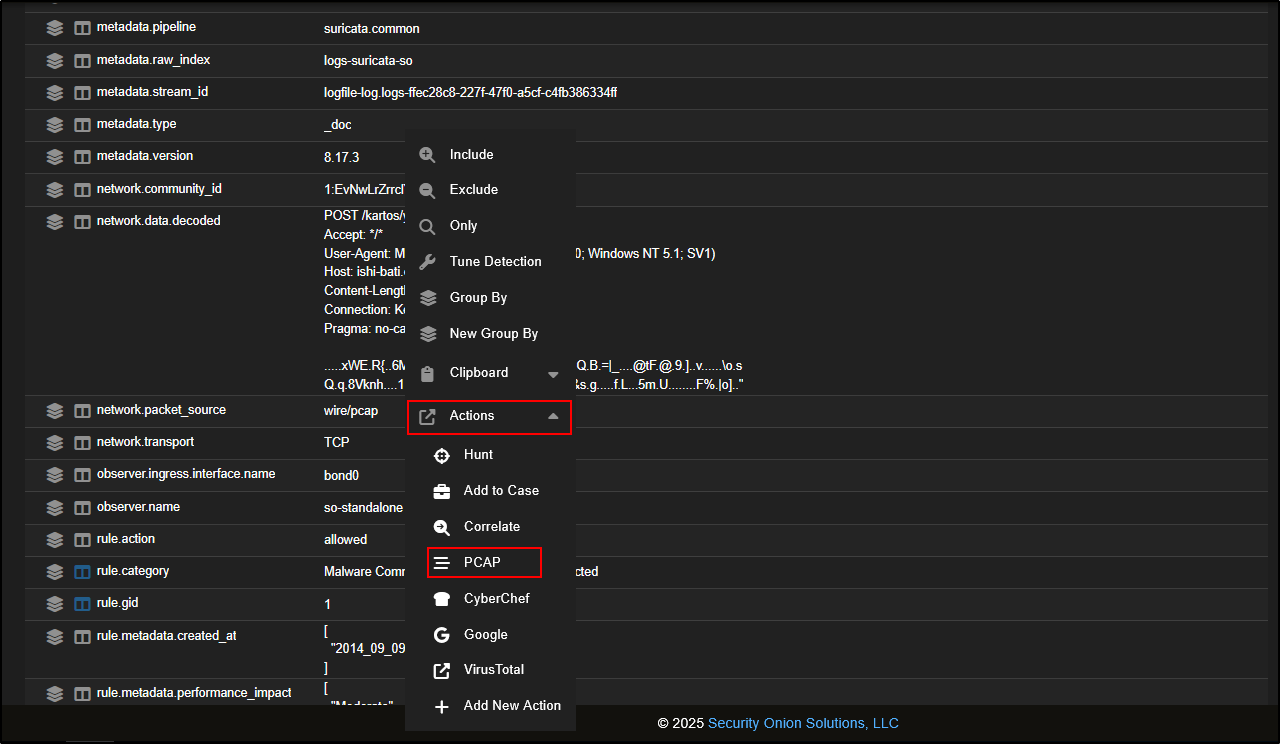
If you scroll up to the network.data.decoded section, you will see the client is making a POST request to a PHP page, using MSIE 6.0 as the User-Agent which is an outdated browser version often associated with malicious traffic.
The destination host is ishi-bati.com, which appears suspicious and may warrant further investigation.
To get more context on the alert, you can pivot into a packet capture (PCAP) from any relevant field.
For example, click on network.data.decoded, then go to Actions → PCAP. This will open the full packet capture related to the alert, letting you analyse the actual network traffic involved.
Reviewing the PCAP, we can see a clear connection between the internal host and an external web server, with what appears to be encoded data being exchanged.
This kind of traffic is unusual and could indicate command-and-control (C2) communication. This definitely looks like something that needs more investigation.
Head back to the Alerts tab, locate the alert, select it, and then click the triangle icon to escalate it to a new case. This begins formal tracking of your investigation within the SOC’s case management system.
Go to the Cases tab in the SOC web interface. You will see a new case has been created, named after the alert you escalated.
This case acts as a central place to track your investigation, record notes, and link to other evidence found during your threat hunting.
Click the binoculars icon to open the case and view its details.
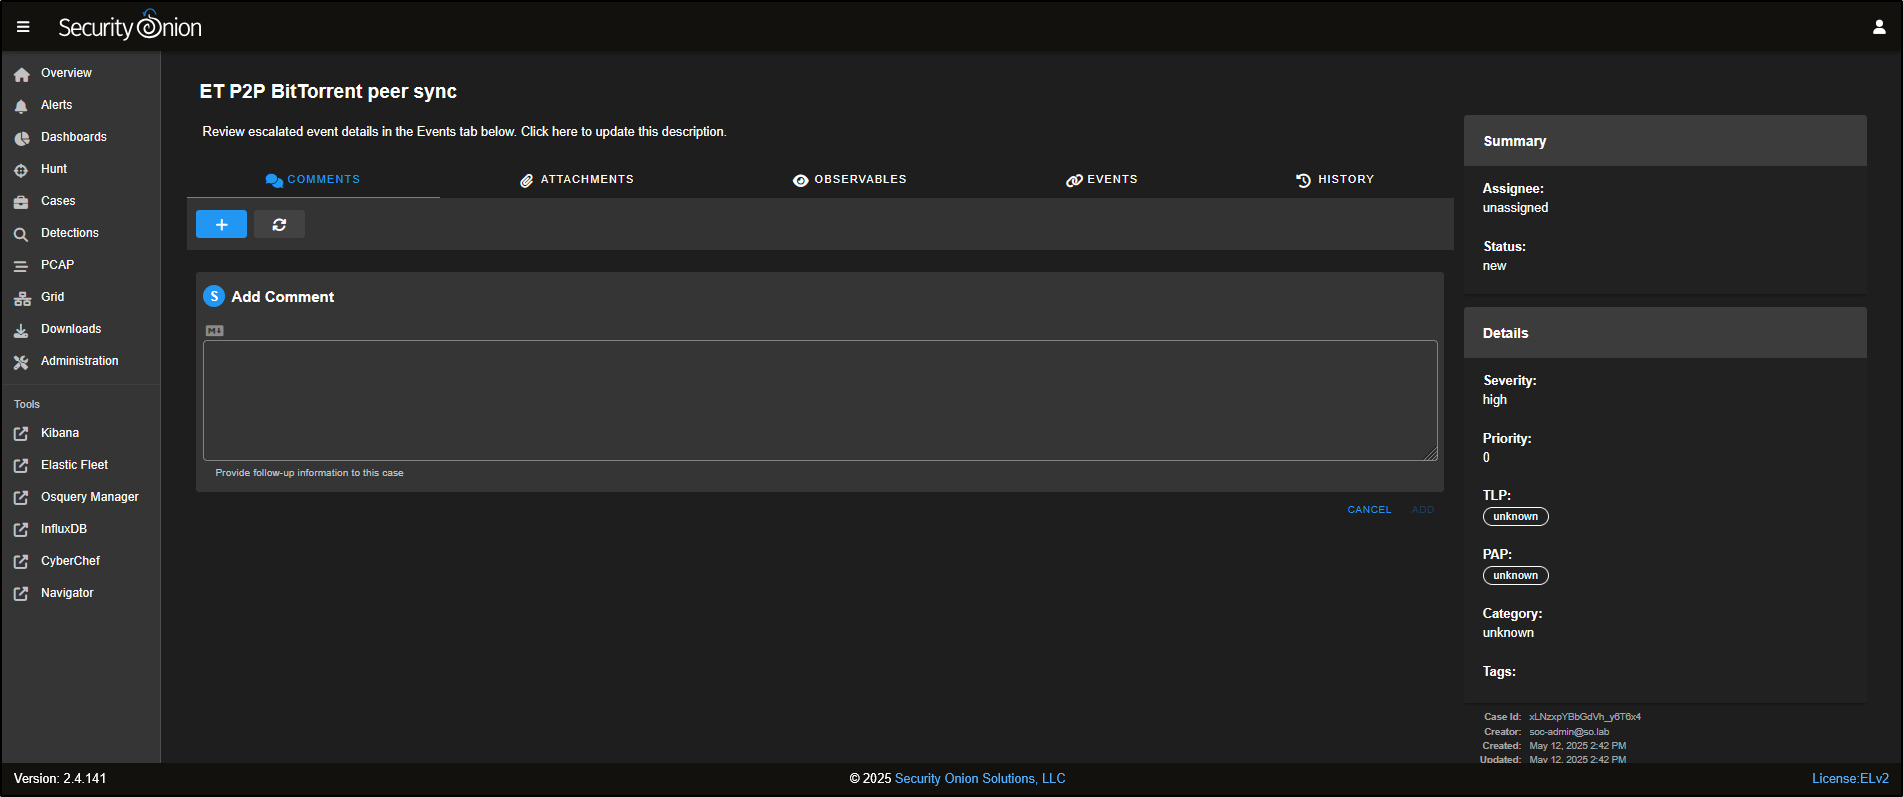
On the right-hand side of the case view, you will find metadata fields to help manage the investigation.
If you are working in a team, use the Assignee drop-down to allocate the case to a specific analyst. Change the Status from New to In Progress to reflect that the investigation has started.
You can also set the case’s Severity and Priority, apply a TLP (Traffic Light Protocol) or PAP (Permissible Action Protocol) level for information sharing, and use Category and Tags to group related cases or highlight key findings.
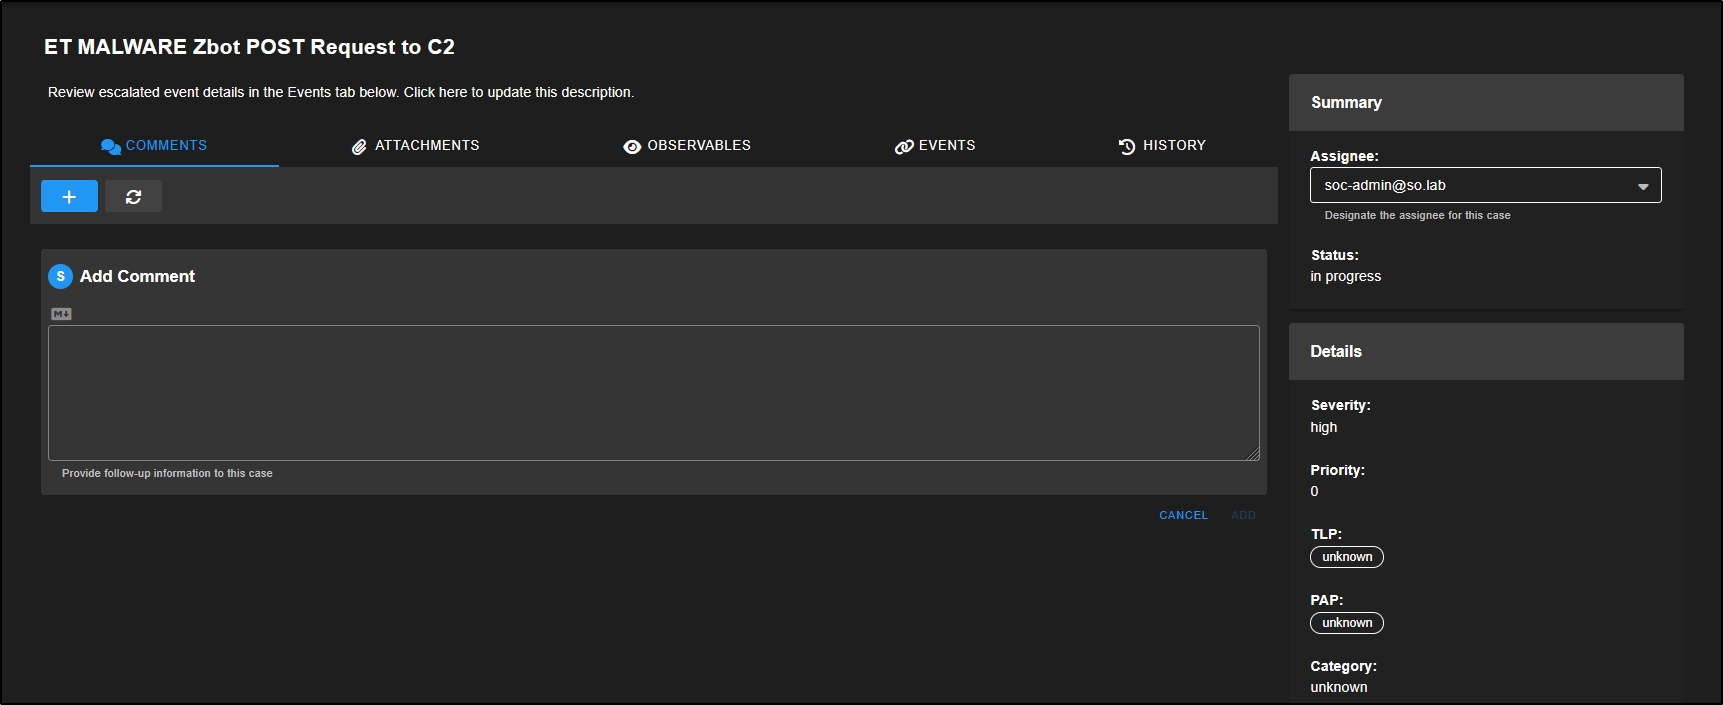
At the top of the case window, you will see several tabs. The Comments tab lets you add notes using Markdown formatting. Each comment is automatically tagged with the author’s username and a timestamp.
For example, you might add the following note:
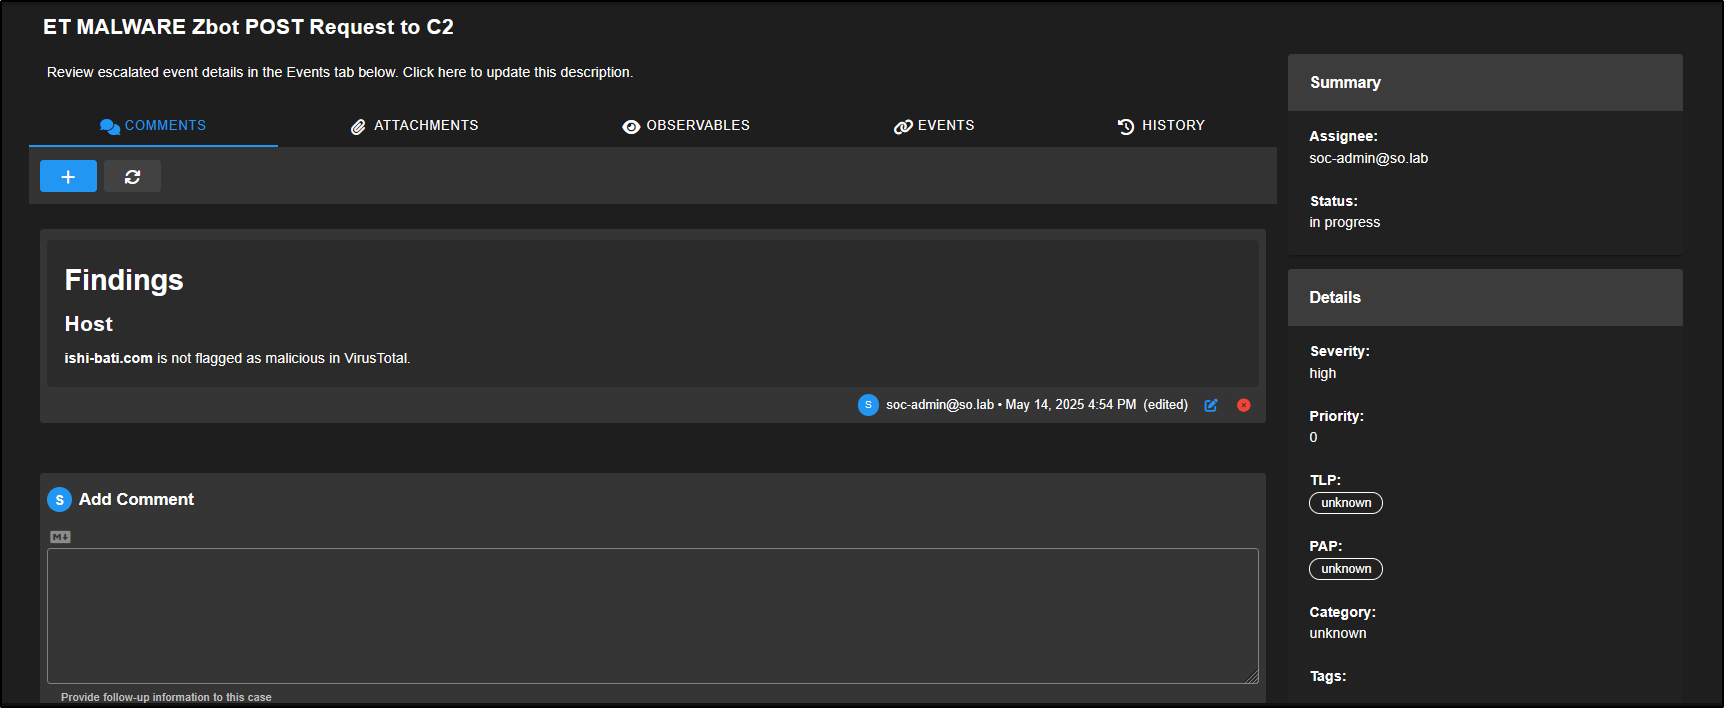
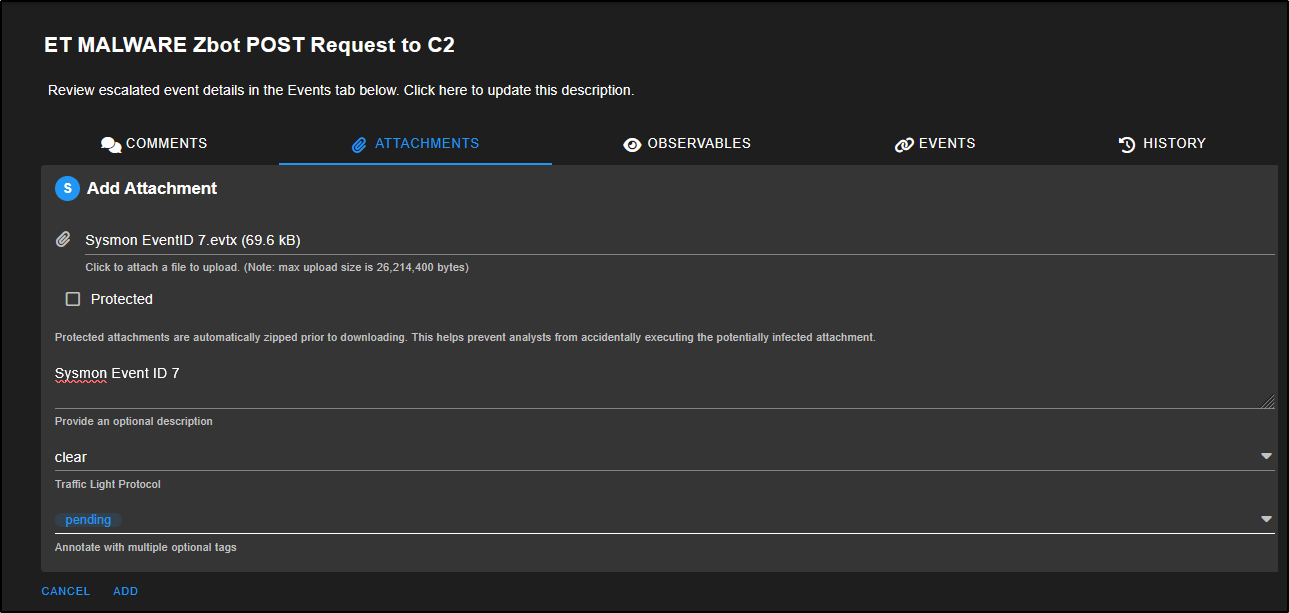
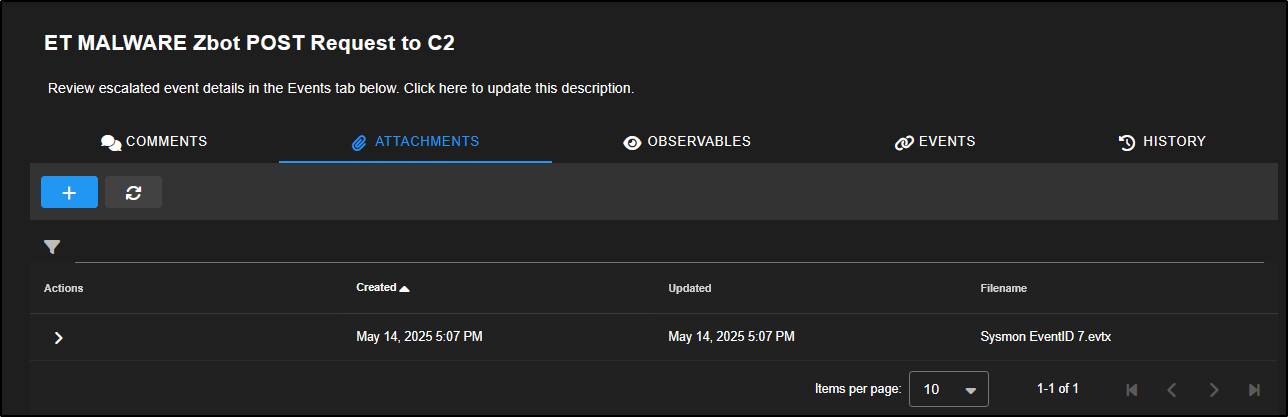
The Attachments tab lets you upload files or artefacts related to the investigation. For instance, you can attach relevant Sysmon logs, Windows Event Logs (EVTX files), or any other evidence that supports your analysis of the alert.
Observables are specific indicators such as IP addresses, hashes, or domains that you identify during an investigation.
In Security Onion, some observables like source and destination IPs are automatically extracted from alerts and added to the case for easier tracking and correlation.
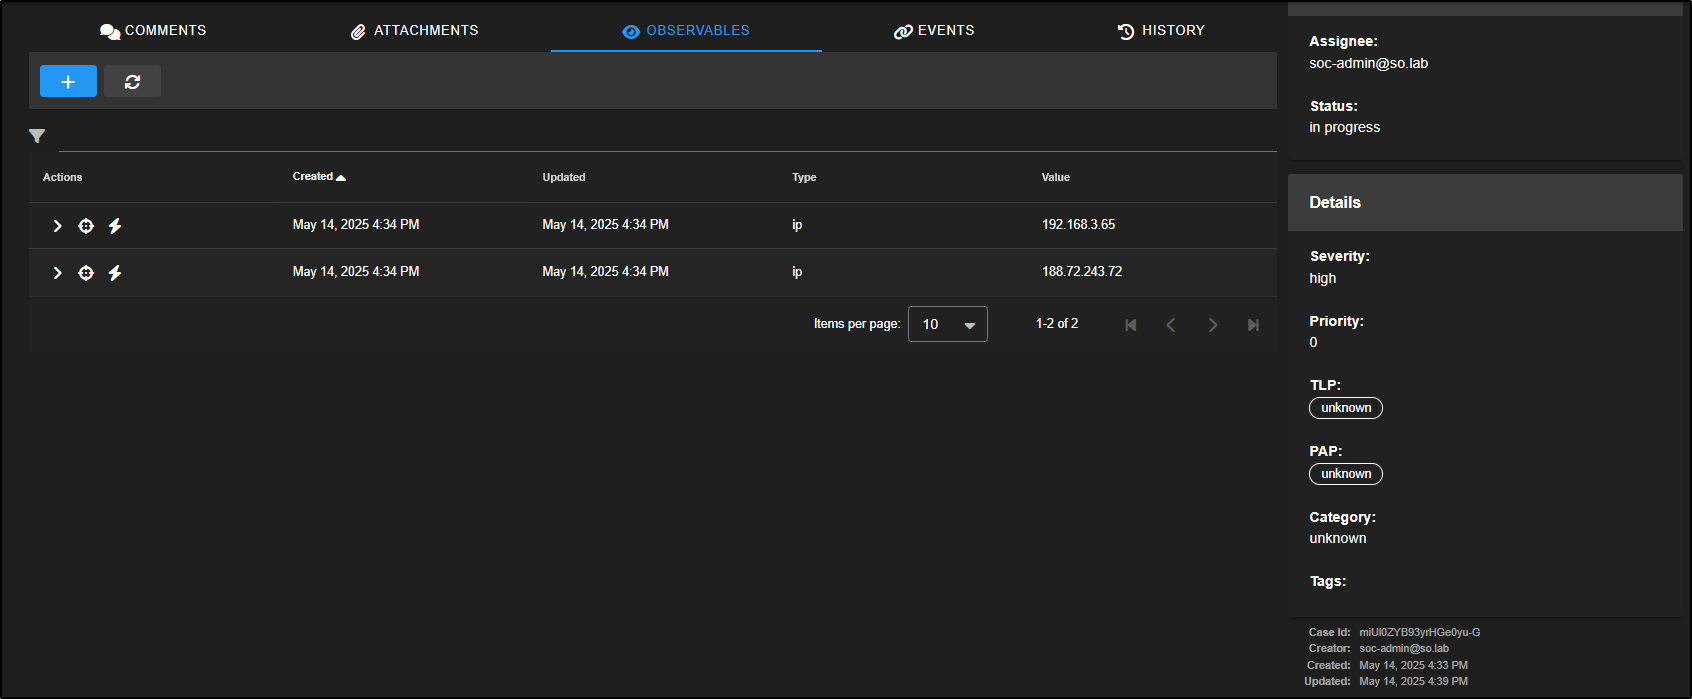
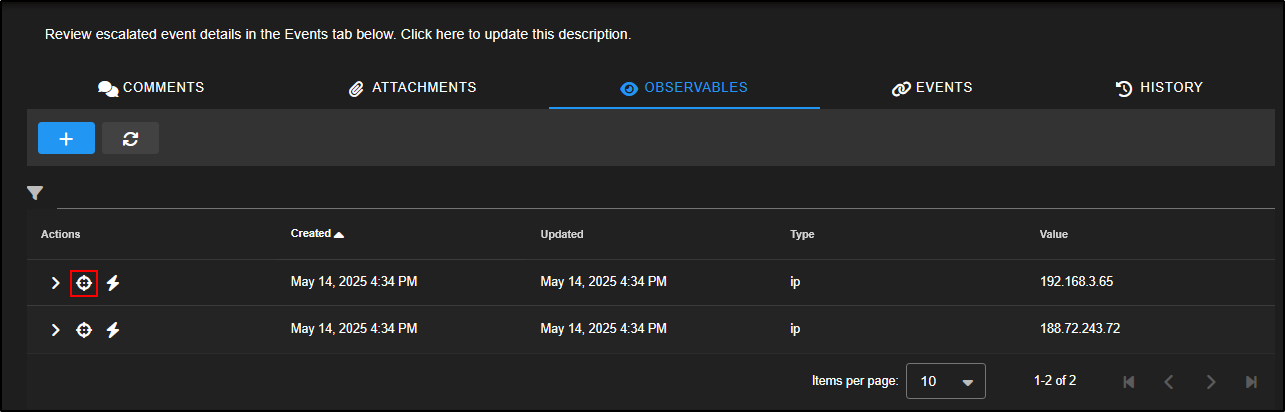
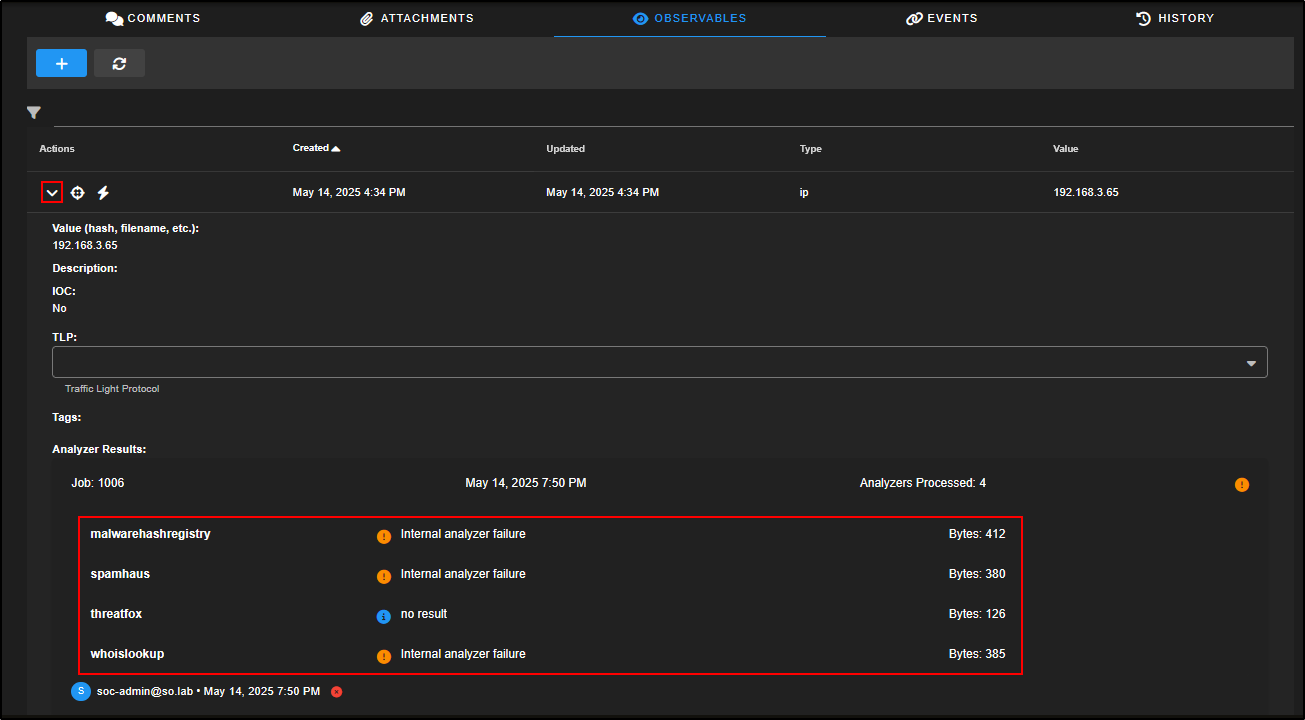
Under the Actions column for each observable, you will find a few icons.
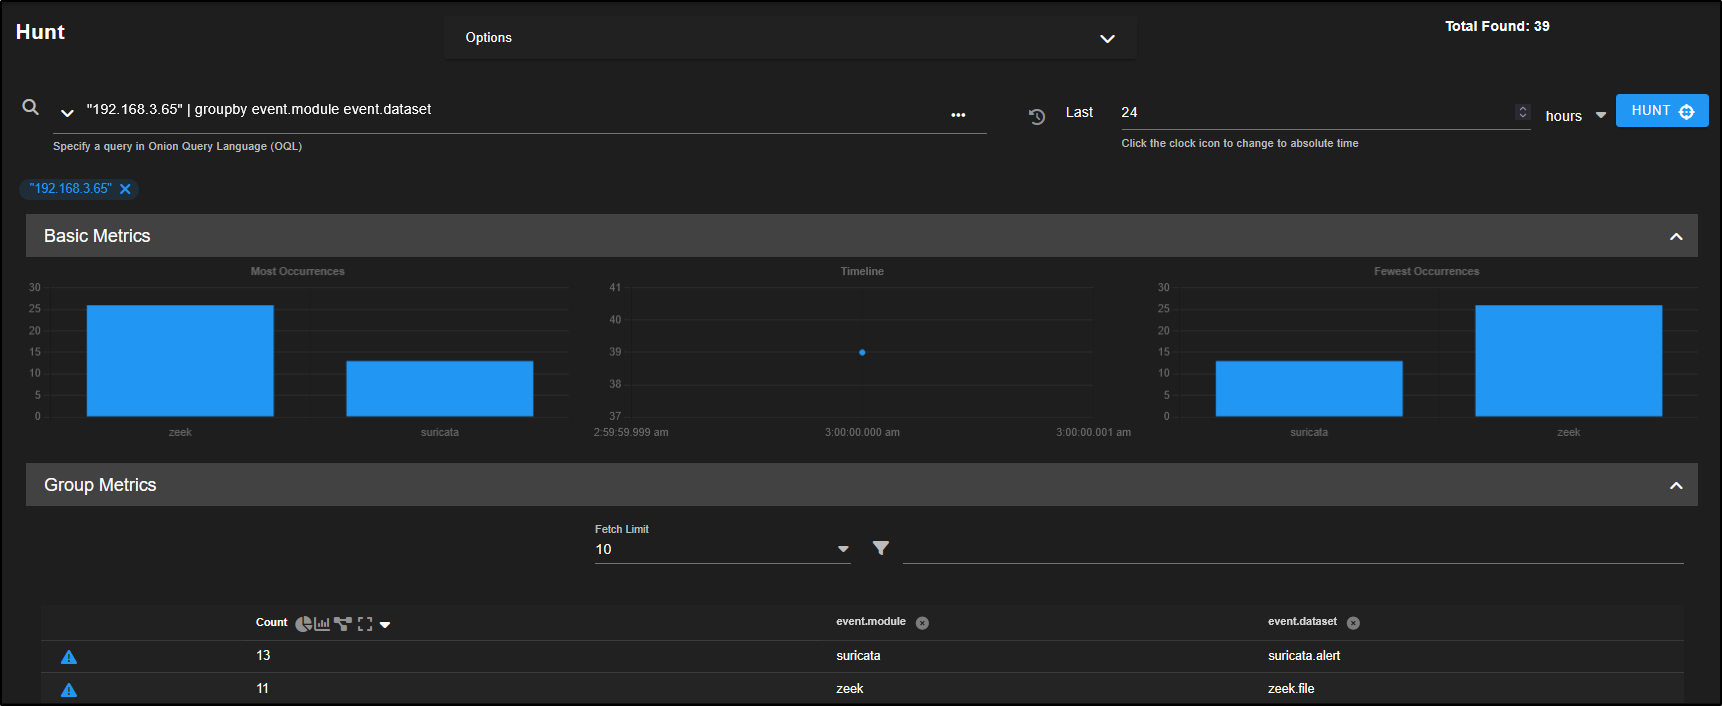
Clicking the crosshair icon will launch a new Hunt session focused on that specific observable. For example, selecting the crosshair next to the first entry will open a hunt centred around the IP address 192.168.3.65, allowing you to dig deeper into related activity.
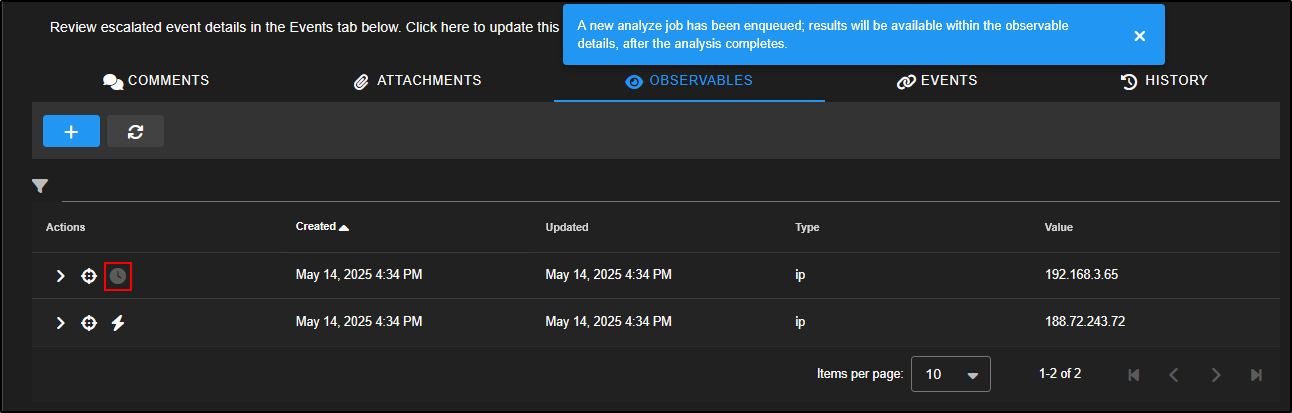
The lightning bolt icon runs any analysers you have set up for that type of data.
For example, clicking the lightning bolt next to the first observable will trigger analysis on that item. You can then expand the observable to view the results.
Note: This feature requires internal analysers to be properly configured in your Security Onion setup.
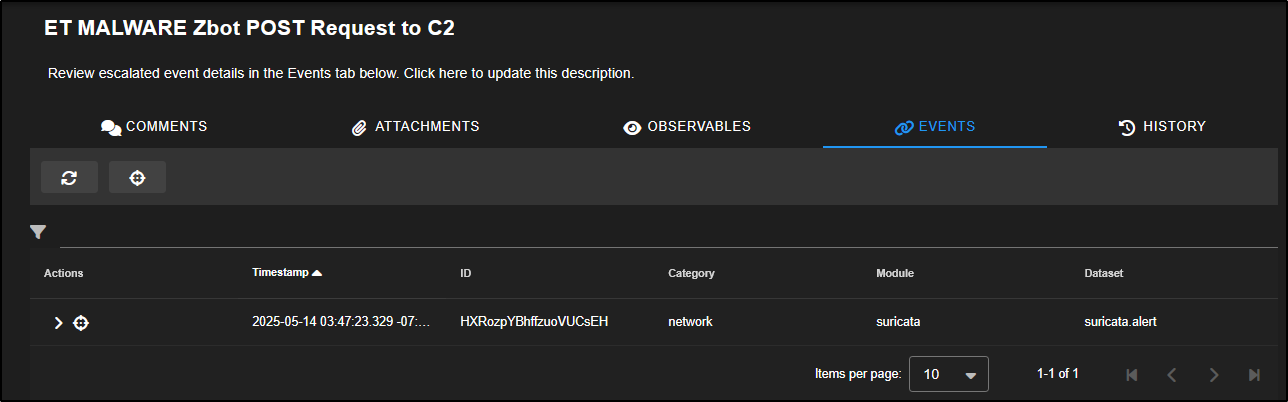
The Events tab displays all events that have been escalated and formally linked to the case. This helps you keep track of the specific alerts and logs you are investigating as part of that case.
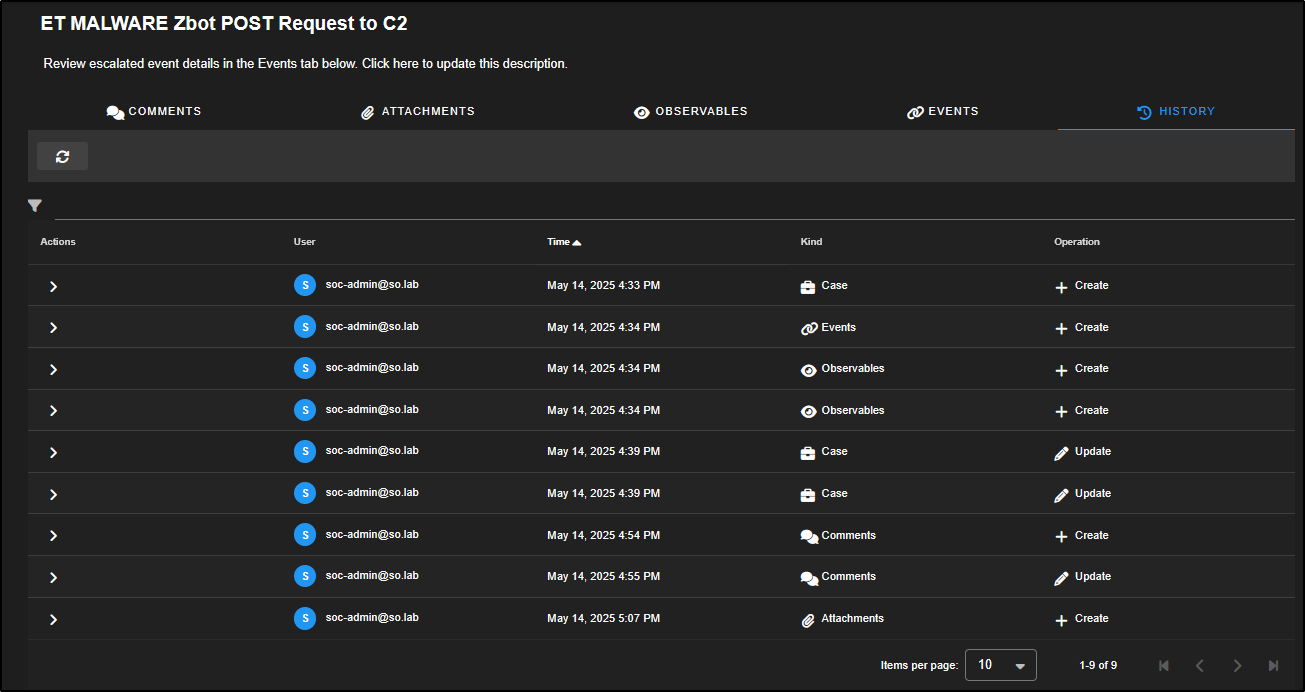
The History tab acts as an audit log for the case. It records every action taken such as items being added, changed, or deleted along with the username of the person who made the change and a timestamp for accountability.
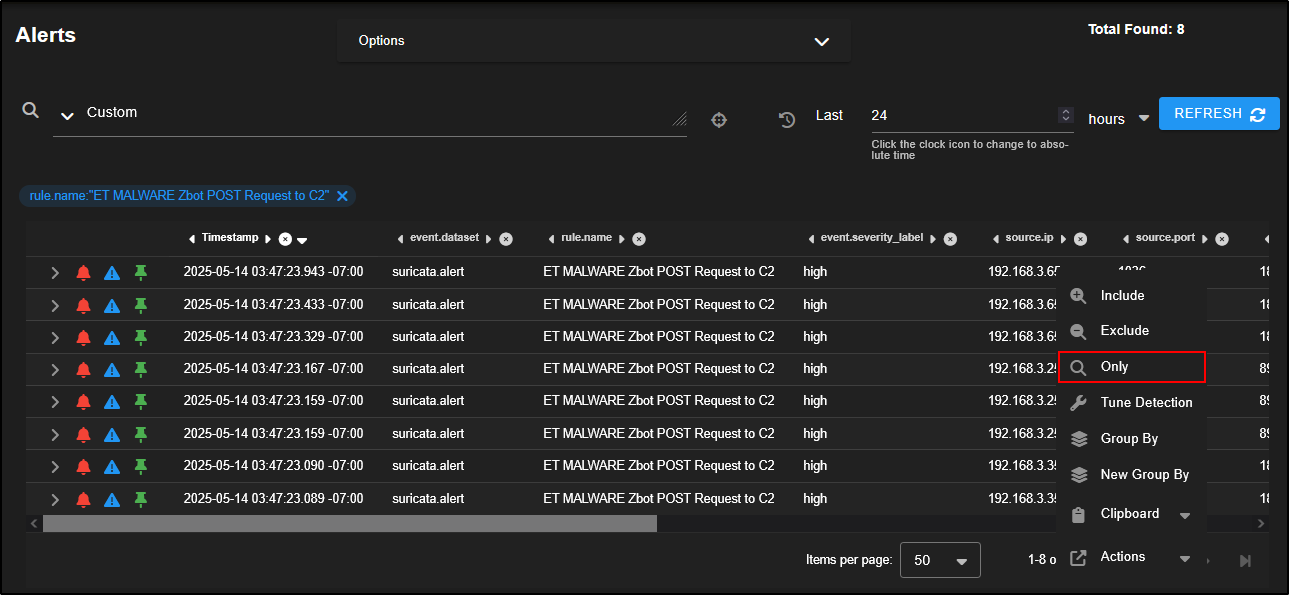
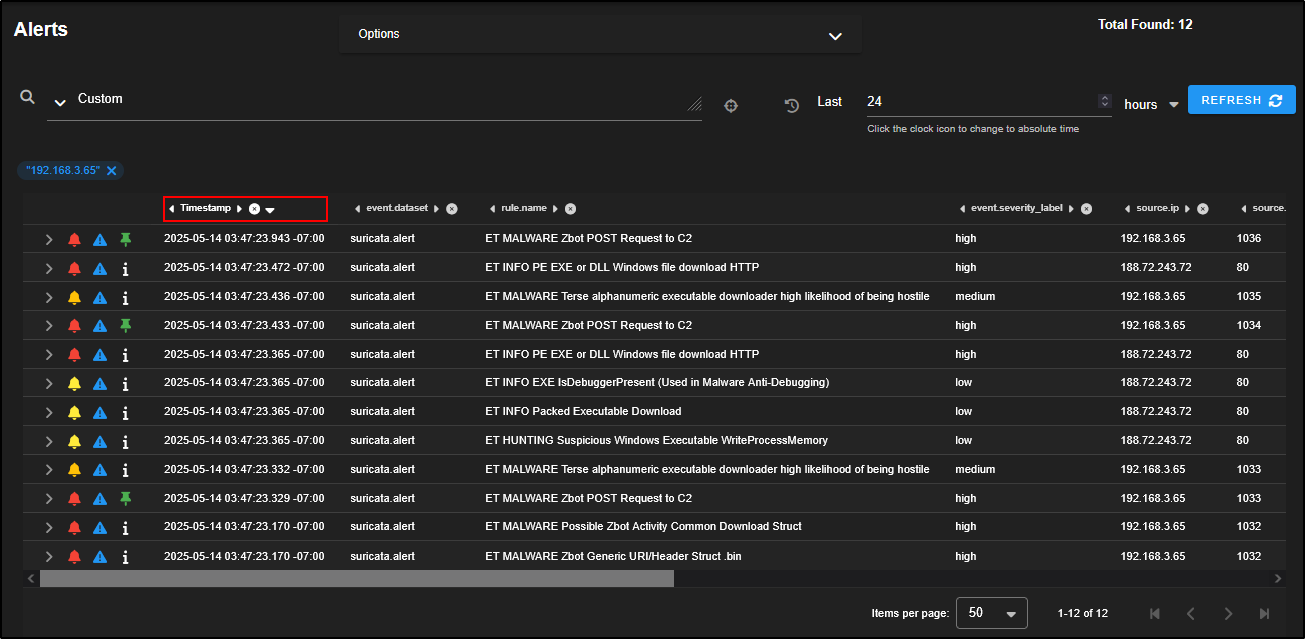
Let’s revisit the ET MALWARE Zbot POST Request to C2 alerts and narrow our focus to a specific host.
Click on the source IP 192.168.3.65 and select Only. This will filter the alerts to show only those involving that IP address, helping us investigate its activity in more detail.
Click on the Timestamp column to sort the alerts chronologically.
From the timeline, it appears there was Zbot download activity, followed by a C2 POST request, and then an EXE file download over HTTP. This ****sequence strongly suggests malware infection and command-and-control behaviour.
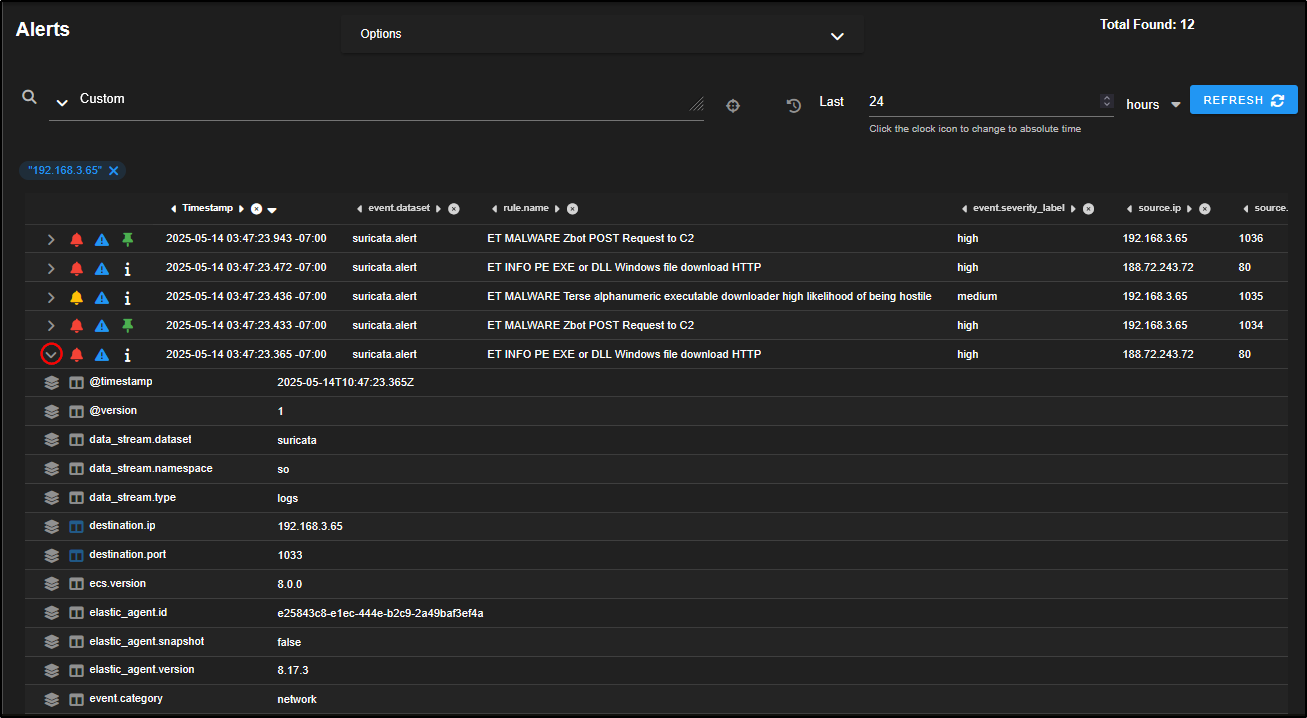
Expand the alert titled ET INFO PE EXE or DLL Windows file download HTTP to view the full details.
This rule is triggered when a Windows executable (.exe) or DLL file is downloaded over HTTP, which is often a red flag especially when it happens outside normal software update mechanisms.
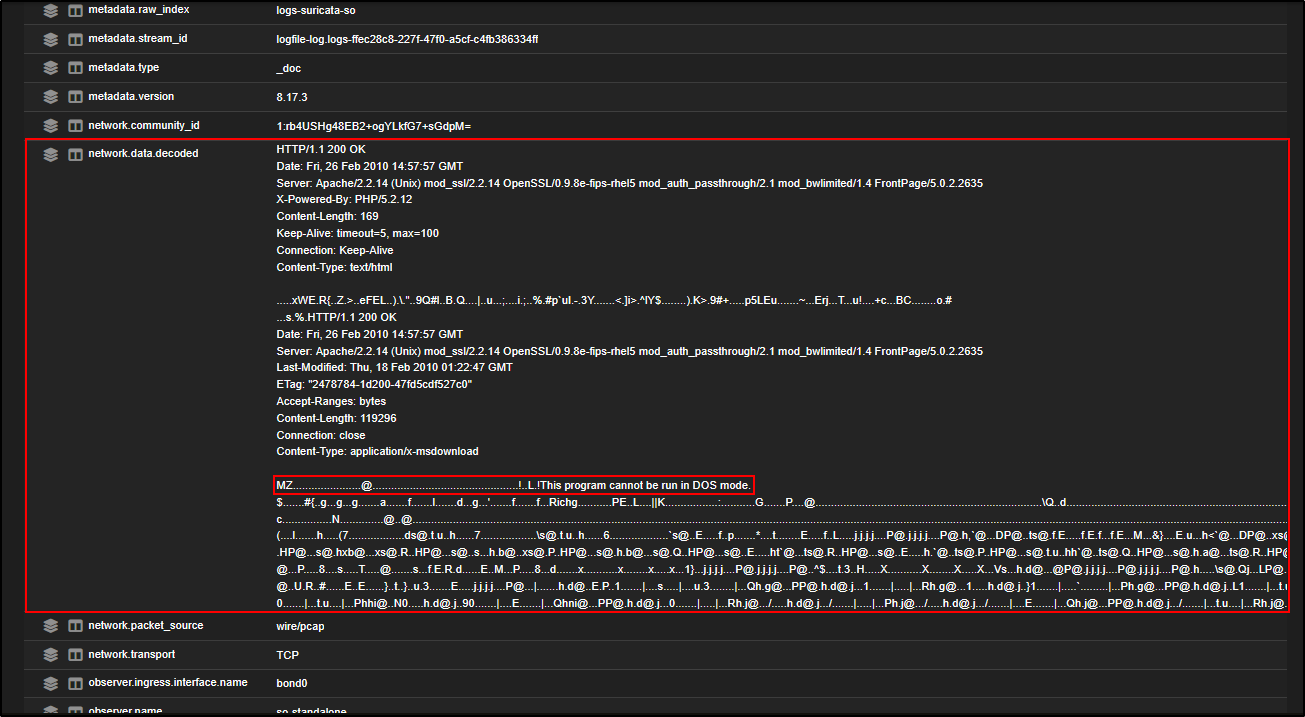
Scrolling down to the network.data.decoded field, we can see clear signs that a Windows executable is being downloaded. The presence of the MZ header and the string “This program cannot be run in DOS mode” are strong indicators of a PE (Portable Executable) file.
This confirms that a .exe file was likely transferred over HTTP.
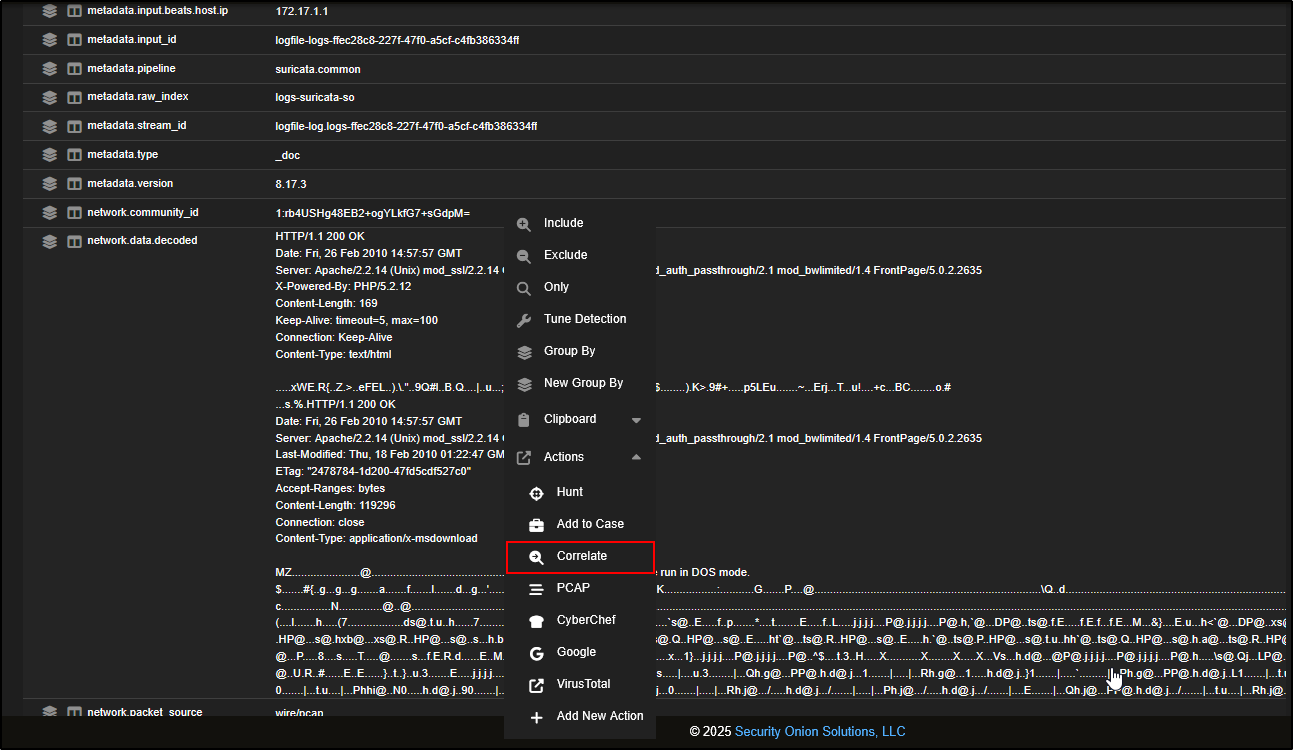
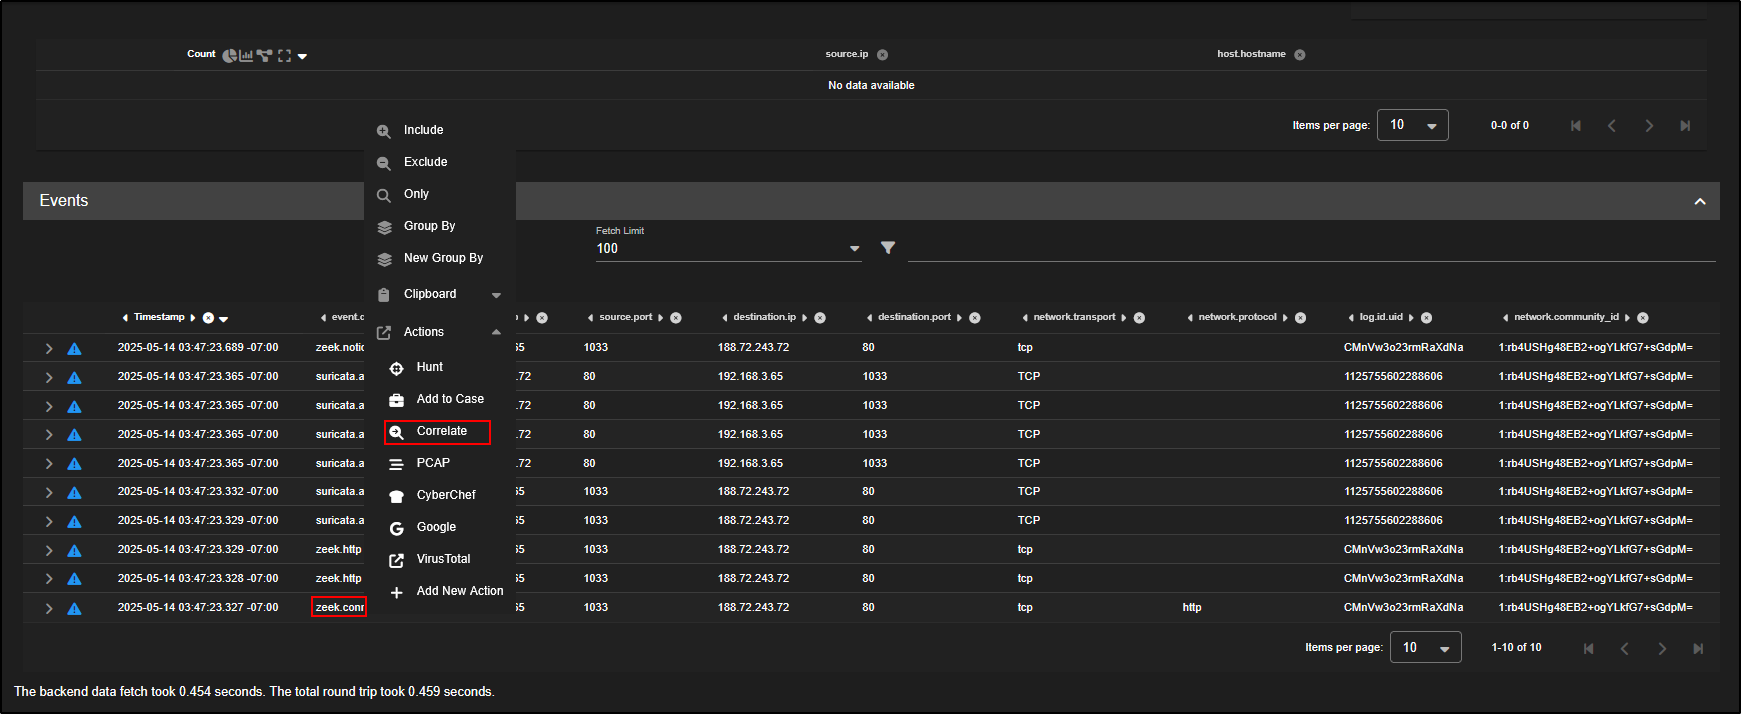
To view all logs associated with this specific network flow, you can pivot using the community_id which is a unique hash that Security Onion assigns to each flow, based on the source/destination IPs, ports, and protocol (e.g. TCP or UDP). This makes it easy to group and investigate related activity across different log types.
Click on network.data.decoded, then choose Correlate. This will open a Hunt view showing all logs linked to that same network flow.
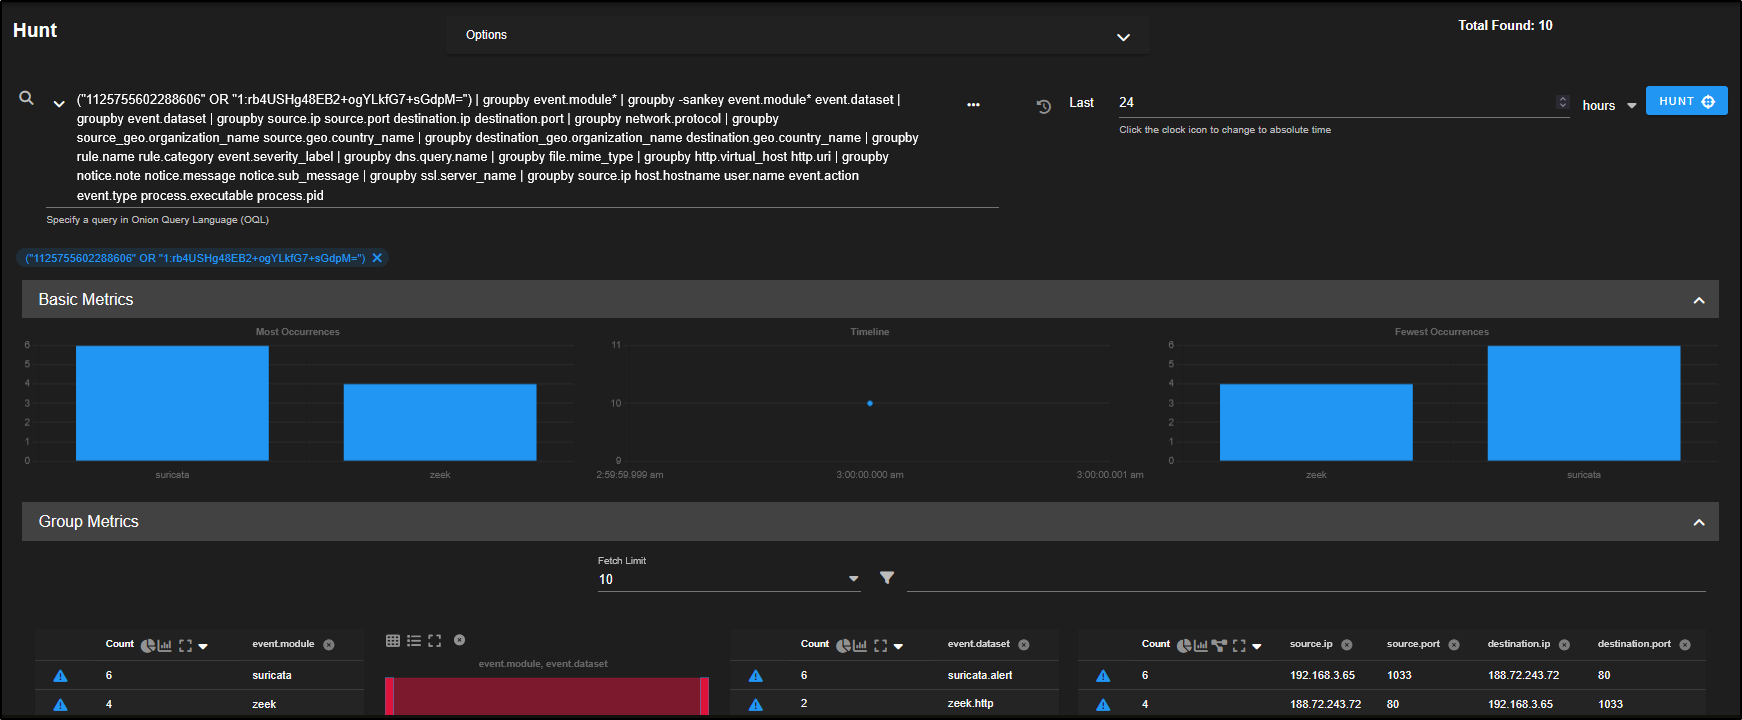
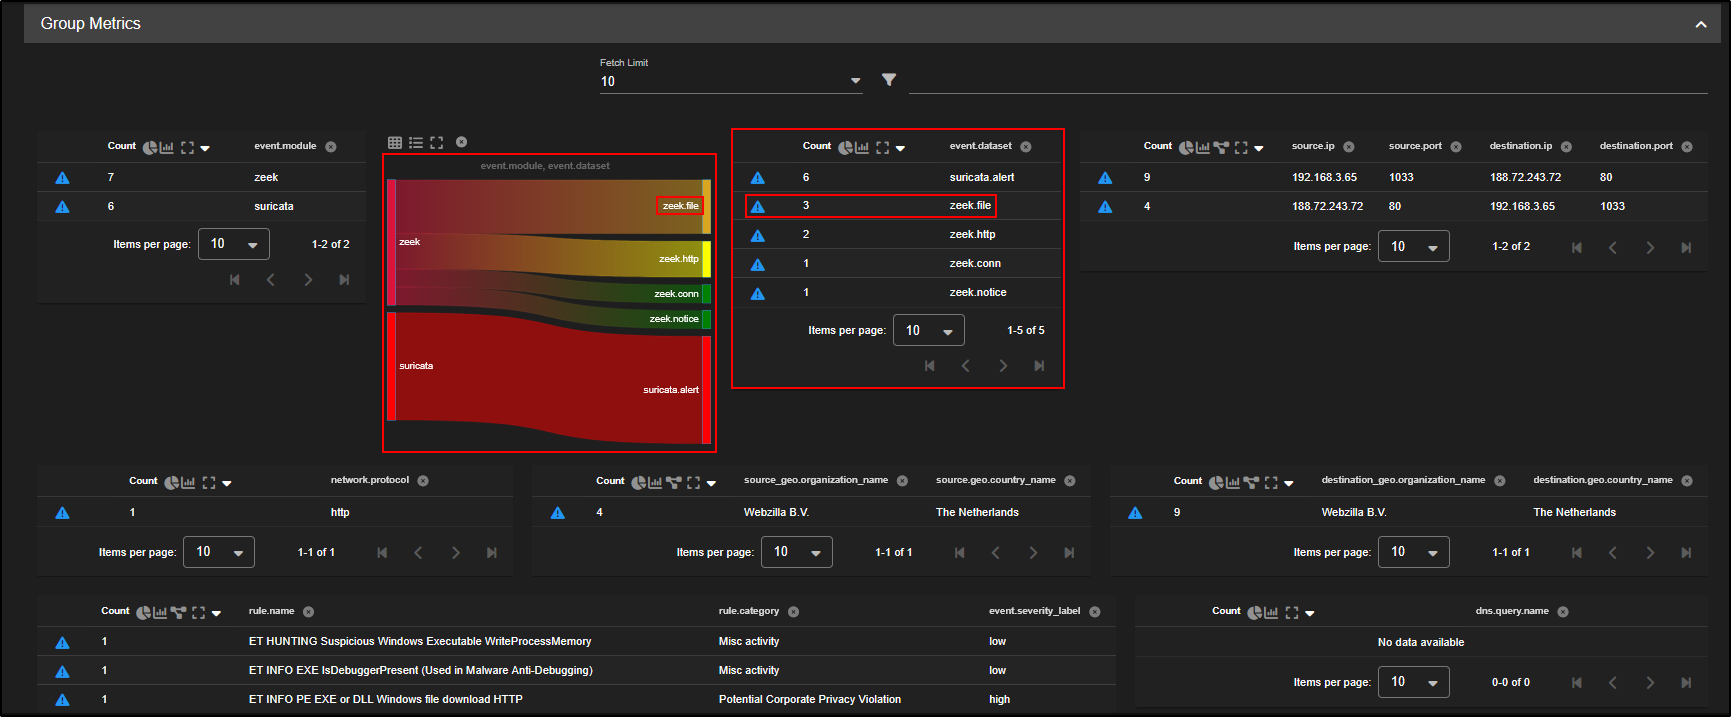
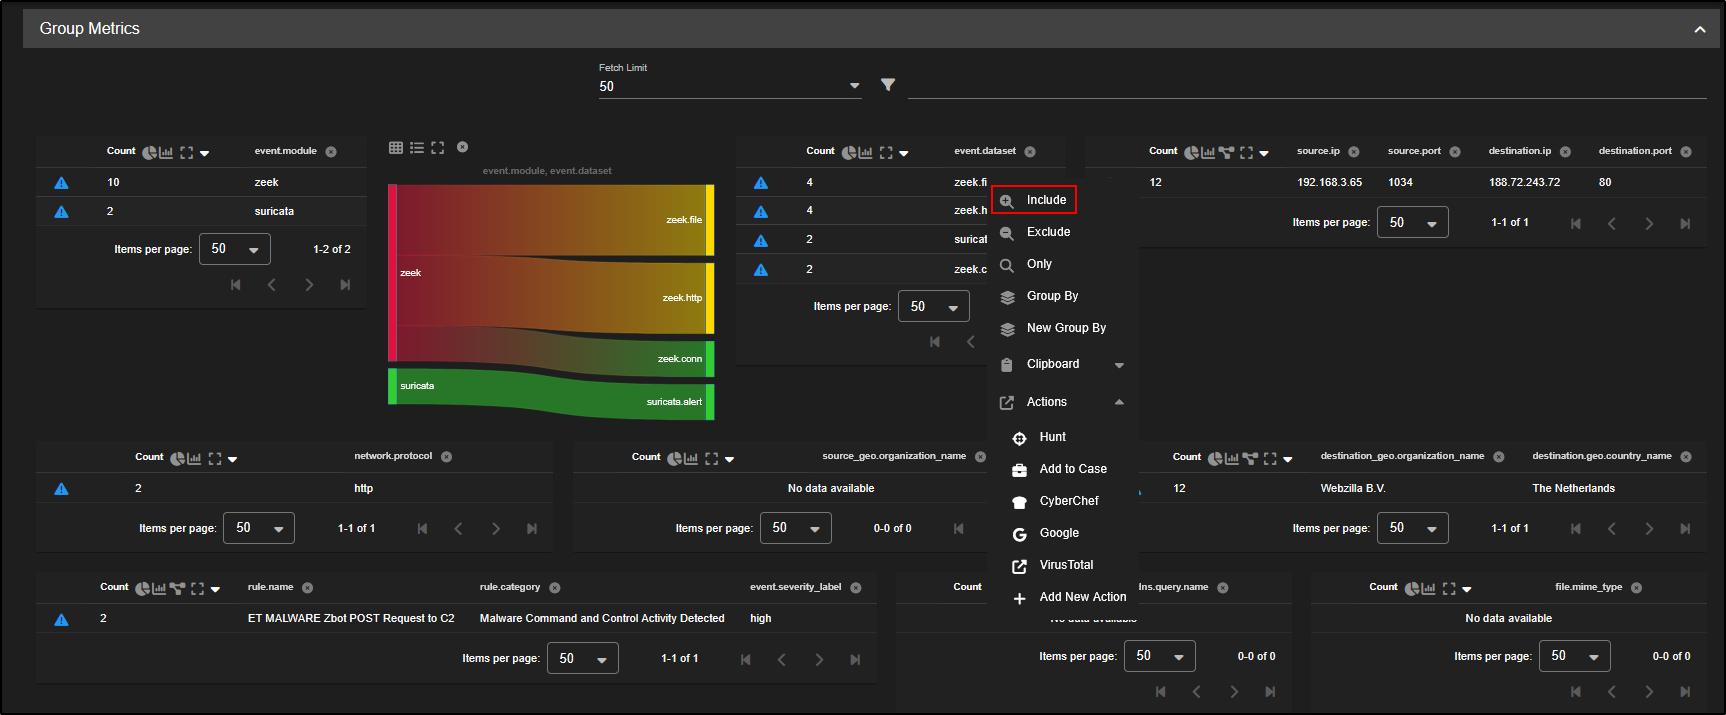
This opens a dashboard view containing all available information about the network flow.
You will see network metadata from Zeek, along with any Suricata alerts, displayed in the Group Metrics pane. This consolidated view helps you quickly understand what occurred during the flow and which detection tools flagged it.
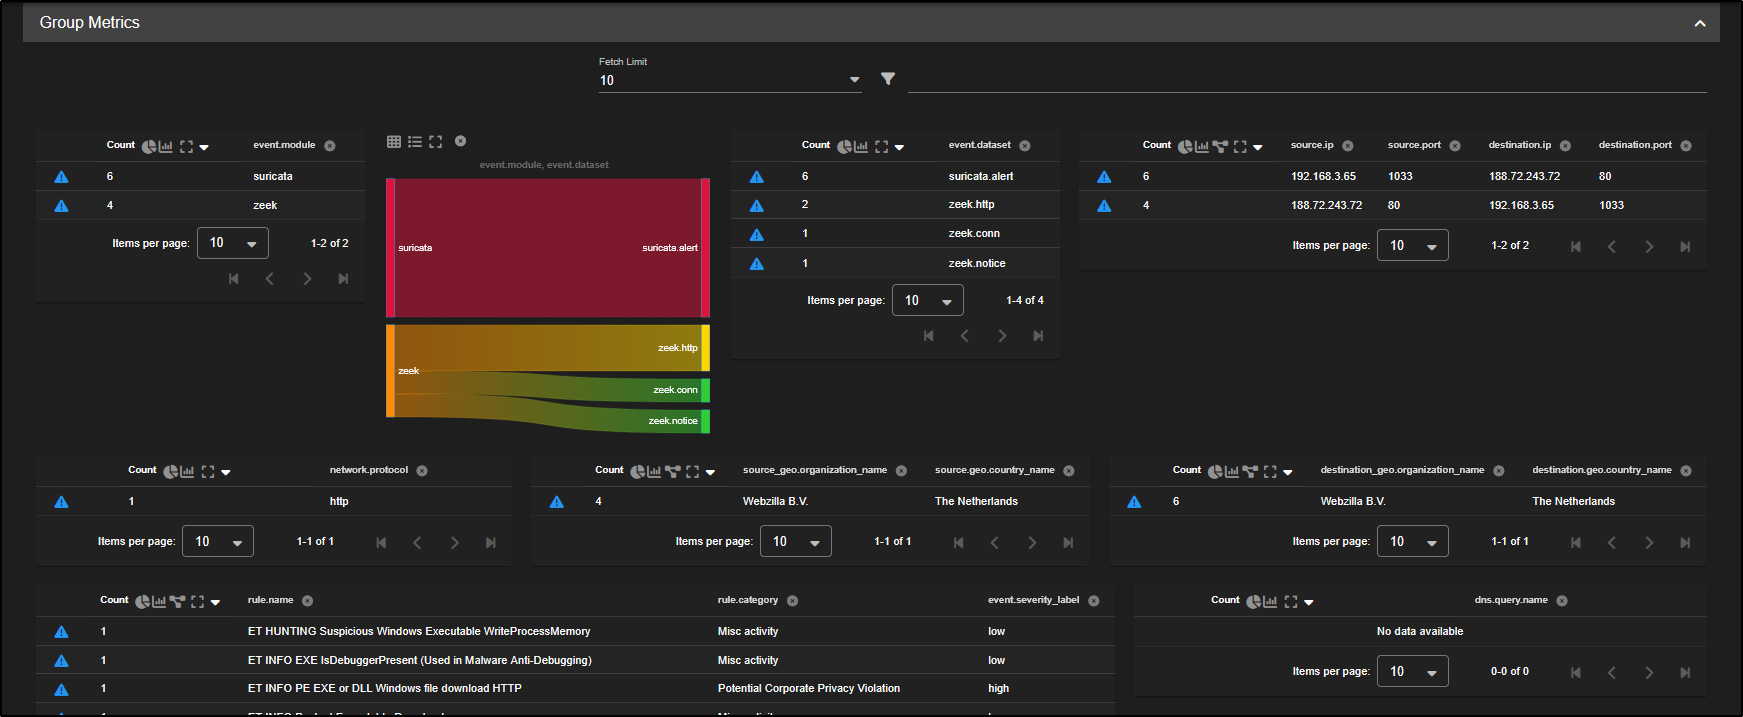
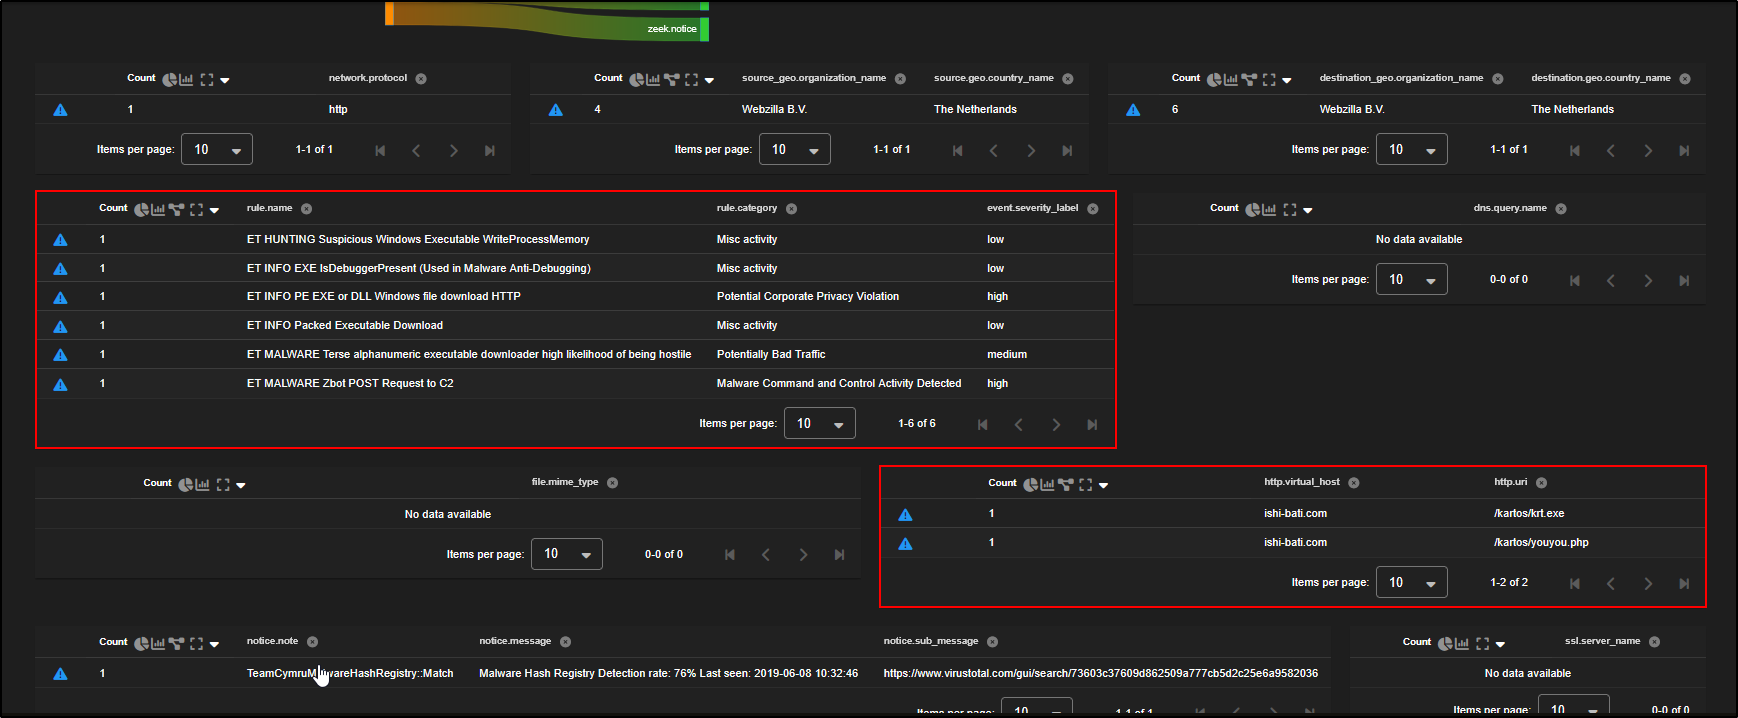
As you scroll down, you will see a list of alerts alongside the HTTP requests sent by the client to the external server.
This provides a clear view of the interaction including what was requested, when it happened, and which alerts were triggered as a result, making it easier to piece together the sequence of events.
Since zeek.file records do not include network connection details, you will need to correlate them with the zeek.conn records to link the file activity to its corresponding network flow.
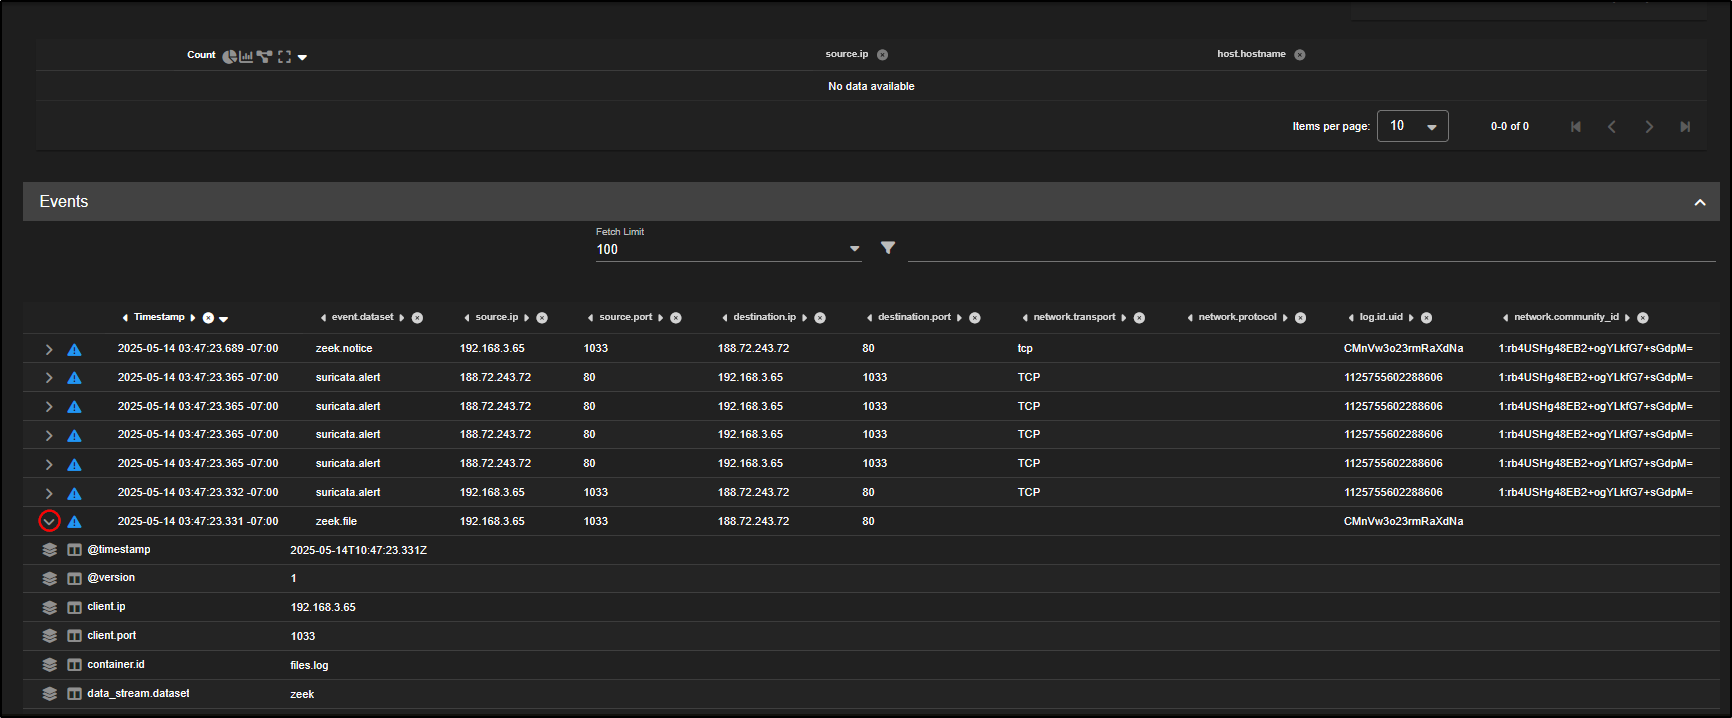
Scroll down to the zeek.conn dataset, click Actions, then select Correlate. This will tie the file metadata to the relevant connection log, giving you the full context of how the file was transferred.
After correlating with the connection log, you should now see zeek.file records appear.
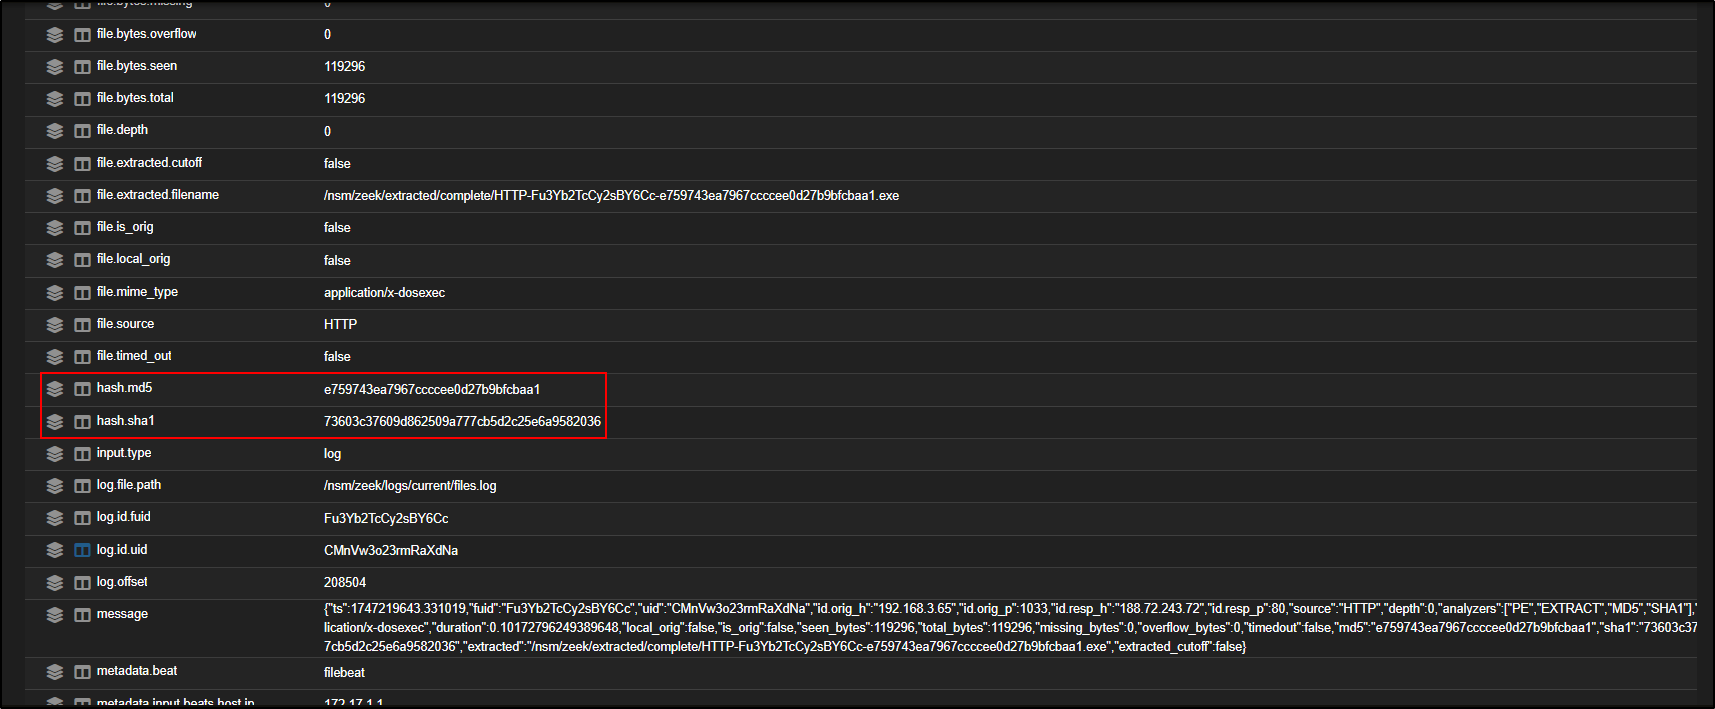
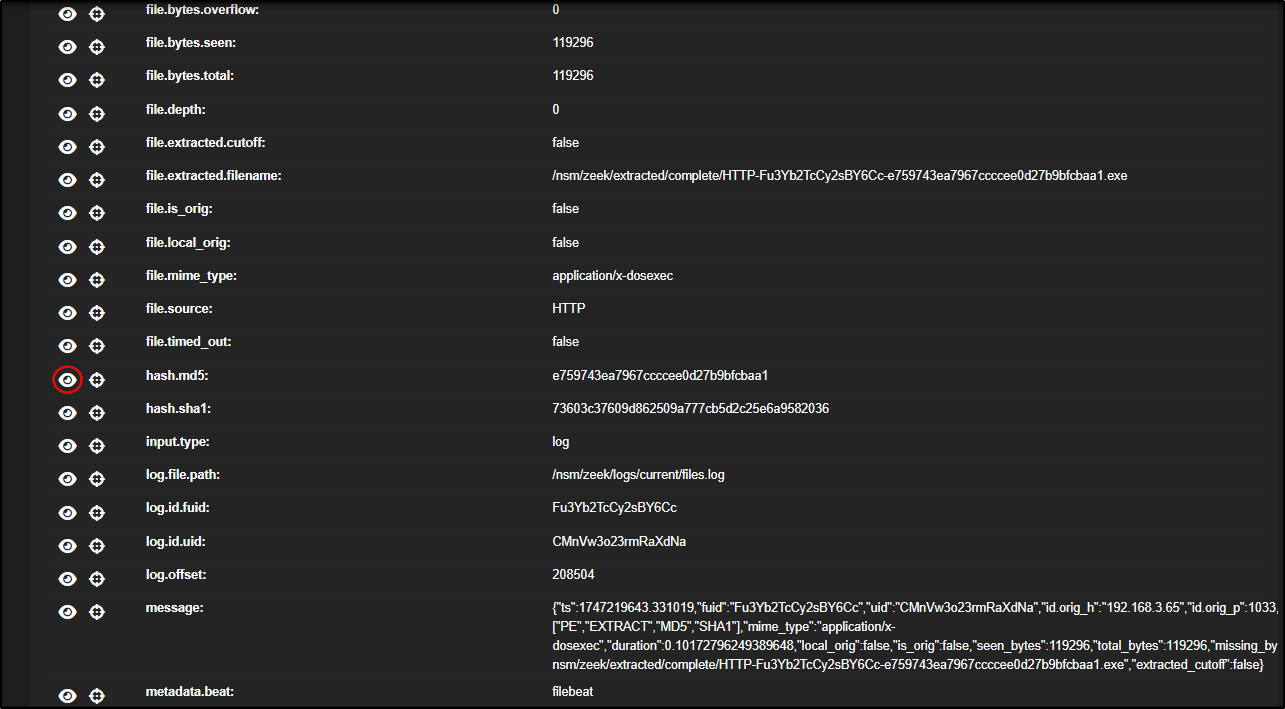
If you scroll down and expand the zeek.file entry, you will find detailed information about the transferred executable file including file size, MIME type, and most importantly, hash values like MD5, SHA1, and SHA256.
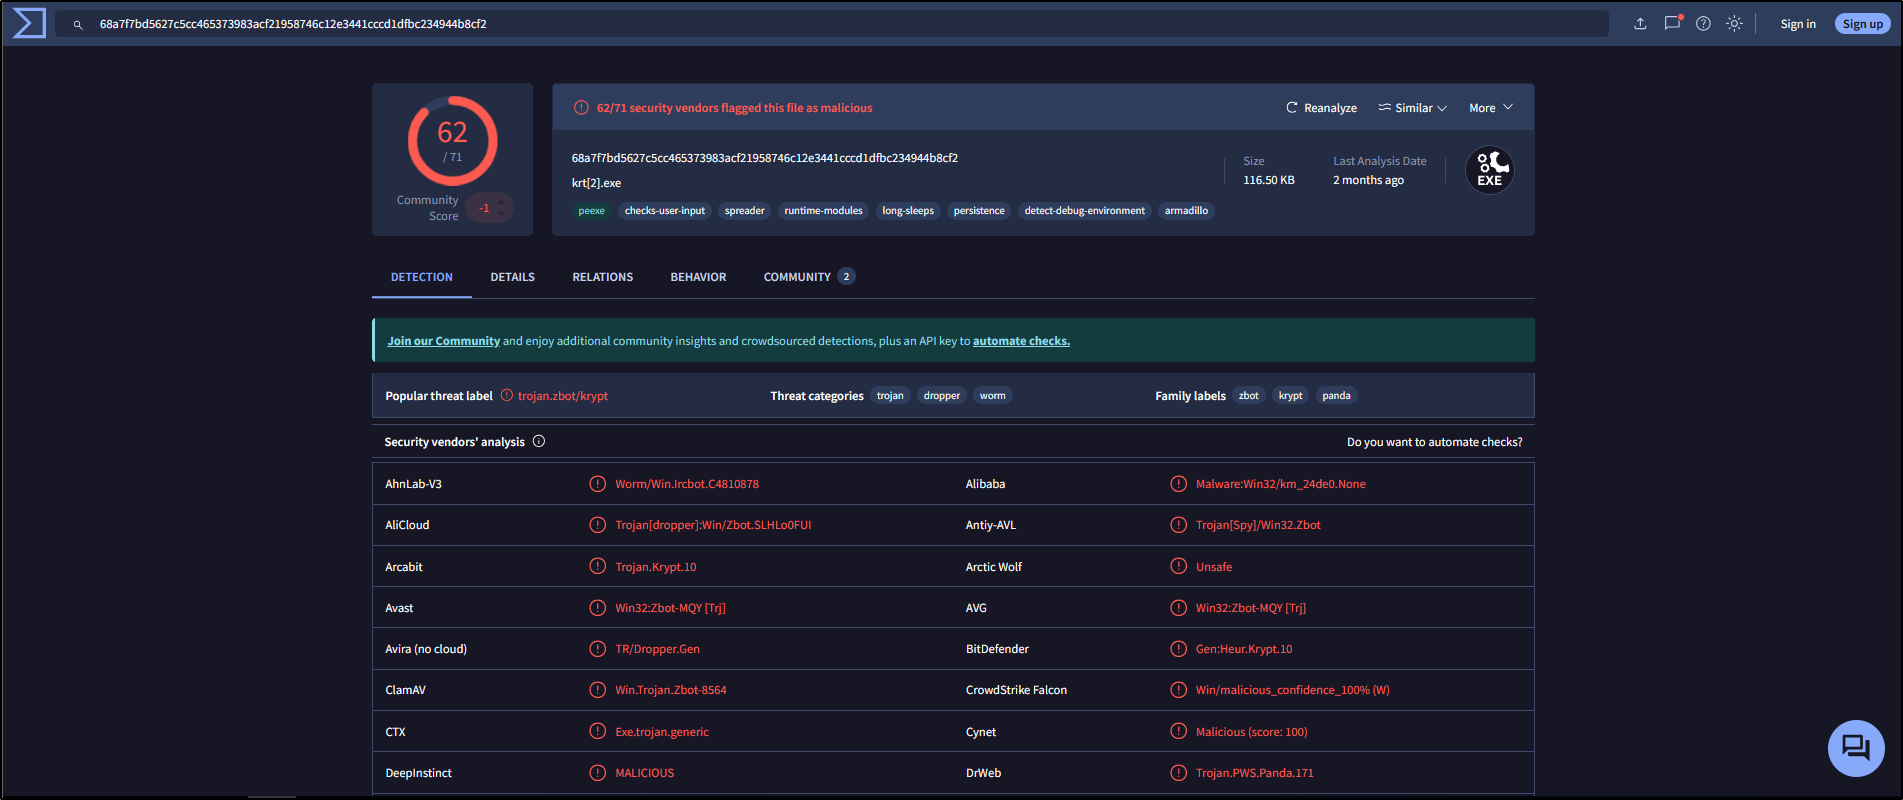
You can check if the file is known to be malicious by clicking on any of the hash values (MD5, SHA1, or SHA256) and selecting VirusTotal.
This will open a link to VirusTotal with a lookup of the hash, showing if the file has been flagged by any antivirus engines or threat intelligence sources.
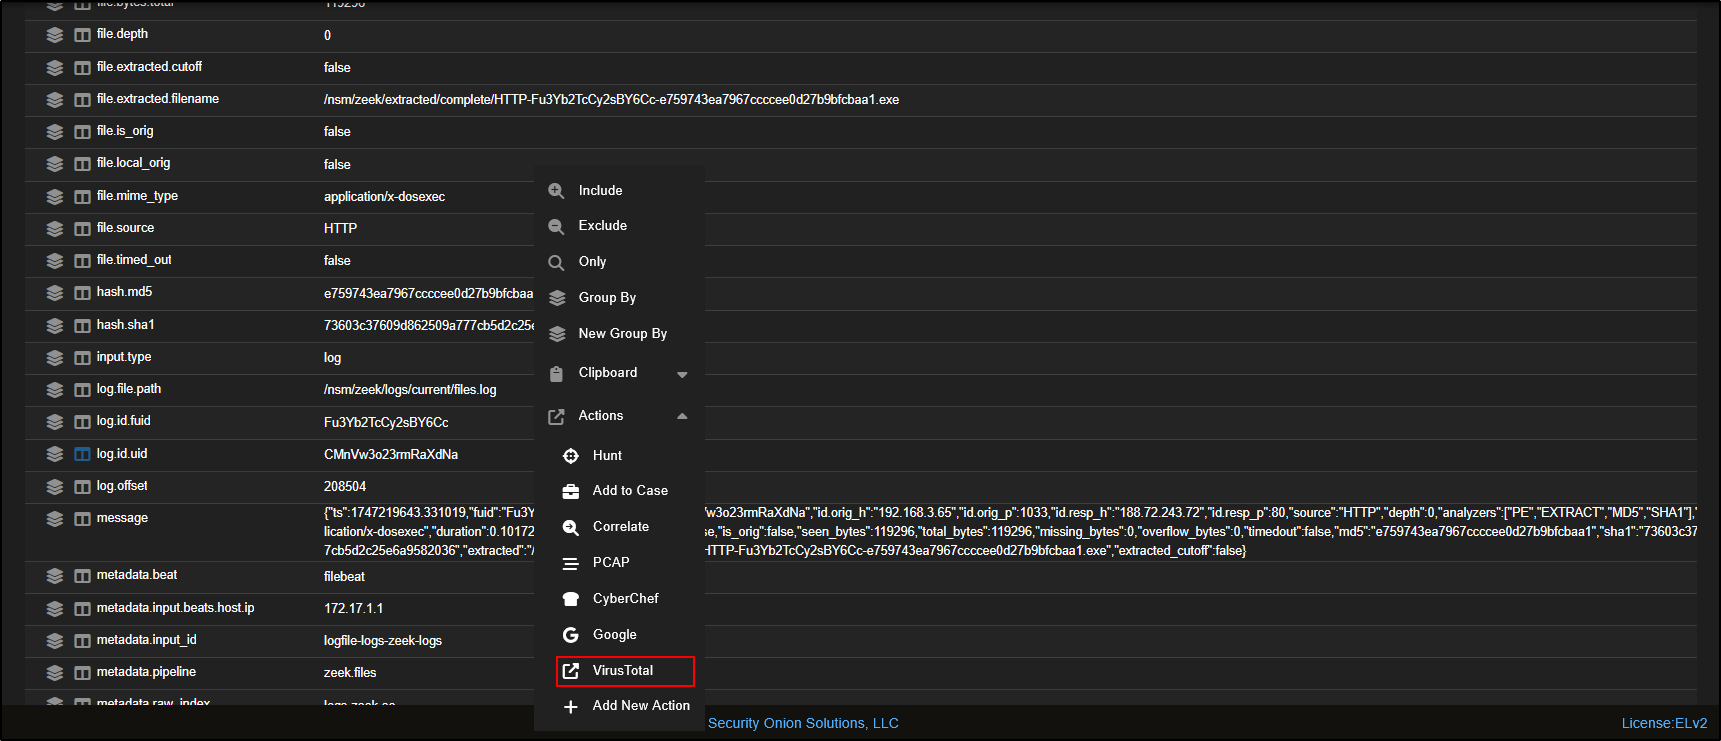
As expected, the VirusTotal results confirm that this is indeed a malicious file.
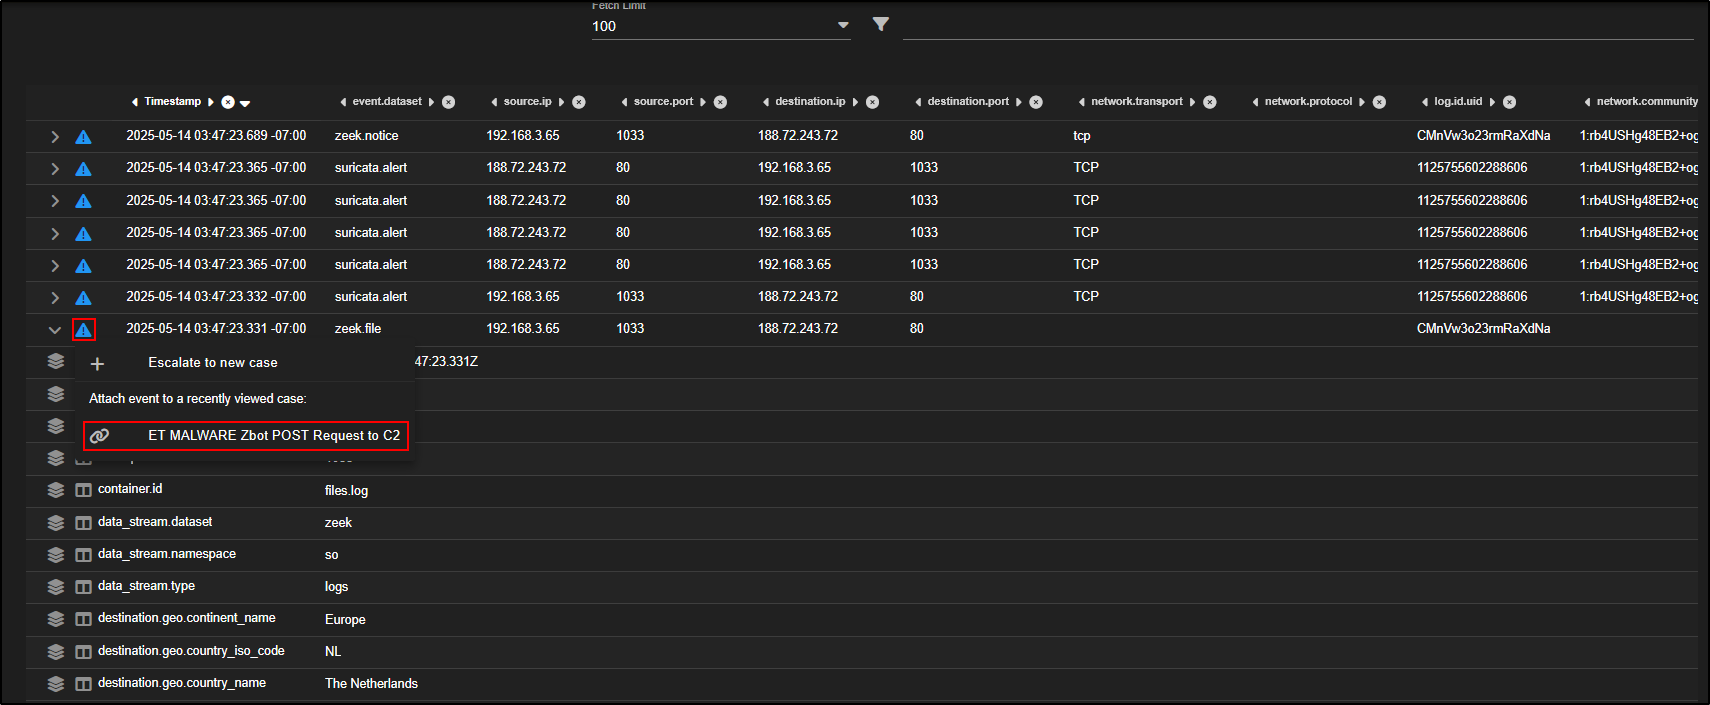
To link this file to your investigation, click the triangle icon on the relevant zeek.file record. Then choose the name of your case under "Attach event to a recently viewed case".
This ensures the event is documented as part of your case evidence.
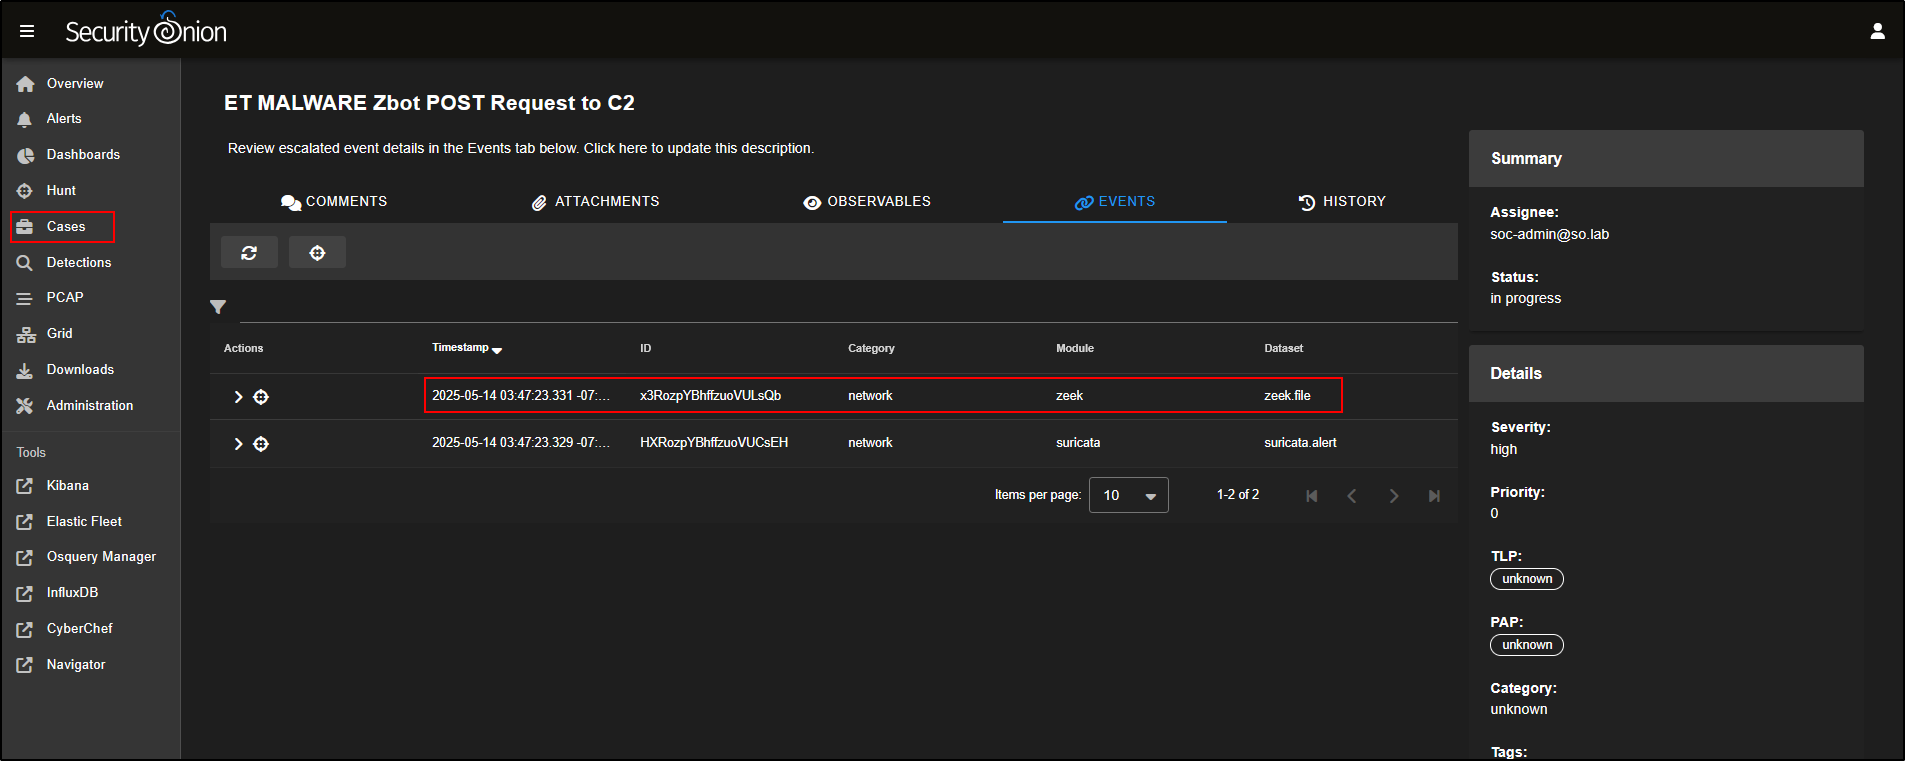
If you return to the Cases tab and open the Events section for your case, you will see that the zeek.file record has been successfully added confirming it is now part of your investigation’s evidence trail.
To add the file hash as an Observable, open the event, scroll down to the hash section, and click on the eye icon next to the hash value.
This will extract the hash and add it to the case as an observable, making it easier to track and hunt for across your environment.
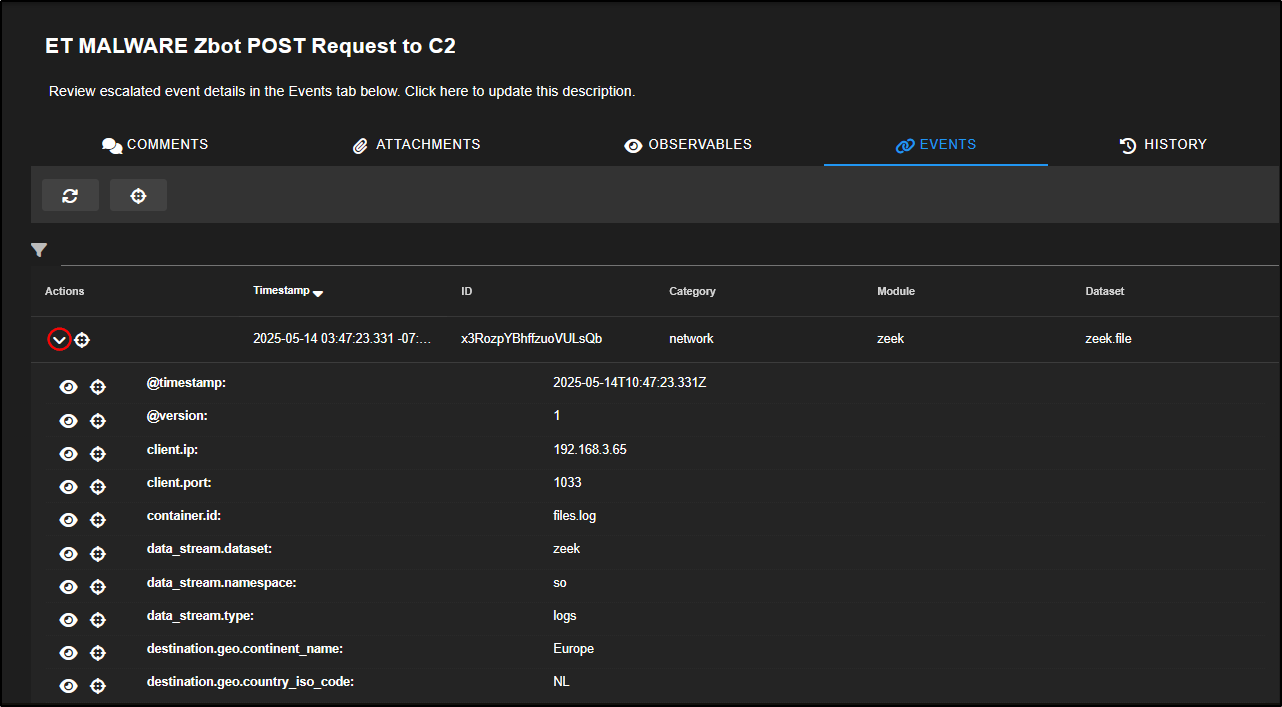
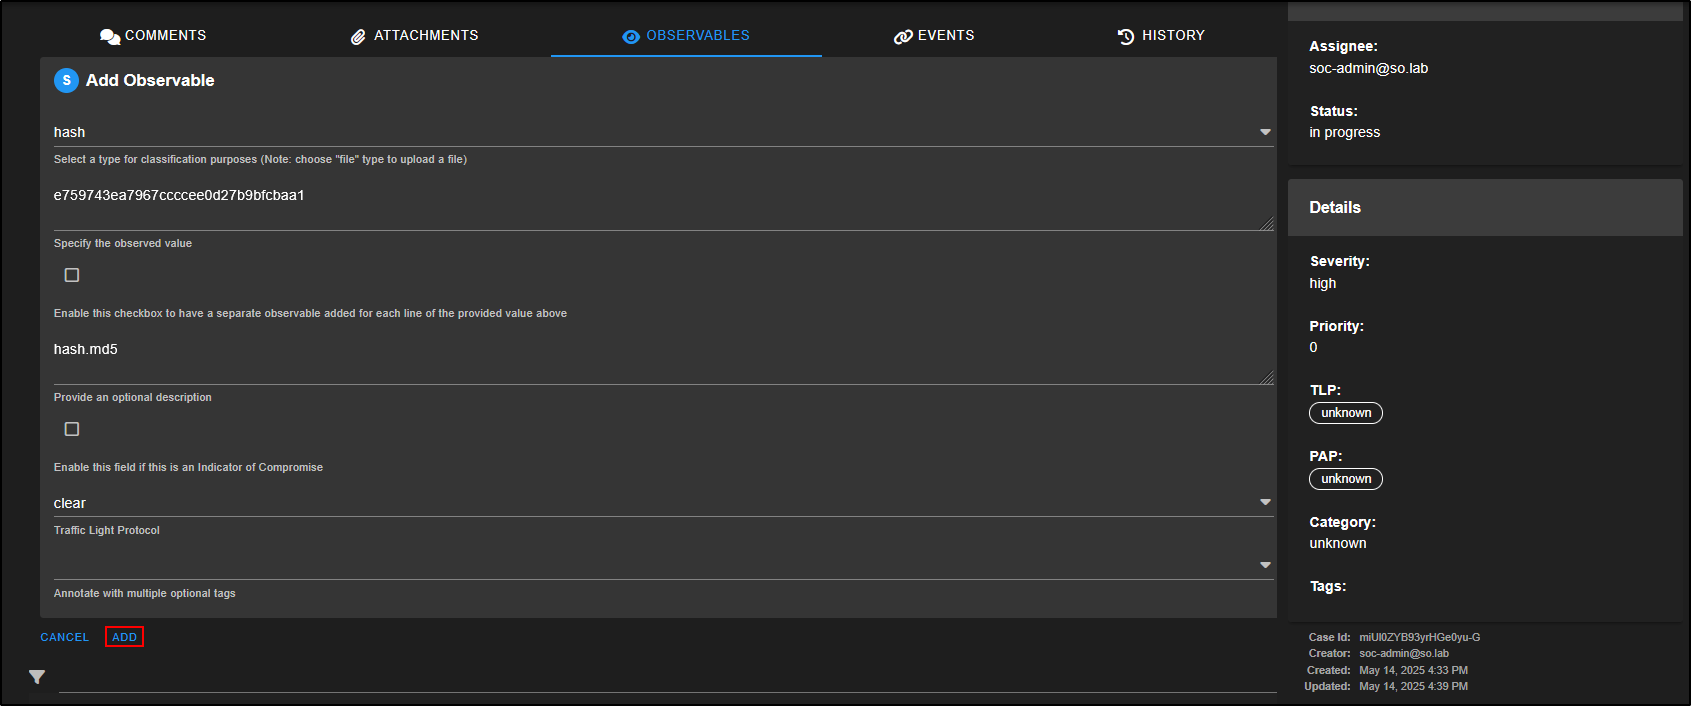
This action will automatically open the Add Observable pane with the hash values pre-filled. Simply click ADD to save the observable to your case.
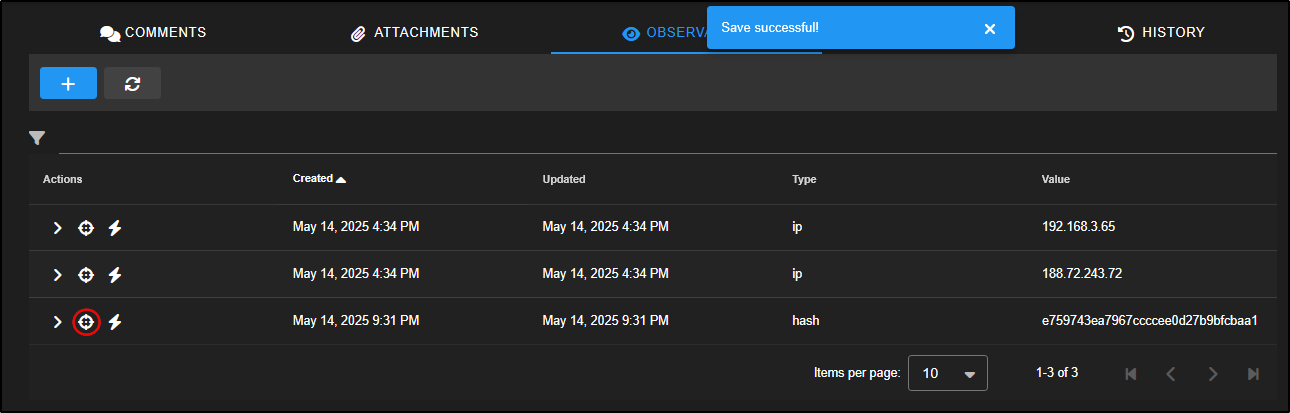
You can now click the crosshair icon next to the observable to launch a new hunt focused on that hash. This helps you check whether the same file appears anywhere else in your environment, which could indicate further compromise.
You can keep building on the investigation by returning to the original Zbot C2 alerts, reviewing activity from other source IPs, and identifying any further signs of infection. Use the PCAPs and network metadata to extract additional Indicators of Compromise (IOCs) and document your findings clearly within the case.
Summary of Alert Triage and Case Creation:
- The Alerts tab shows potential threats detected in your network.
- Analysts can review, acknowledge, dismiss, or escalate alerts to cases for further analysis.
- Once escalated, cases serve as a central record for investigations — storing related events, observables, and attachments.
Threat Hunting
Go to the Hunt page in the SOC web interface.
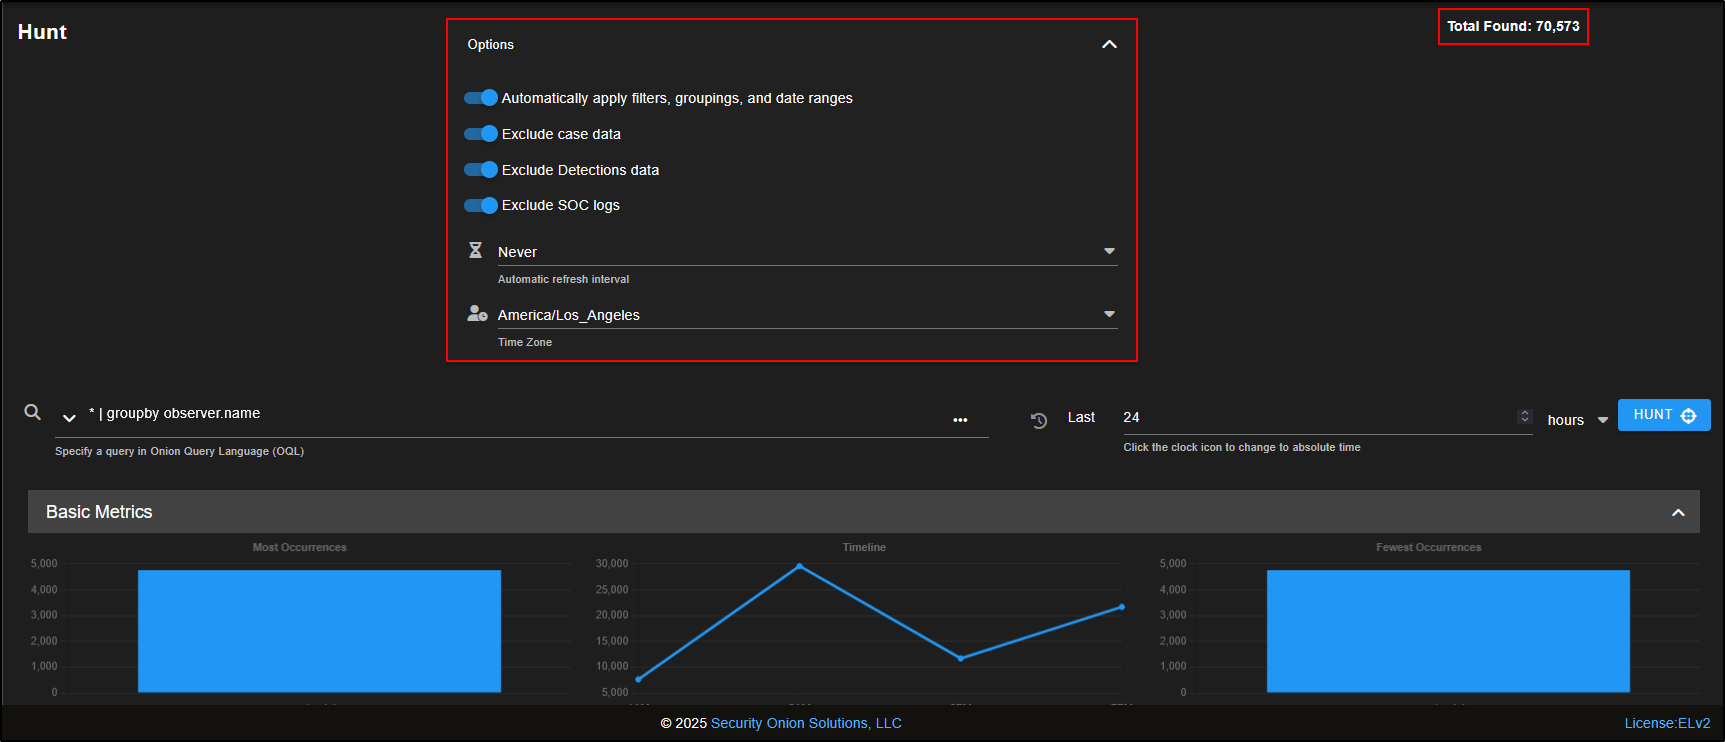
In the Options drop-down:
- Automatically apply filters, groupings and date ranges controls whether queries update automatically when you adjust search settings. If disabled, you will need to click the Hunt button manually to refresh results.
- The next three toggles let you exclude case data, detection rules, and SOC logs from your search. These are enabled by default to avoid clutter.
- You can also set an auto-refresh interval and choose a local time zone for viewing results.
In the top-right corner, you will see a Total Found count showing how many records were returned by the current query.
In the top-left corner of the Hunt page, you will find the query drop-down. Clicking the down arrow reveals a list of prebuilt queries.
Next to it is a free-text query box, where you can enter custom searches using Onion Query Language (OQL) which is ****a simple, powerful syntax tailored for Security Onion.
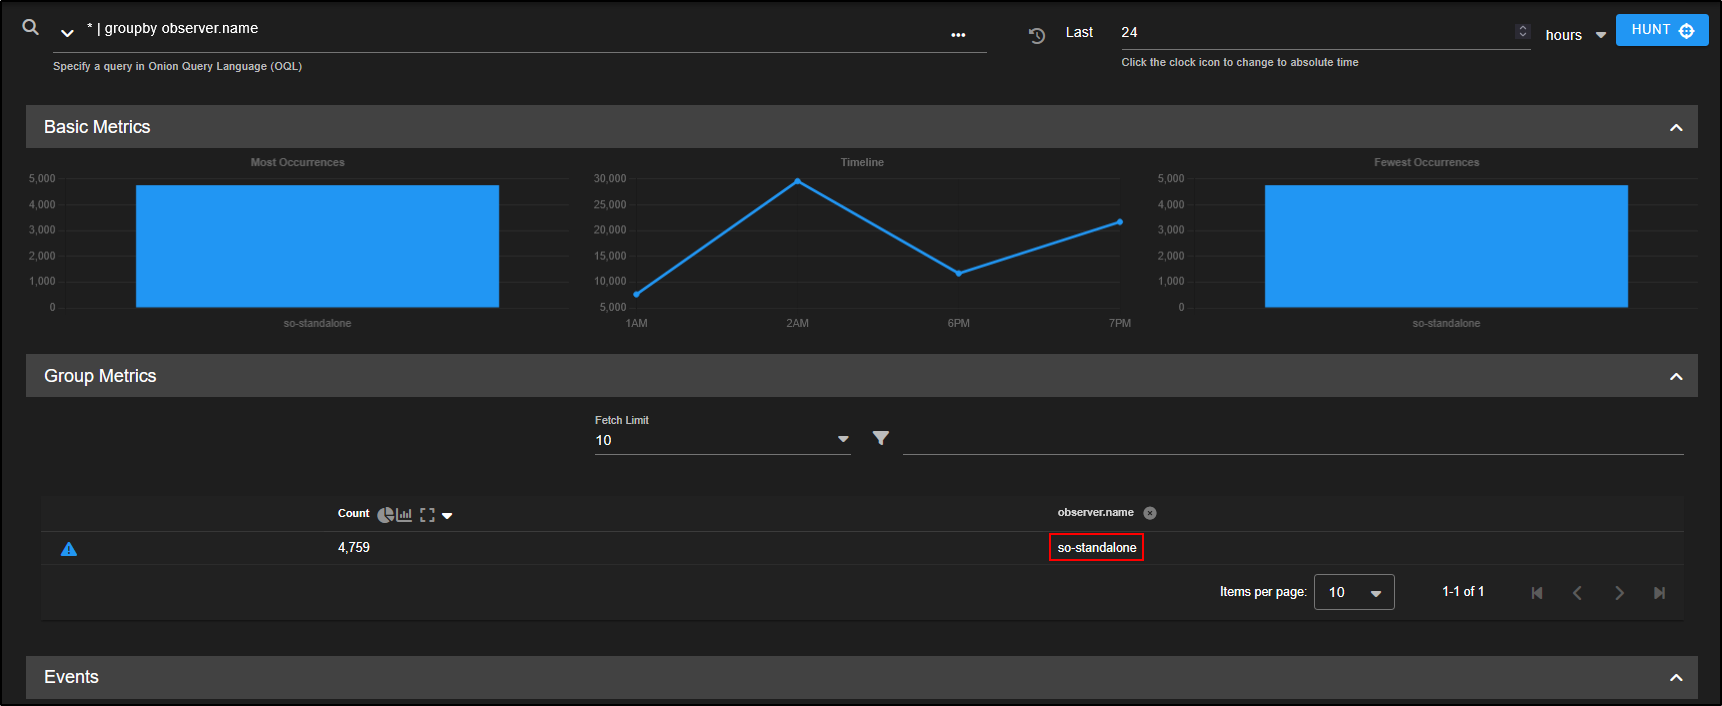
By default, the query is *, which means:
- Show all records from the last 24 hours.
- Group them by observer.name which, in a Standalone setup, is just your Security Onion VM.
From the query drop-down, select Log Type.
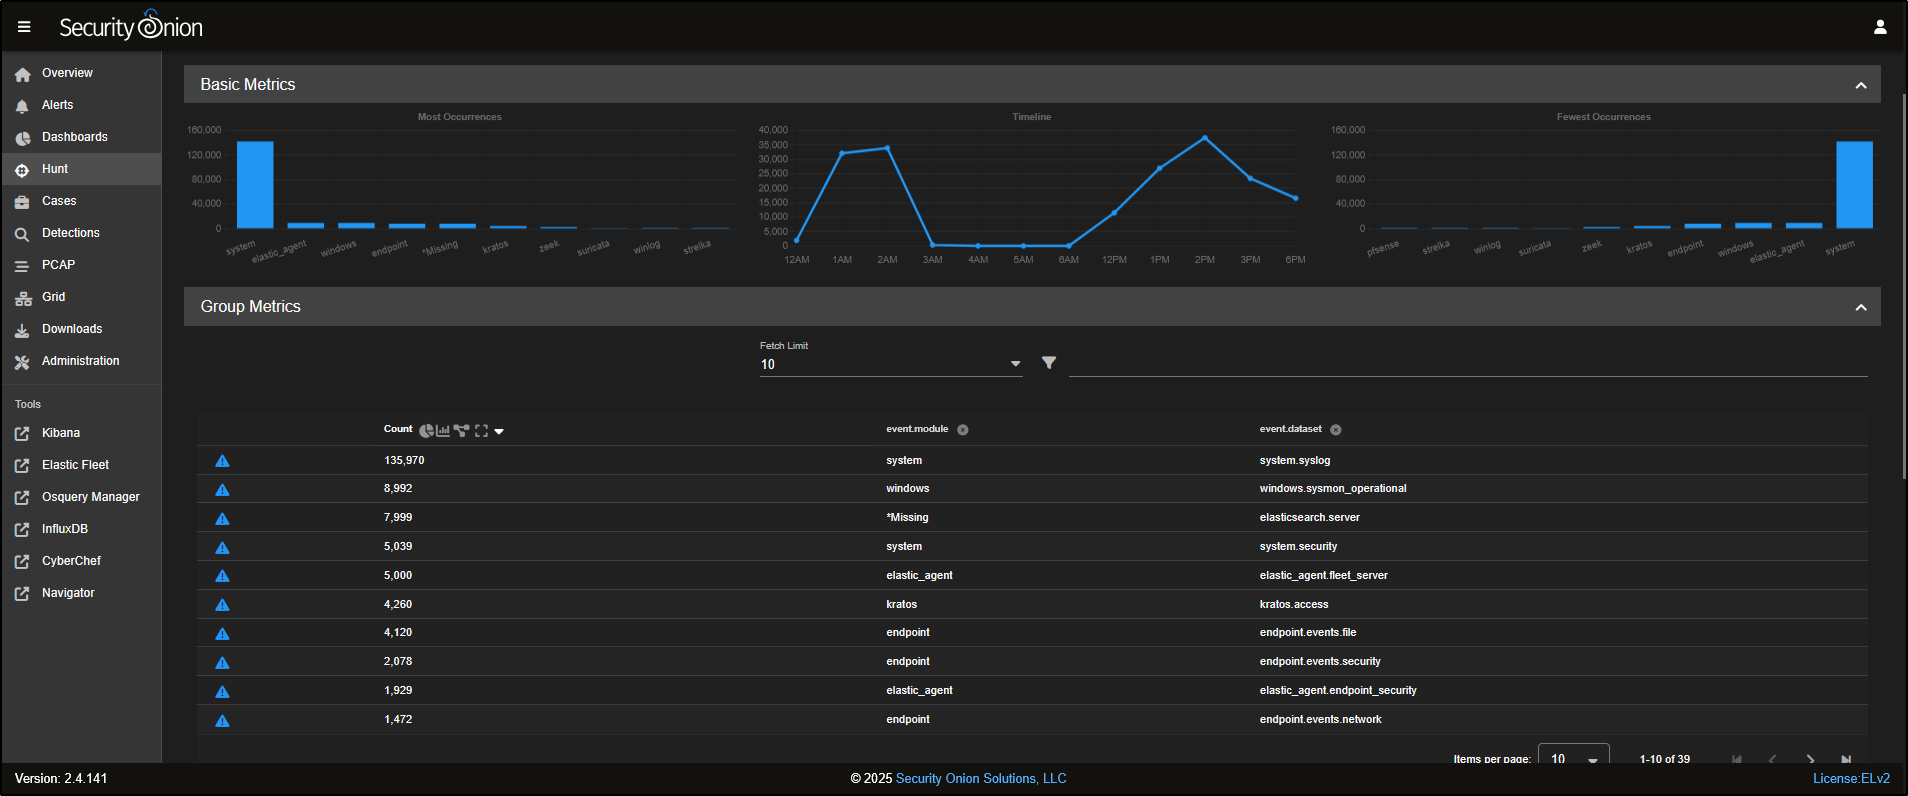
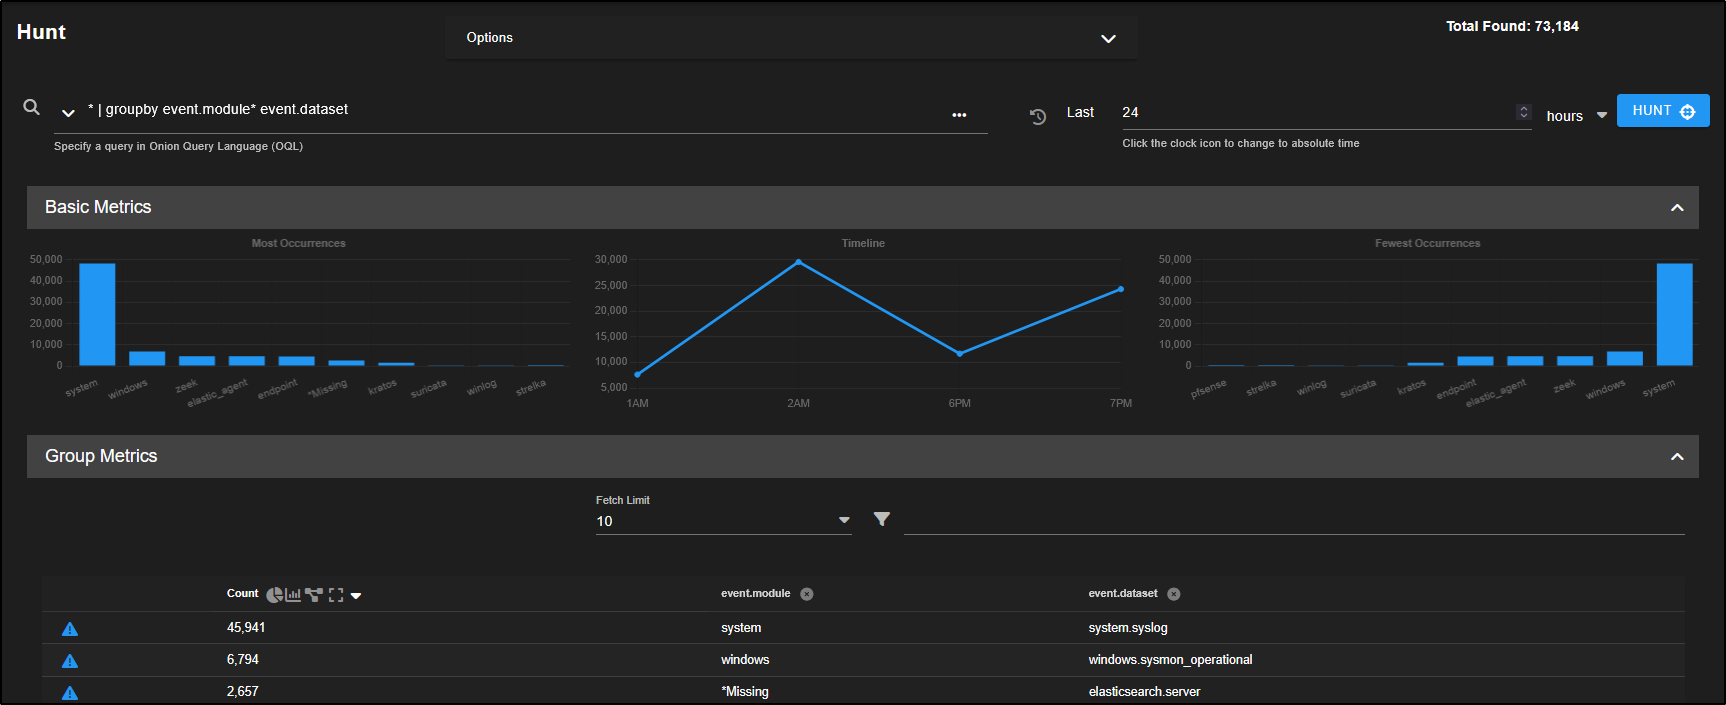
We are now viewing all records, grouped by their event modules and datasets.
- Base Metrics have been refreshed to reflect the current query.
- The bar graphs display the most common event modules, ranked from highest to lowest.
- Group Metrics show how many records exist for each combination of event module and dataset, giving a clearer picture of log volume and distribution.
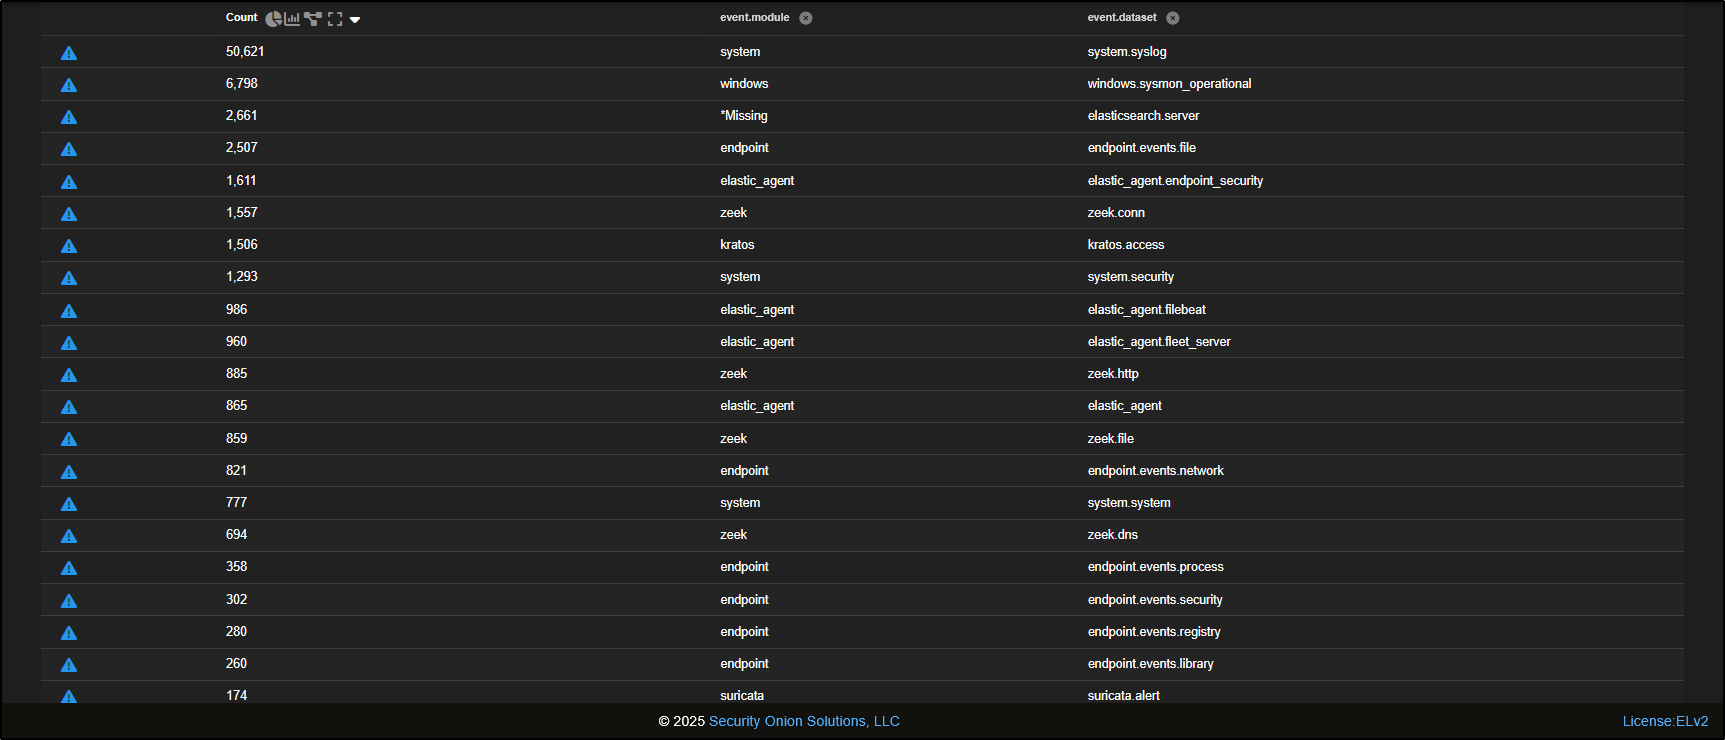
Scrolling down, you will see Suricata alerts, which are generated by the Network Intrusion Detection System (NIDS) built into Security Onion.
You will also notice a variety of metadata produced by Zeek. For every network flow observed, Zeek logs:
- A connection record (basic flow info), and
- A protocol-specific record (e.g. HTTP, DNS) if the traffic matches known protocol patterns.
This layered logging helps analysts get both high-level context and detailed protocol insights during threat hunts.
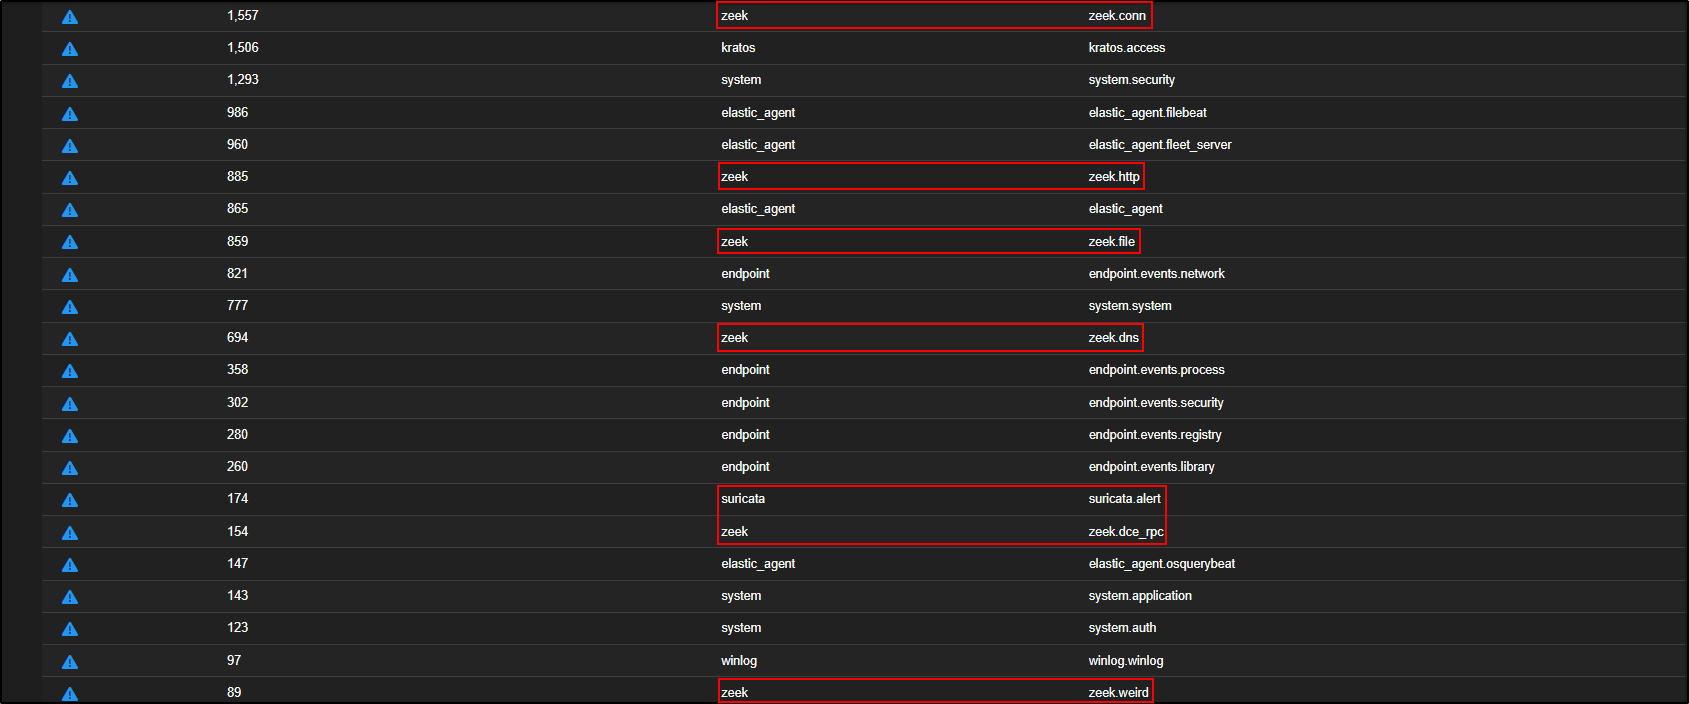
To look at zeek logs, click on zeek and select Include.
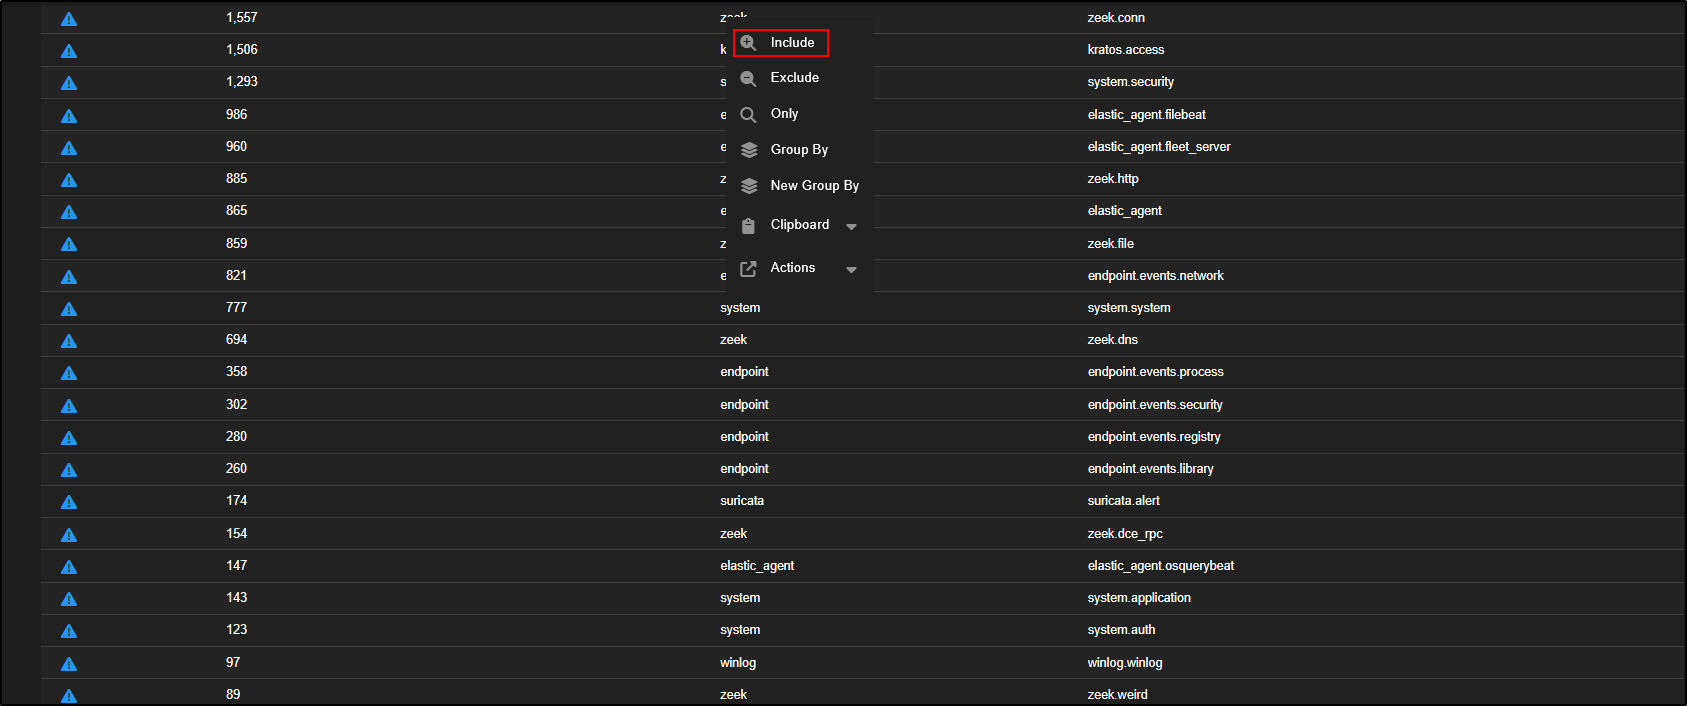
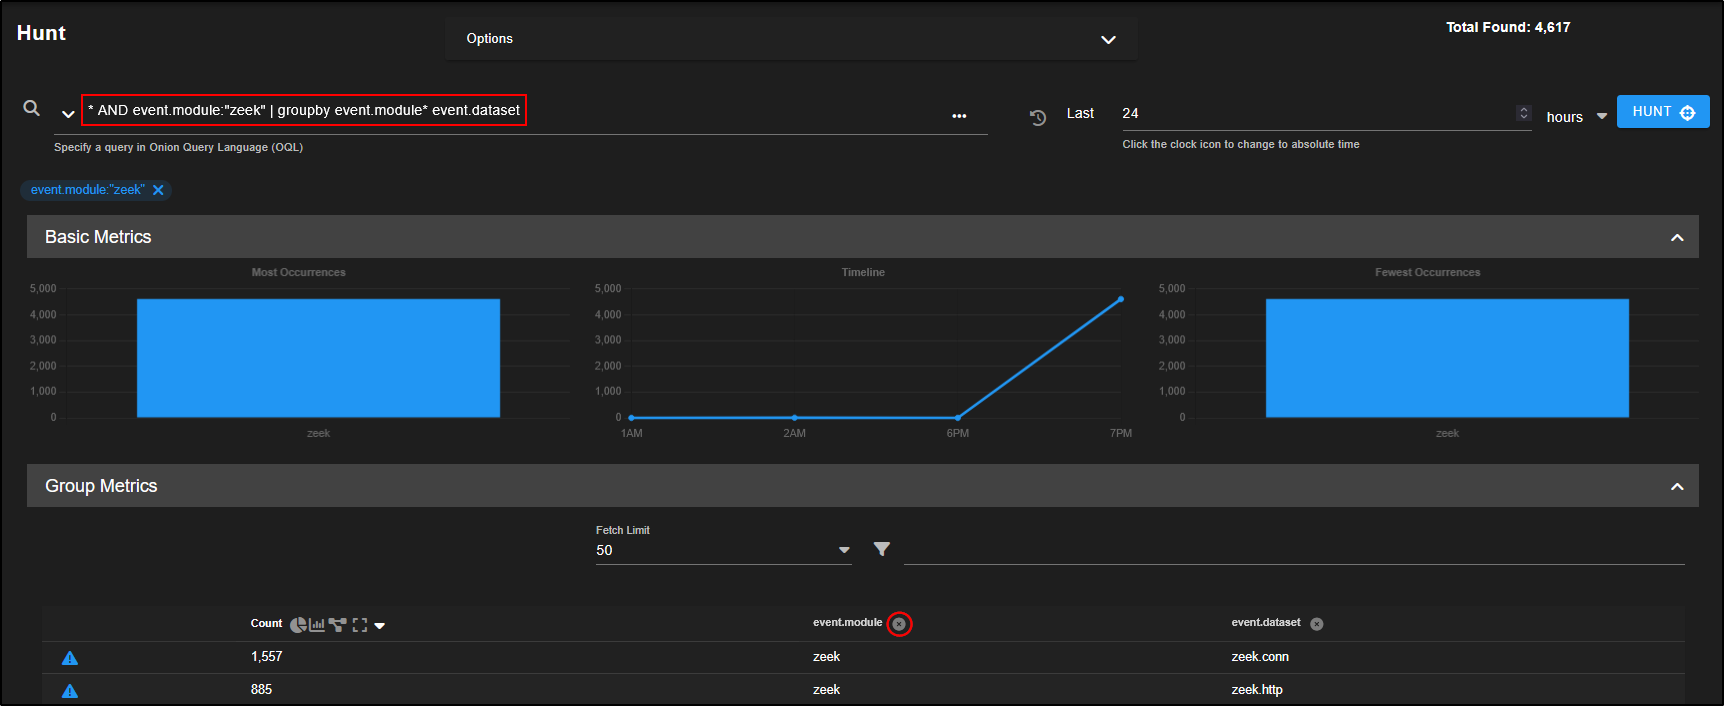
The query now reads AND event.module:"zeek". This tells Security Onion to show only Zeek events, grouped by both event.module and event.dataset.
But since we are already filtering for just Zeek, grouping by event.module is redundant. You can tidy up the view by:
- Removing
groupby event.modulefrom the query box, or - Clicking the close icon above the group column to remove it.
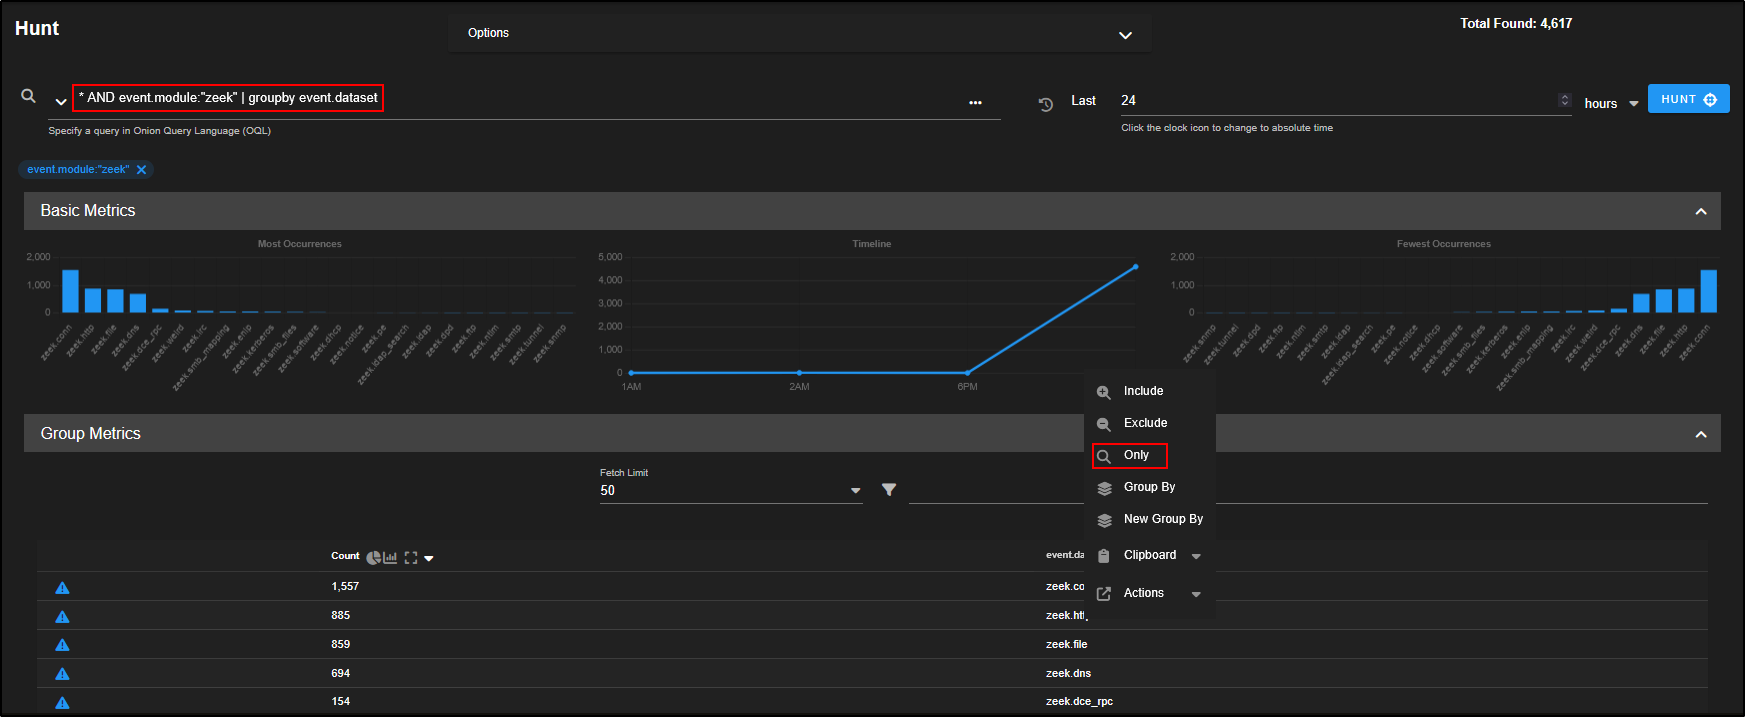
This will simplify the results, grouping only by event.dataset, which is more useful in this context.
With the query now refined to only show Zeek logs grouped by dataset, we are ready to begin our threat hunt.
Our objective is to hunt for a suspicious or malicious HTTP traffic.
To begin:
- Locate the
zeek.httpdataset in the Group Metrics pane. - Click on it and choose Only.
This filters the view to show just HTTP traffic parsed by Zeek, which includes helpful metadata like destination port, host, URI, and user-agent which is perfect for spotting suspicious patterns.
As shown by the Group Metrics, we are now looking at 885 zeek.http records.
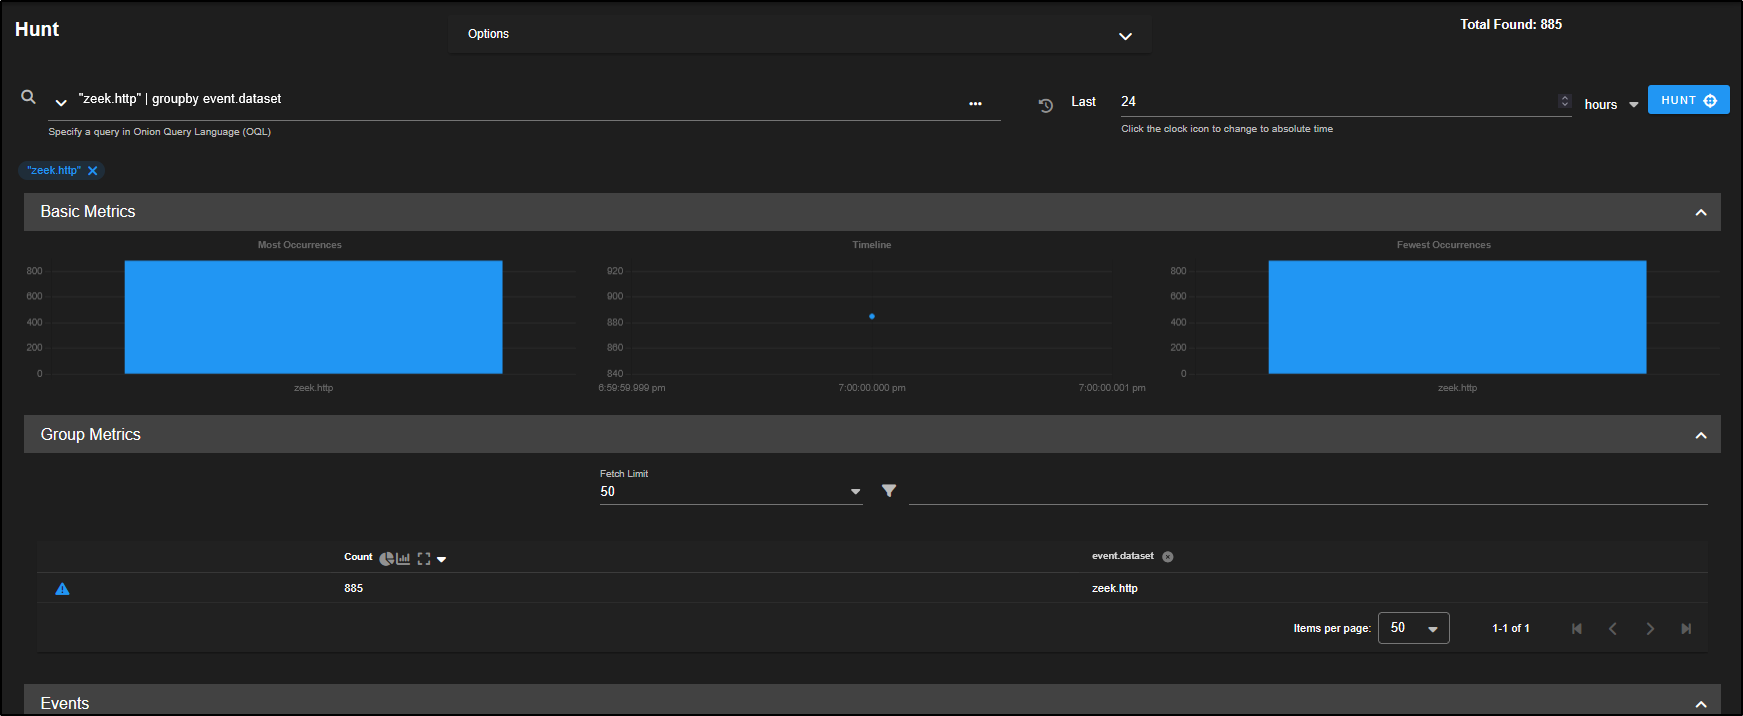
Scrolling down, we can see the list of individual events.
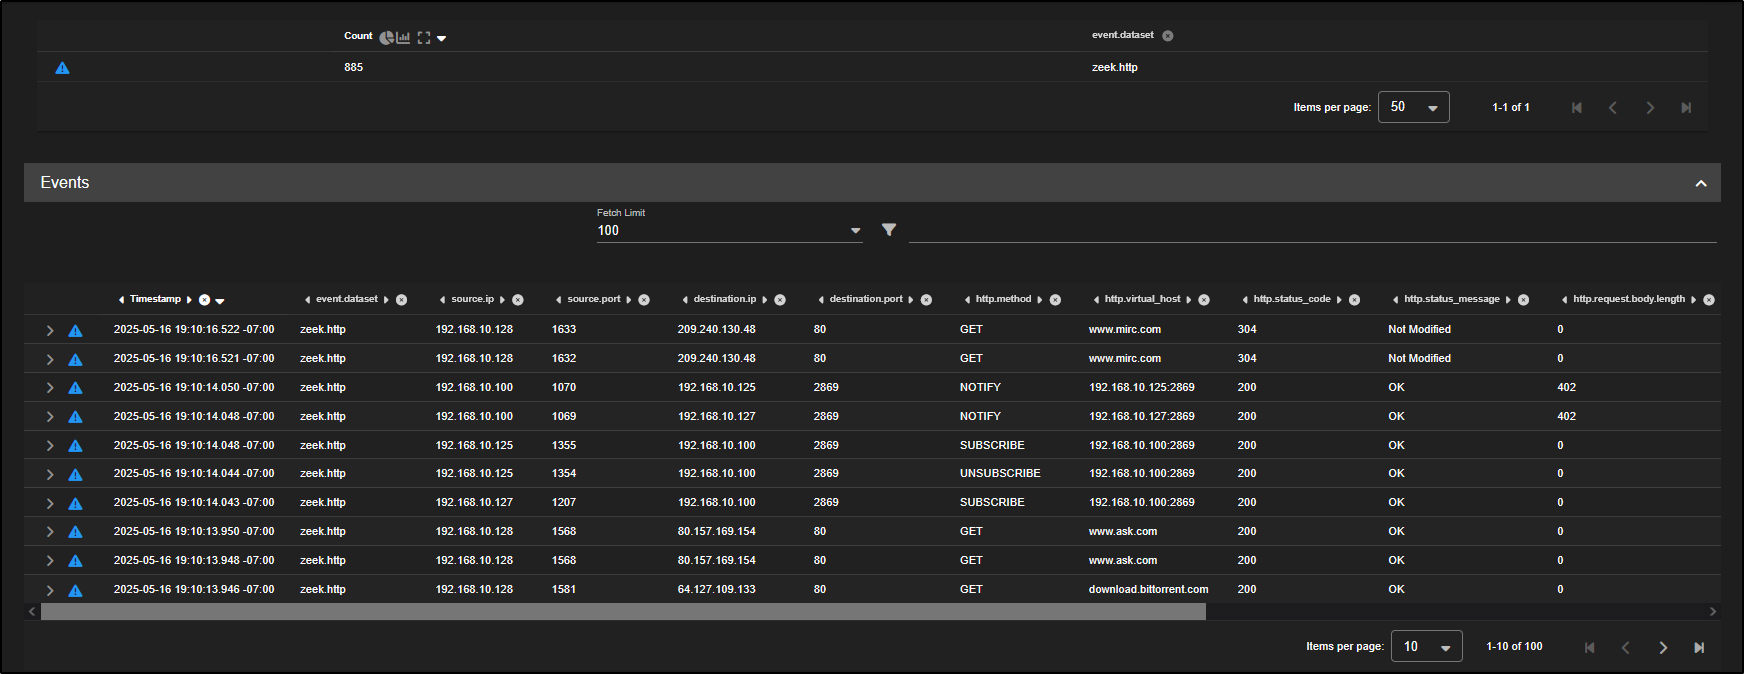
To dig deeper into the events, you can expand any individual log entry for more detail.
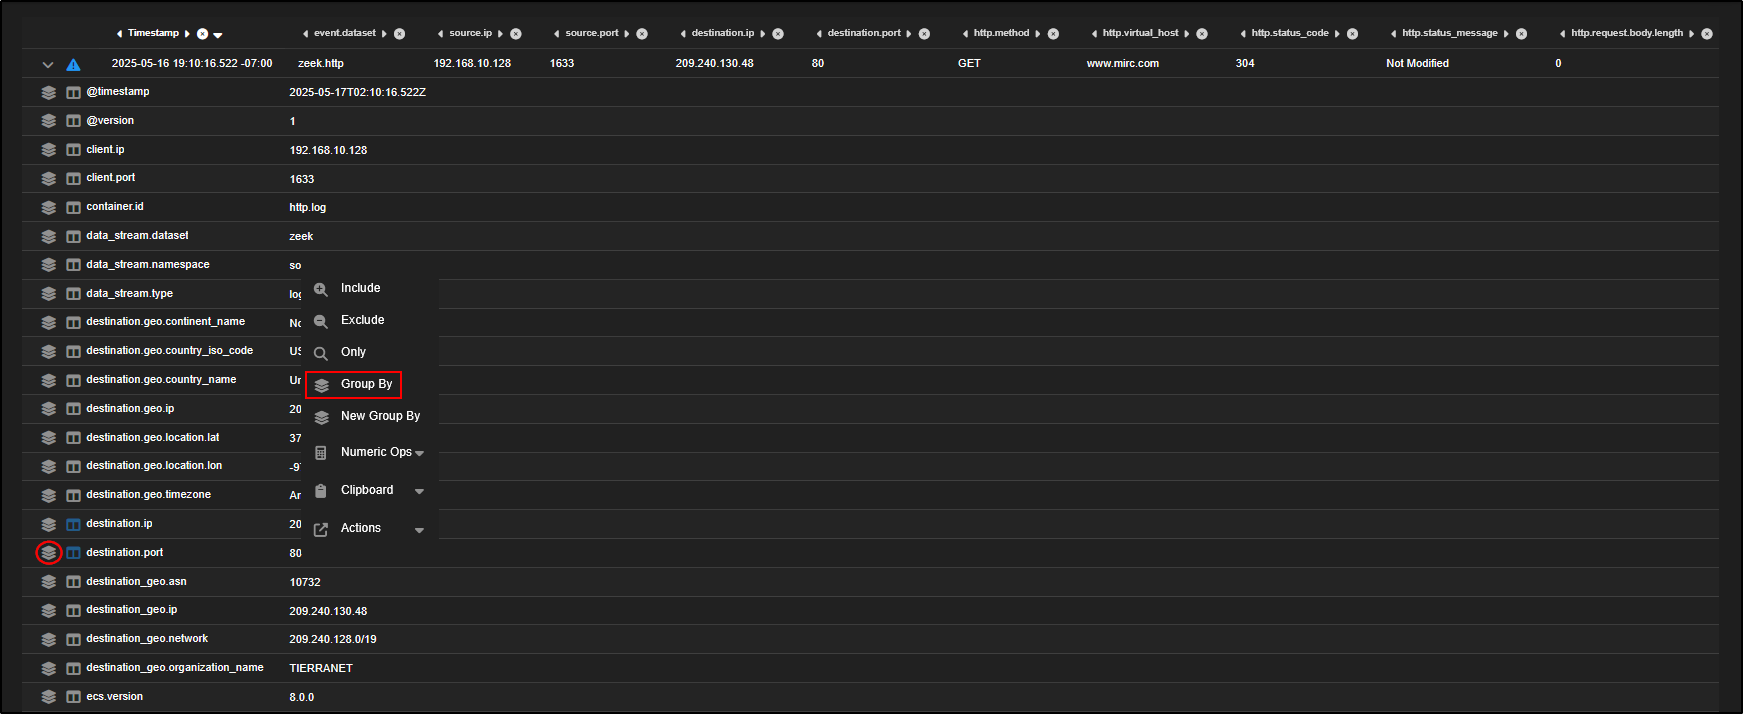
Every field in the event can be used as a pivot point or to refine your view. For example:
- To group HTTP logs by destination port, click on the
destination.portfield and select Group By. - Alternatively, click the stacked paper icon next to the field.
Here is the difference:
- Group By: Adds the field to your current table, refining the existing groupings.
- New Group By: Creates a separate table with the new grouping applied, keeping the original intact.
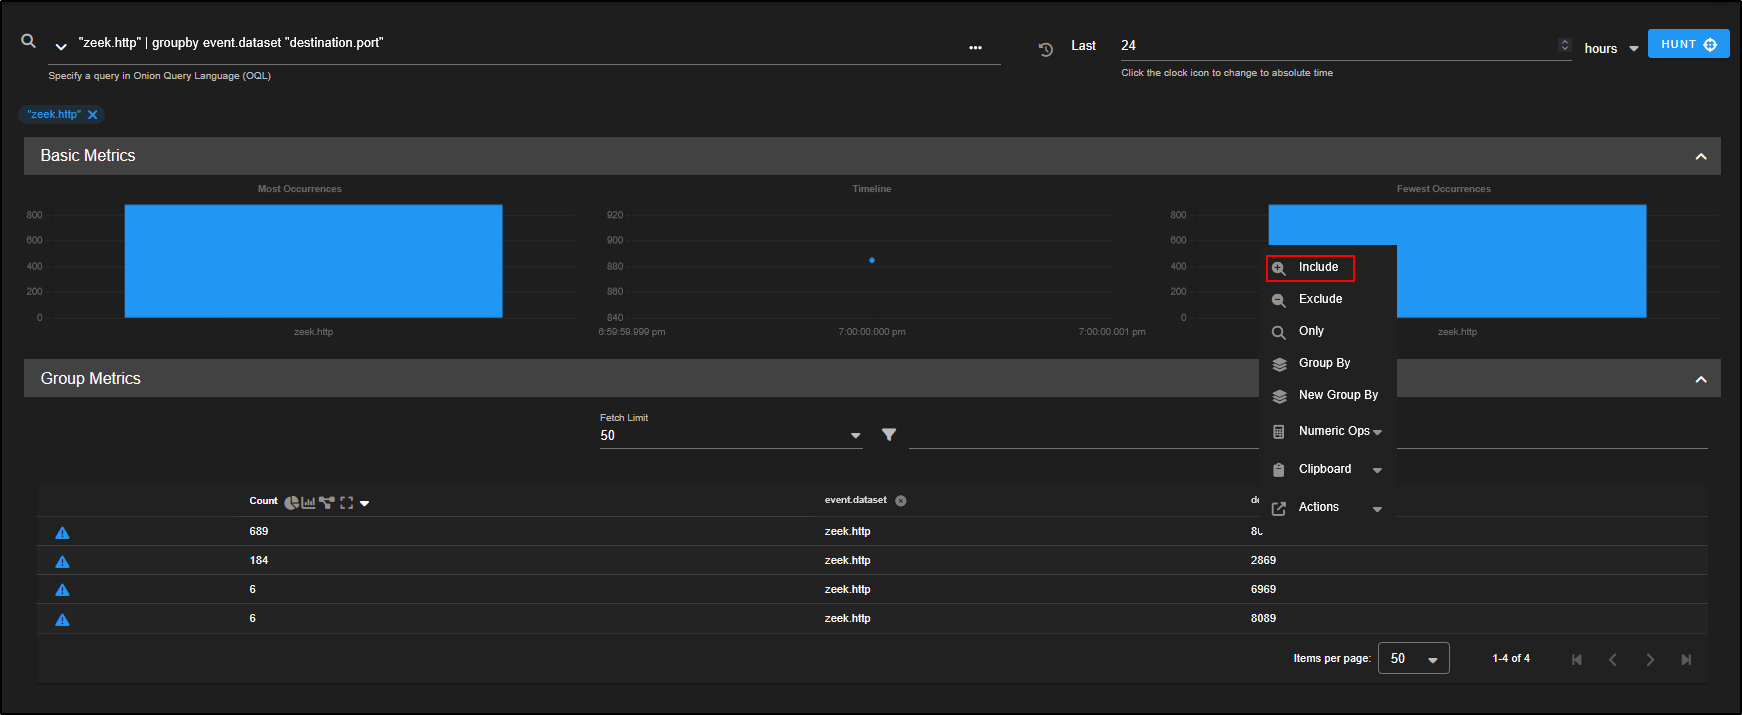
Now that we have grouped the HTTP logs by destination port, we can see they fall into four distinct buckets. While some use the standard port 80, others are going to non-standard ports like 2869.
To cross-reference this with known alerts:
- Open the Alerts tab in a new browser tab.
- Drill down into the alert titled ET MALWARE Zbot POST Request to C2.
From there, you will see that port 80 is indeed linked to command-and-control (C2) HTTP traffic, confirming its relevance to our investigation.
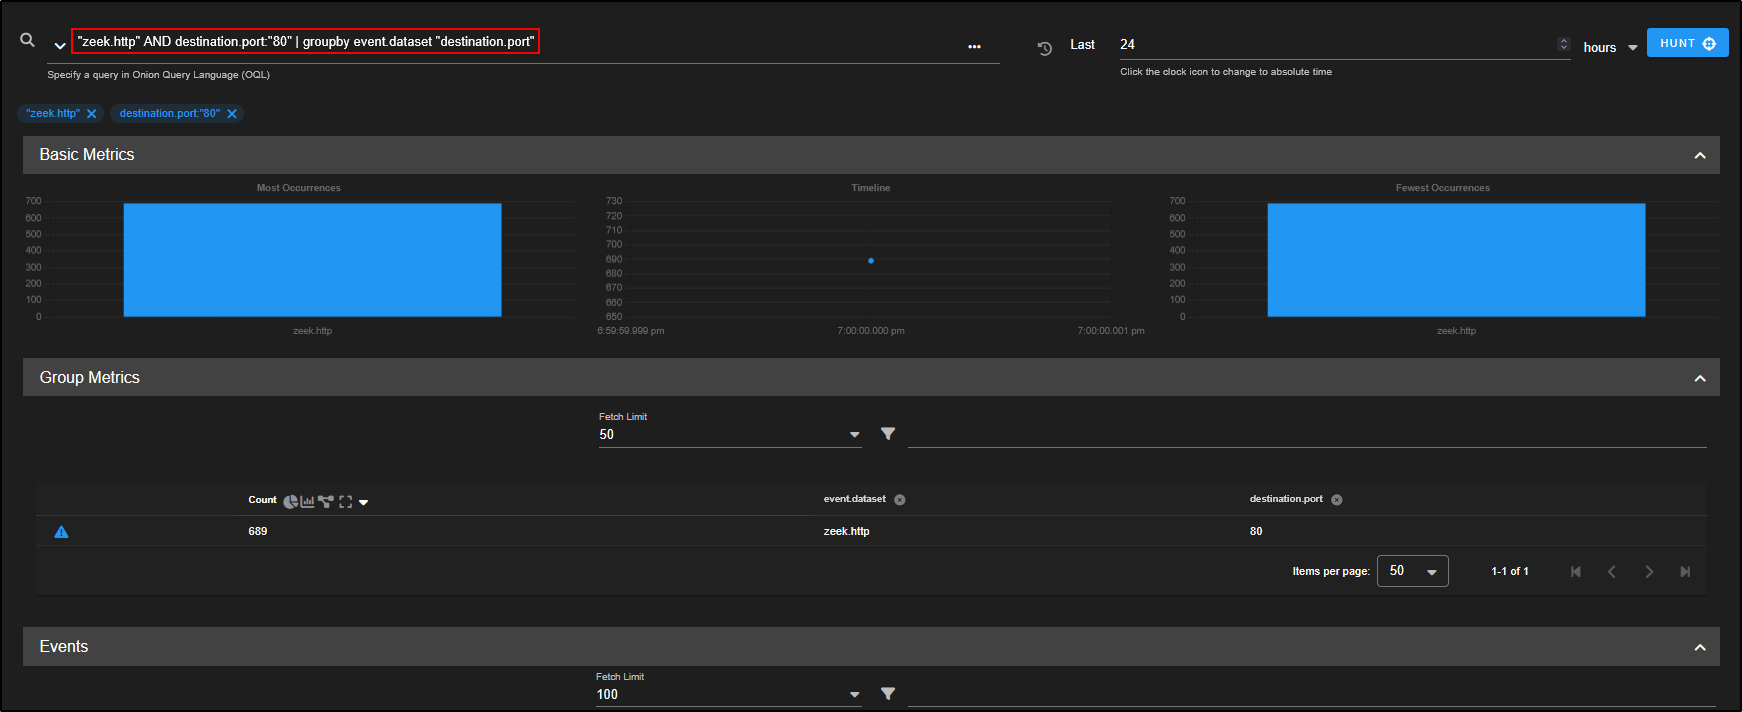
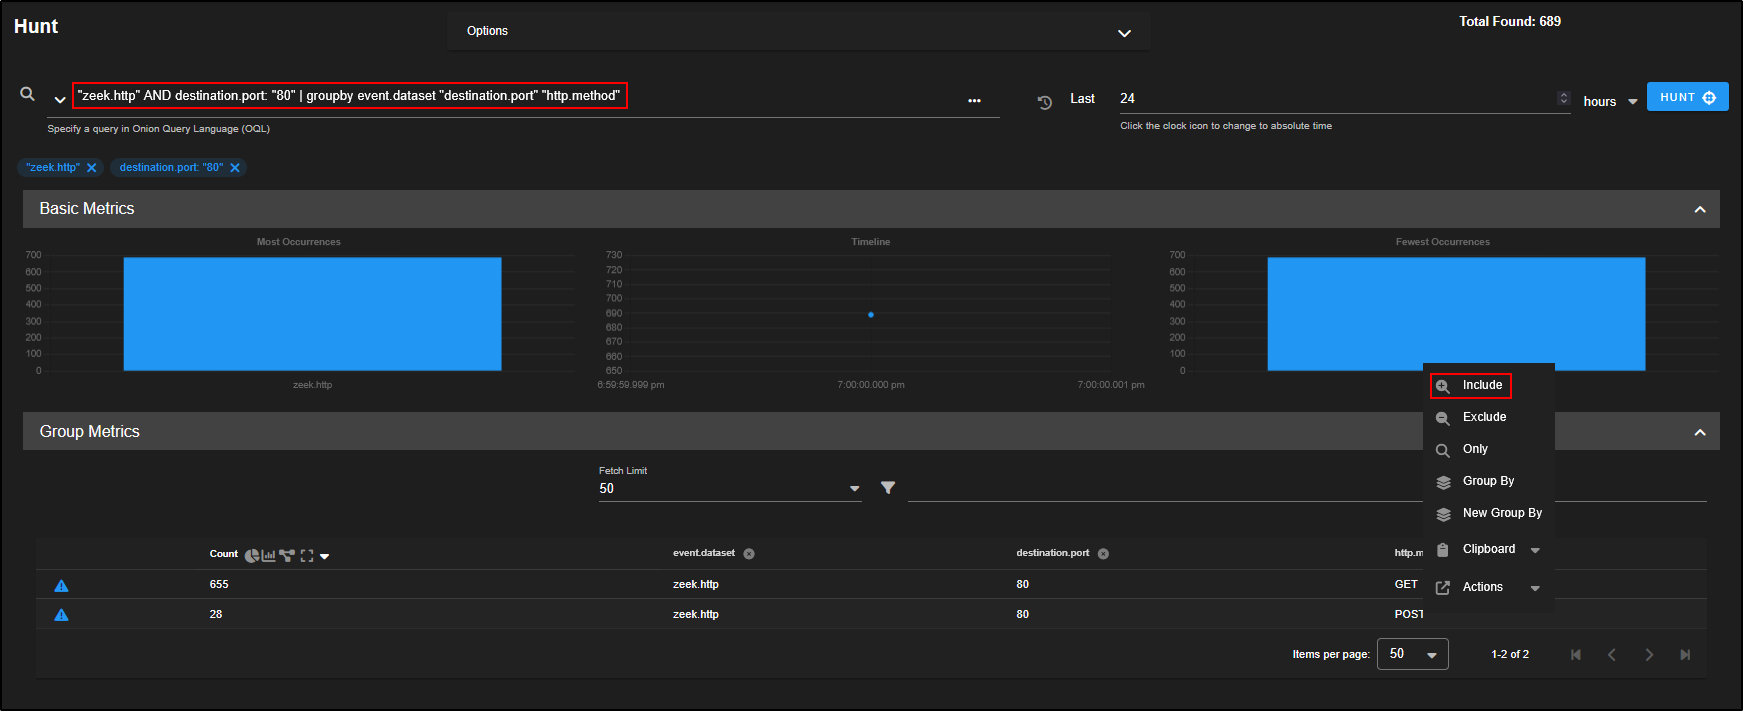
Back on the Hunt page, to focus specifically on HTTP traffic using port 80 (which we now know is linked to malicious activity):
- Click on the
destination.portvalue 80 in the table. - Select Include.
This filters your results to show only HTTP traffic on port 80 helping narrow your investigation to flows potentially related to Zbot C2 or similar threats.
Your query now reads zeek.http AND destination.port: 80.
This means you are filtering for only Zeek HTTP logs where the destination port is 80 so your results should now be limited to standard HTTP traffic, including any potentially malicious connections using that port (like the Zbot C2 we saw earlier).
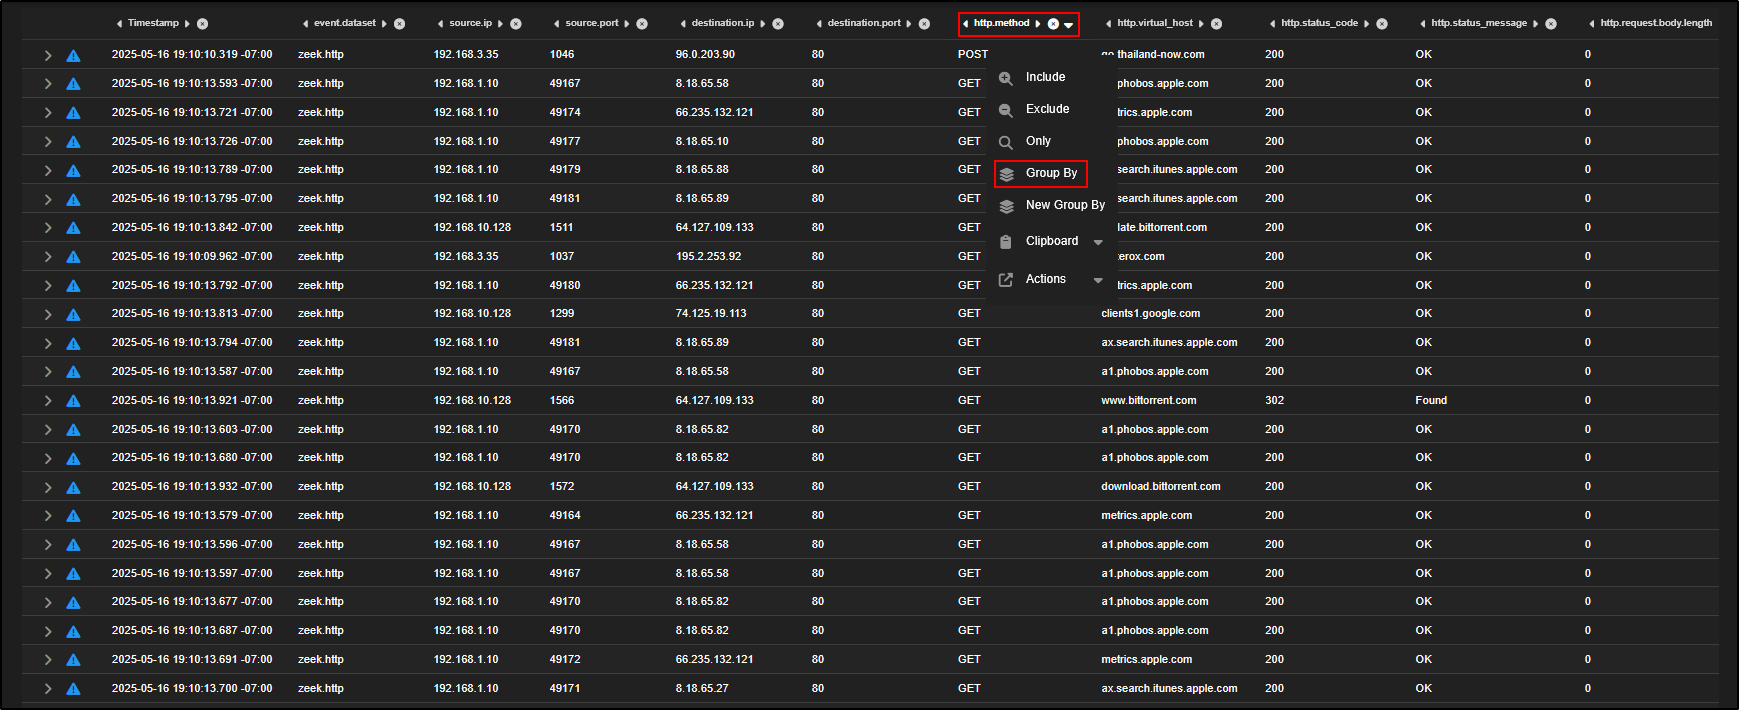
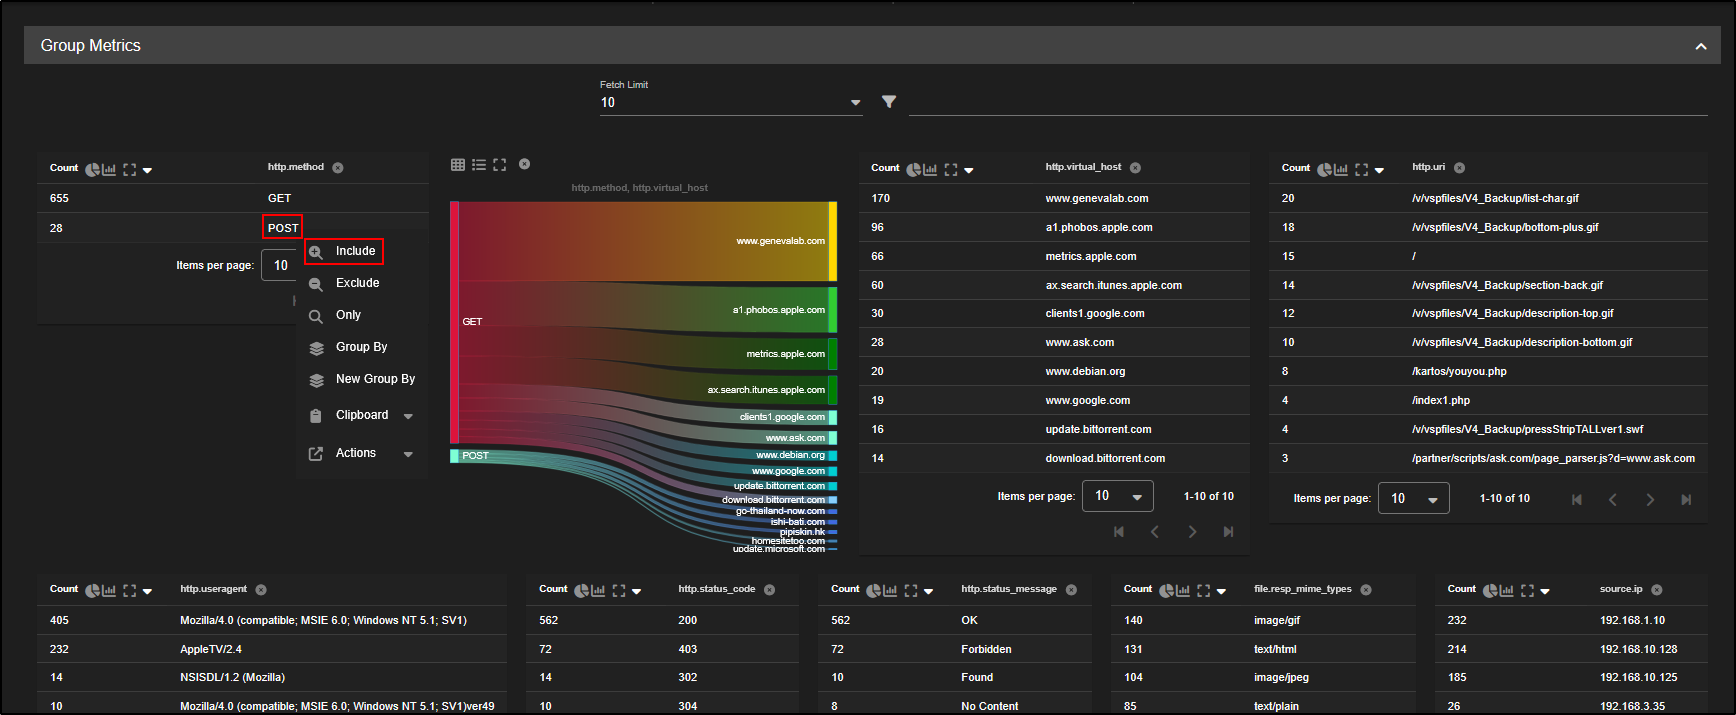
As you scroll through the filtered results, you will notice plenty of GET requests and a few POST requests.
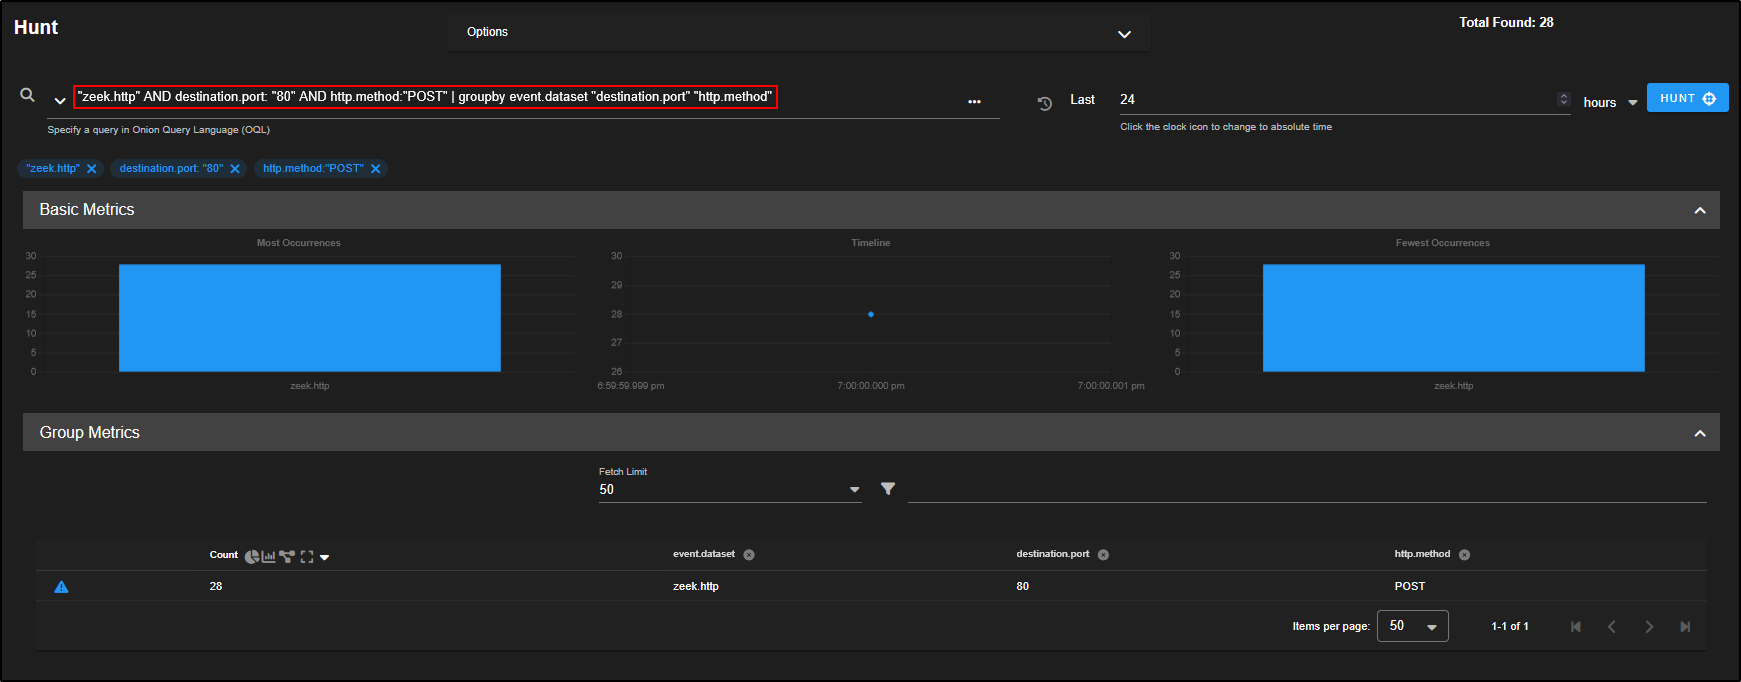
Since the Zbot C2 alert flagged POST requests as suspicious, let’s focus on those:
- Click on the
http.methodfield where it shows POST. - Select Group By.
This will group your data by HTTP method, allowing you to isolate and analyse the POST requests more easily which are often associated with data exfiltration or C2 communication.
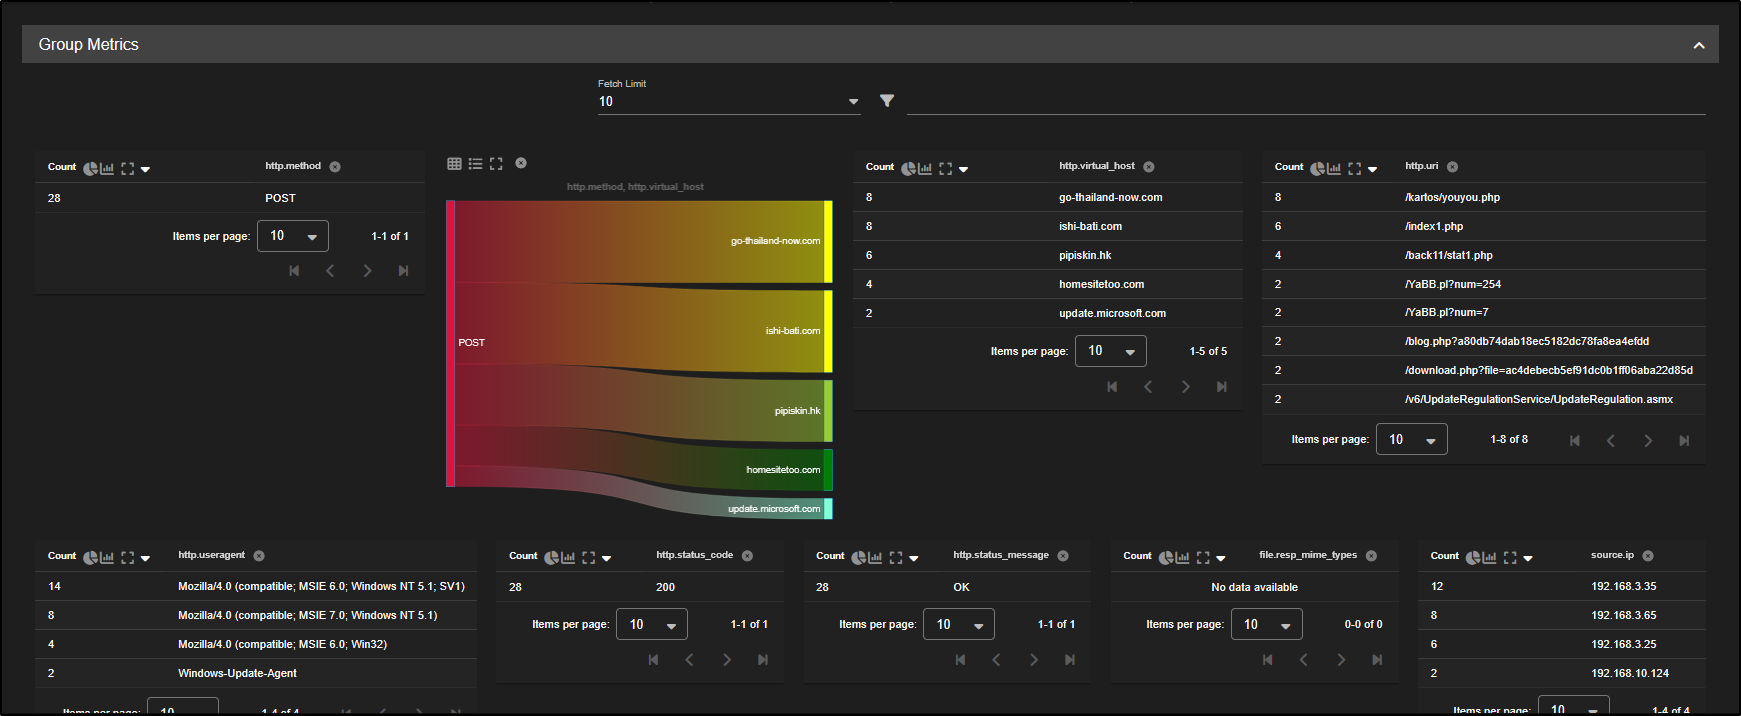
To focus on the POST requests, click on POST and select Include.
We can now see zeek.http requests using POST http method.
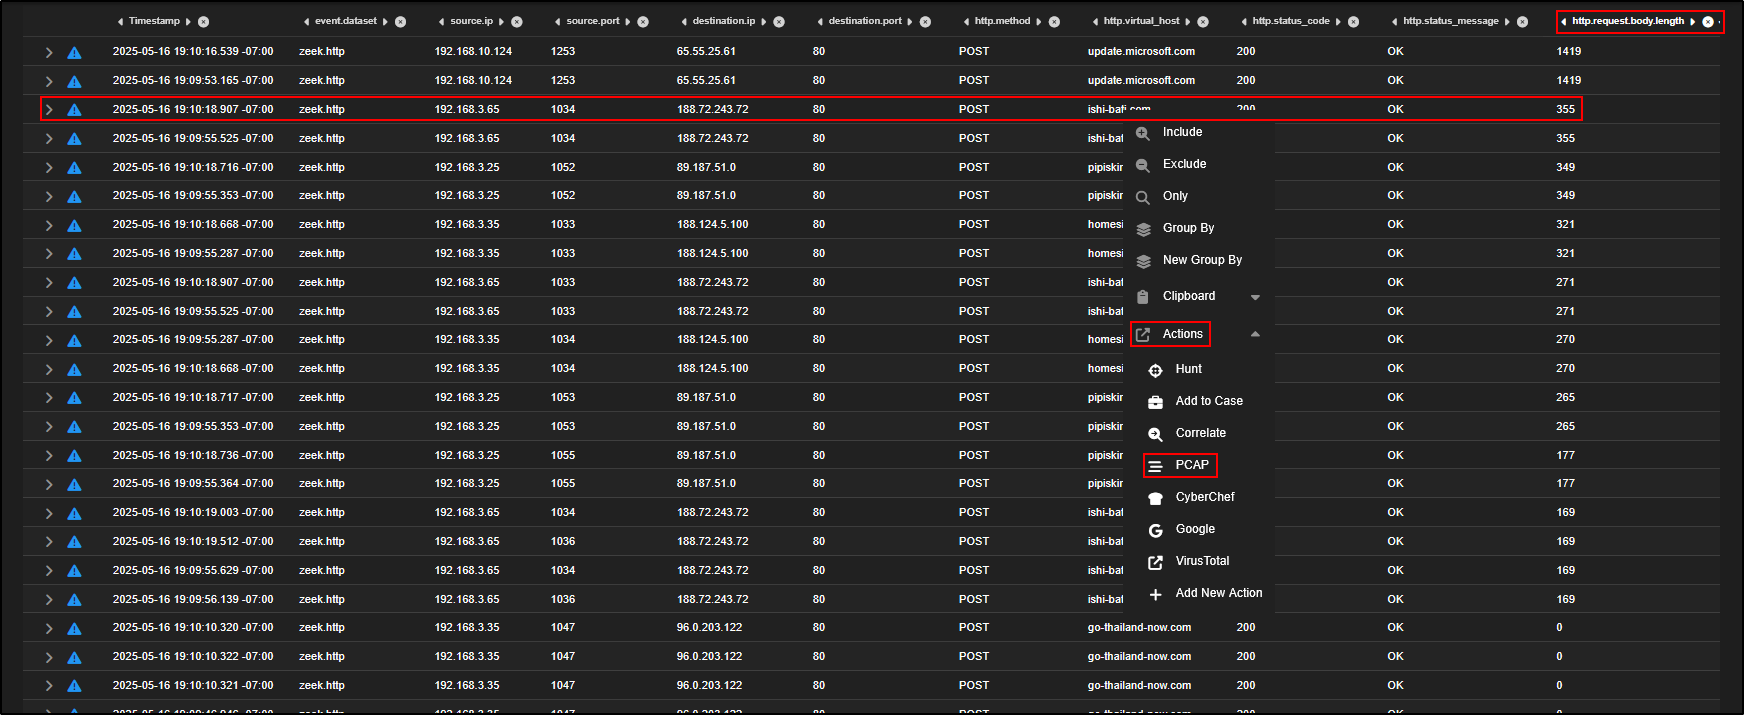
As you scroll down, you will now spot the same source IPs that were identified in the alert:
192.168.3.25, 192.168.3.35, and 192.168.3.65 which is a strong indication of a match.
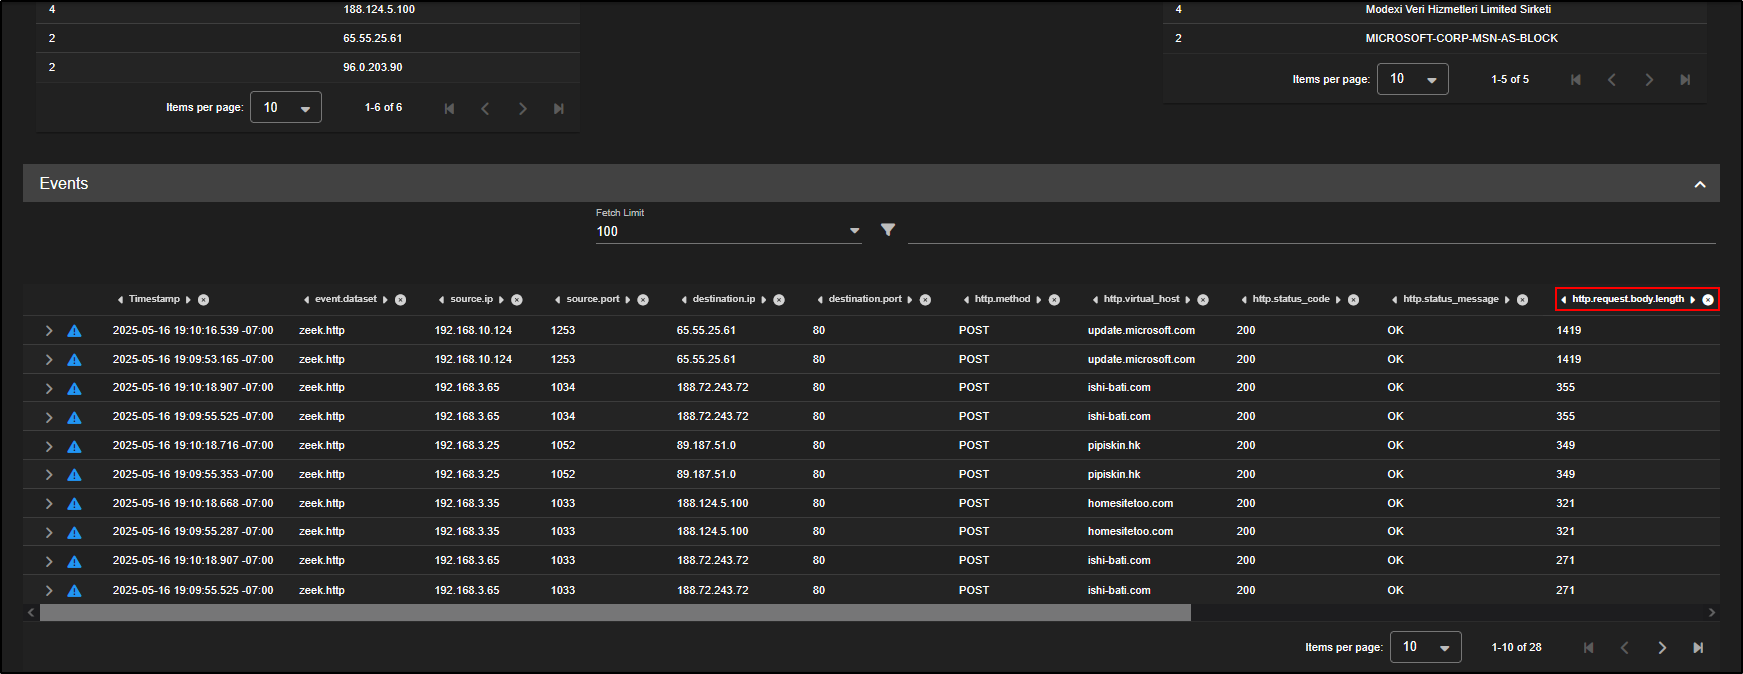
To investigate further:
- Click on the
http.request.body.lengthcolumn header to sort the events by payload size. This helps surface larger POST requests which may contain encoded or exfiltrated data. - Find the first event from 192.168.3.65.
- Click Actions, then PCAP to open a packet capture view of that session.
This gives you a direct look at the traffic, making it easier to identify signs of malware communications like beaconing or data uploads.
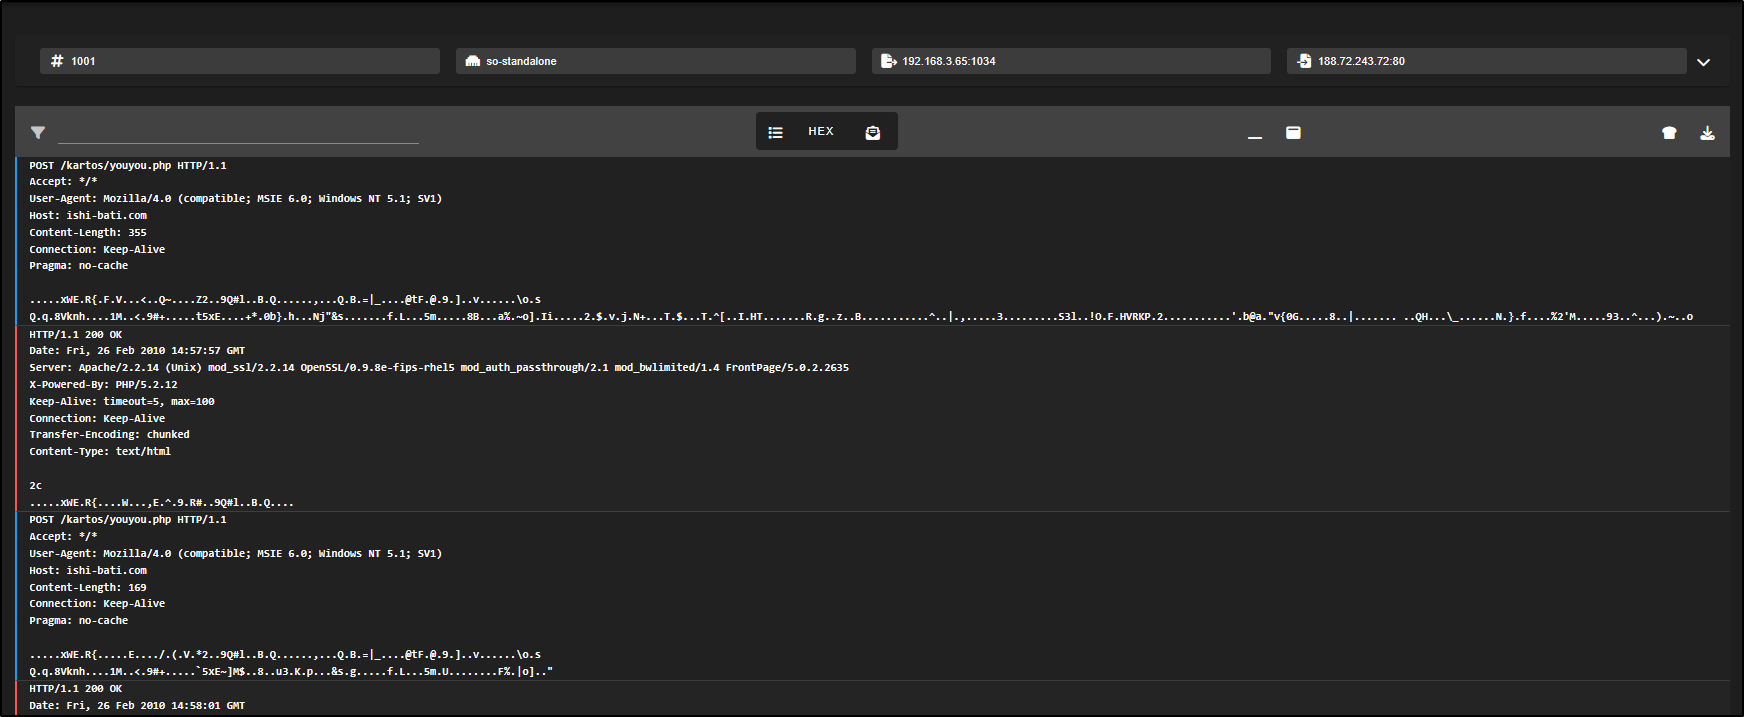
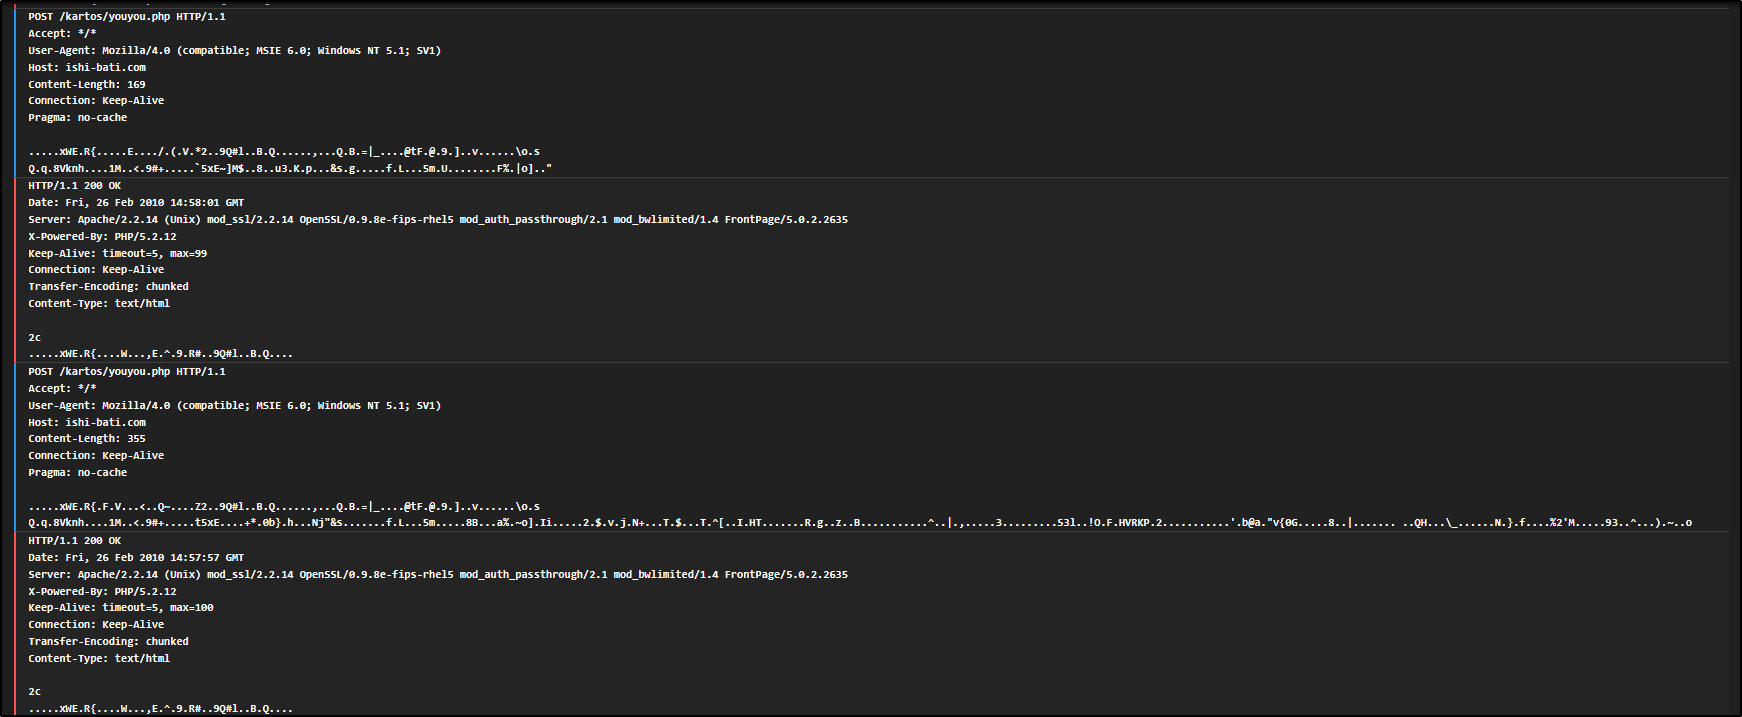
This is a typical example of beaconing behaviour, where an infected system is quietly reaching out to a remote server to check for instructions. We can tell because we are seeing repeated, identical HTTP POST requests being sent to the same URL (youyou.php).
Each of these requests contains encoded binary data, likely being sent to a command-and-control (C2) server. The fact that the requests are structured the same way and sent at regular intervals strongly suggests they are automated, not made by a person using a web browser, but by malware or a background script.
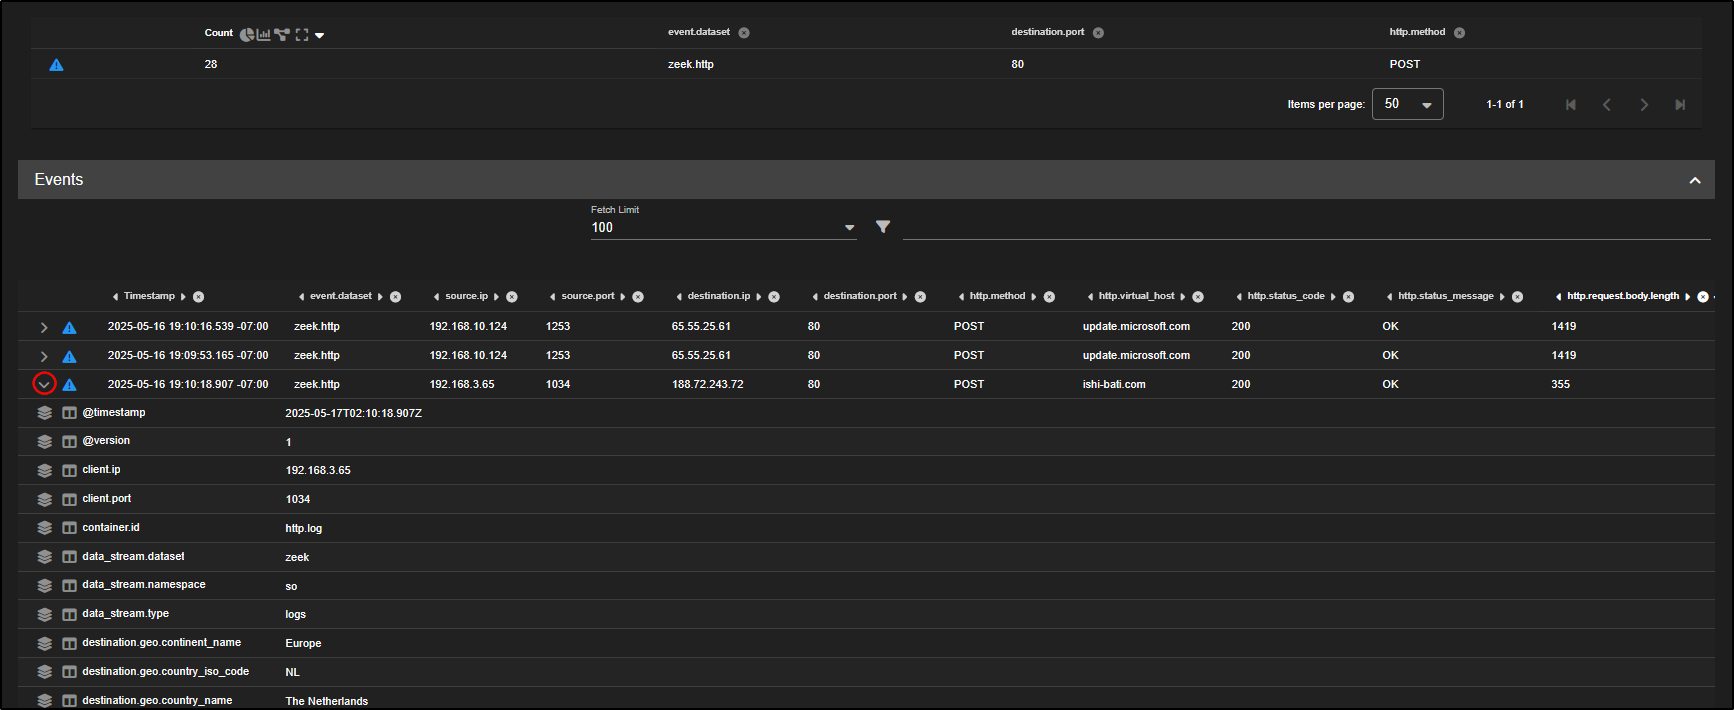
If we go back to the Hunt page and expand one of the logs, we will see a field called log.id.uid. This is an internal ID used by Zeek to link together multiple logs from the same network flow like connection records, HTTP logs, and file transfers, making it easier to follow the full picture of what happened.
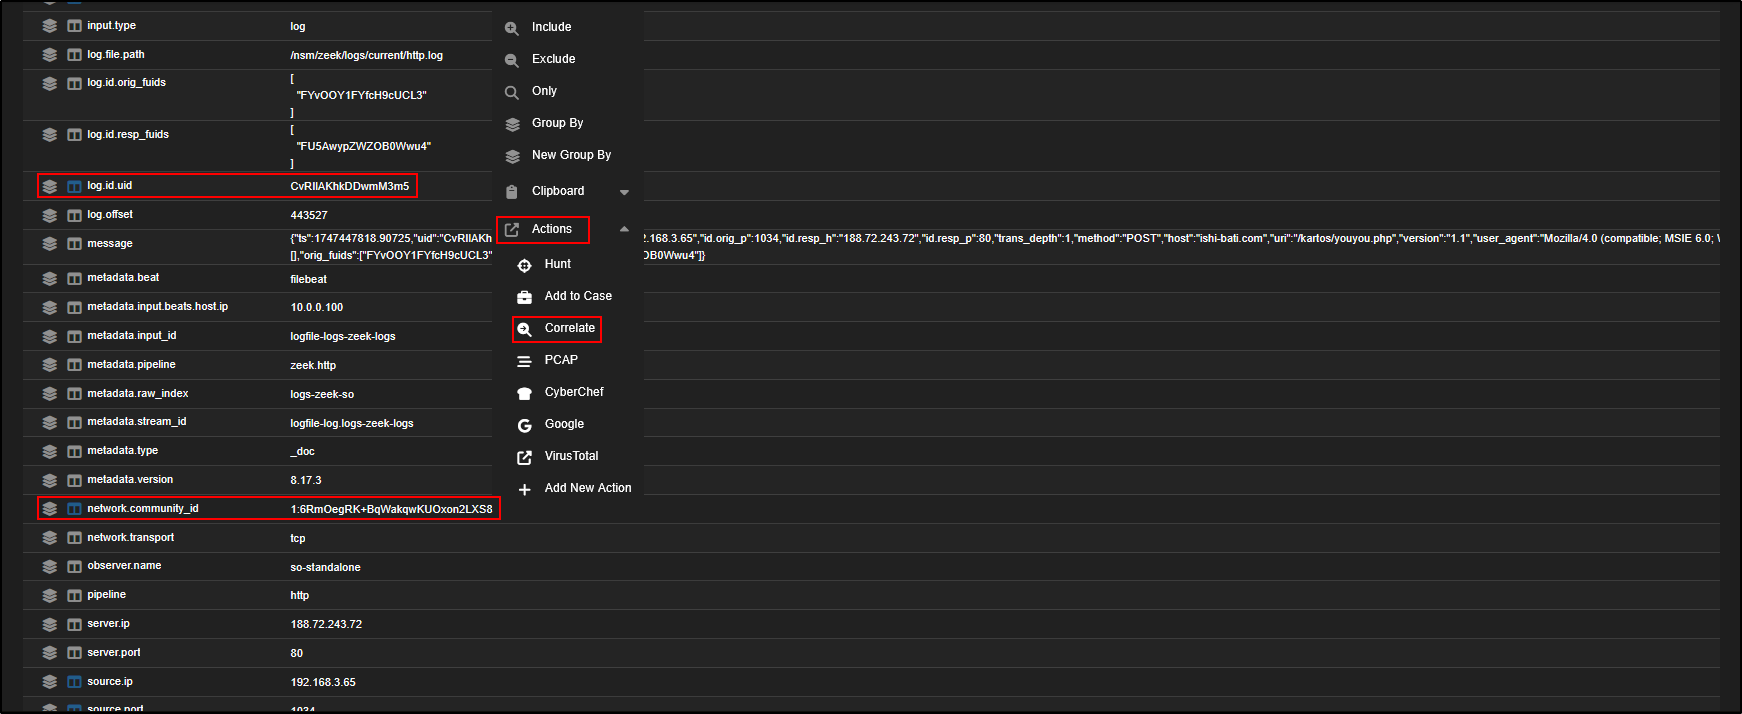
There is also a field called network.community_id. This is a unique hash made up of the source and destination IP addresses, ports, and protocol. It helps analysts correlate related events across tools like Zeek, Sysmon, firewall logs, or Elastic Agent data.
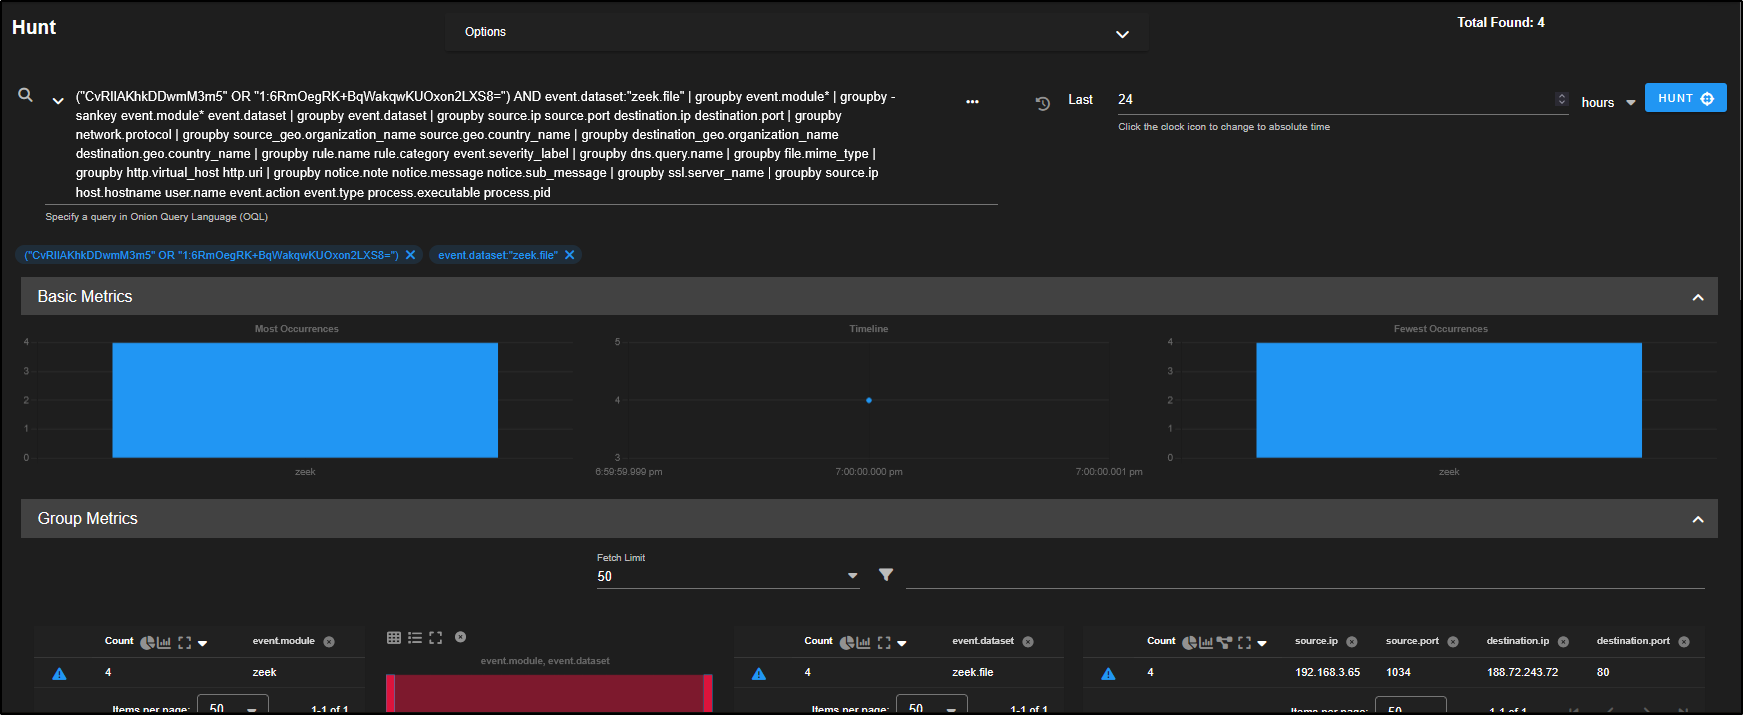
To see all related logs for this HTTP event, just click the network.community_id field and choose Actions → Correlate. This will bring up all events tied to that same flow for deeper investigation.
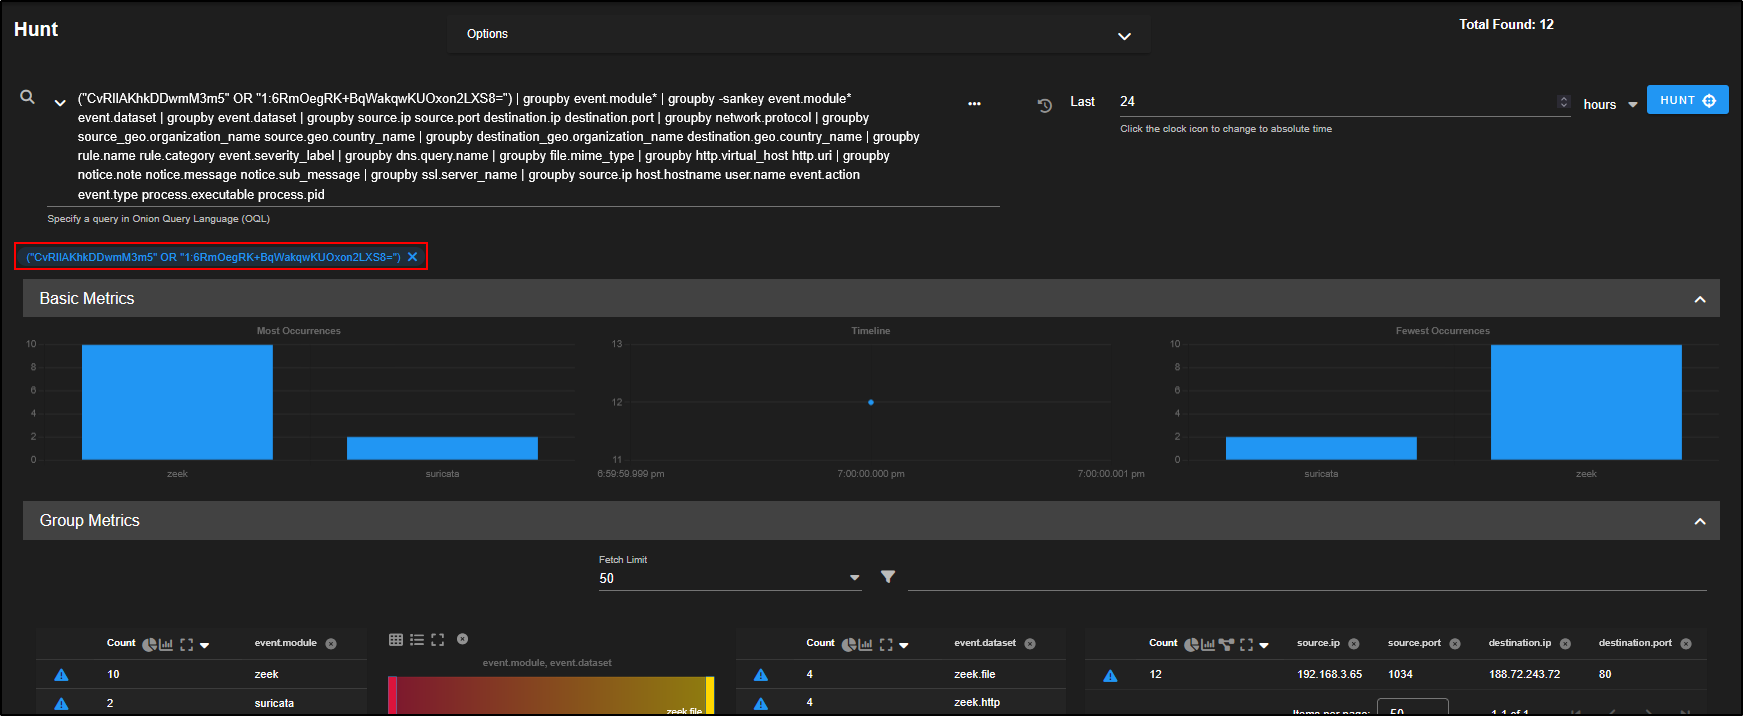
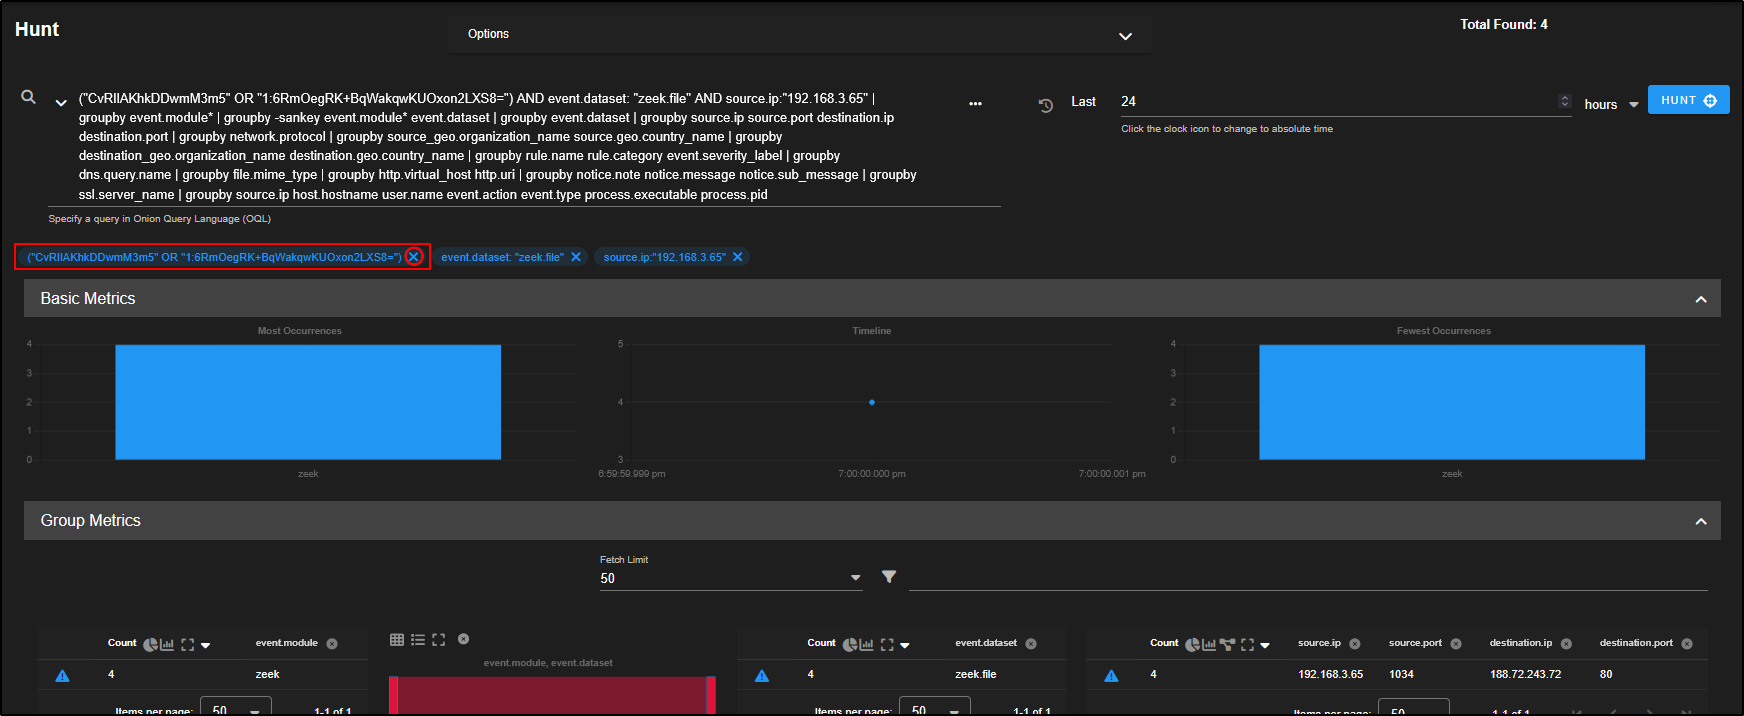
This opens a new Hunt window with an OR query that includes both the log ID and the community ID from the selected HTTP event.
This query pulls in all related data so you can now view everything Security Onion has recorded about that flow, across different sources, all within the tables and visualisations on this page.

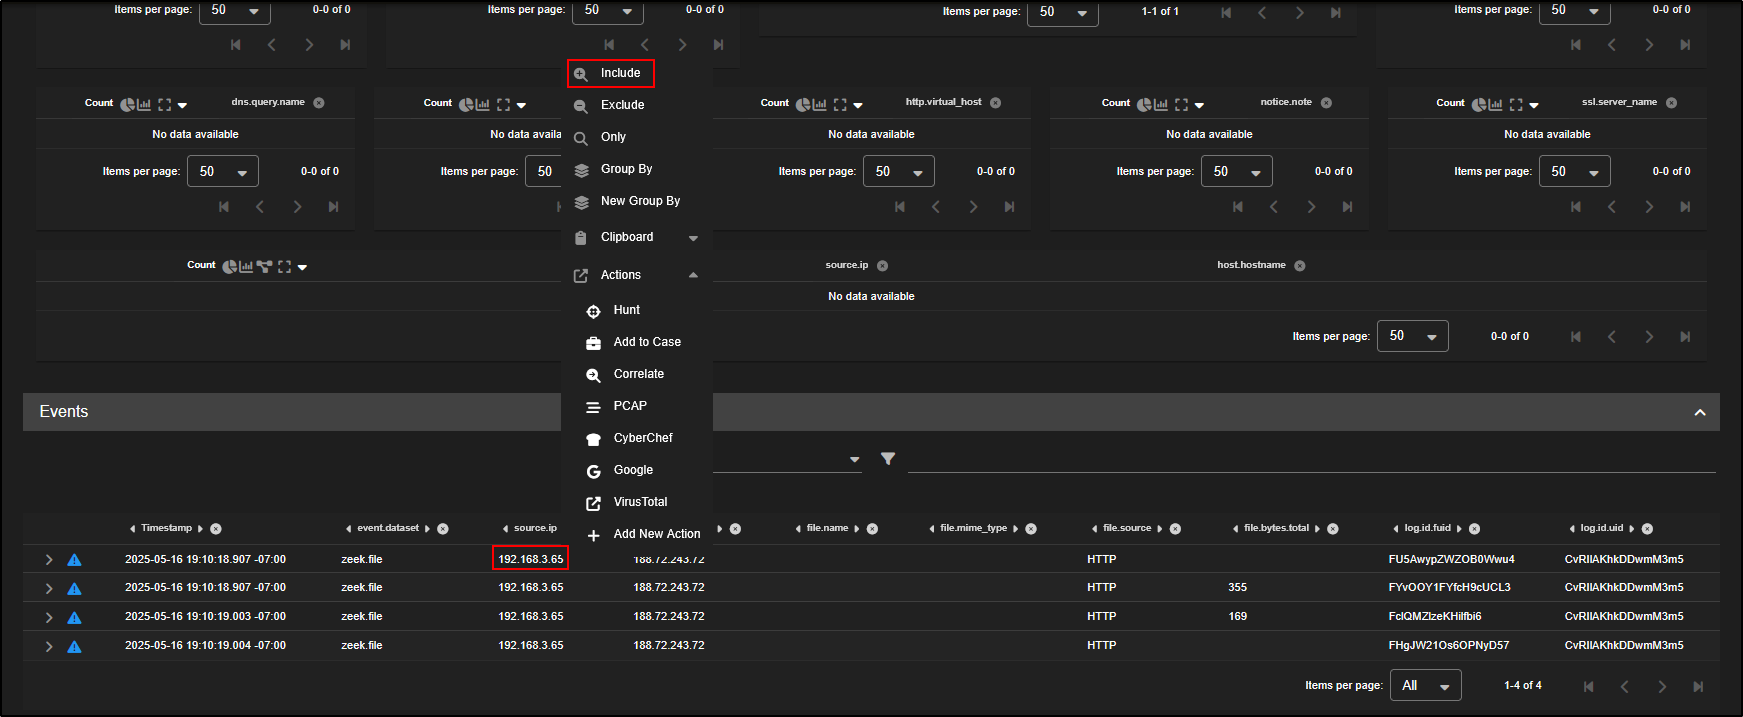
We can focus on the zeek file records by clicking on zeek.file and selecting Include.
As you scroll down, you will see the individual events tied to that network flow.
If these events occurred further along the attack chain, they may reveal what the attacker exfiltrated or accessed from your environment giving you insight into what data may have been compromised.
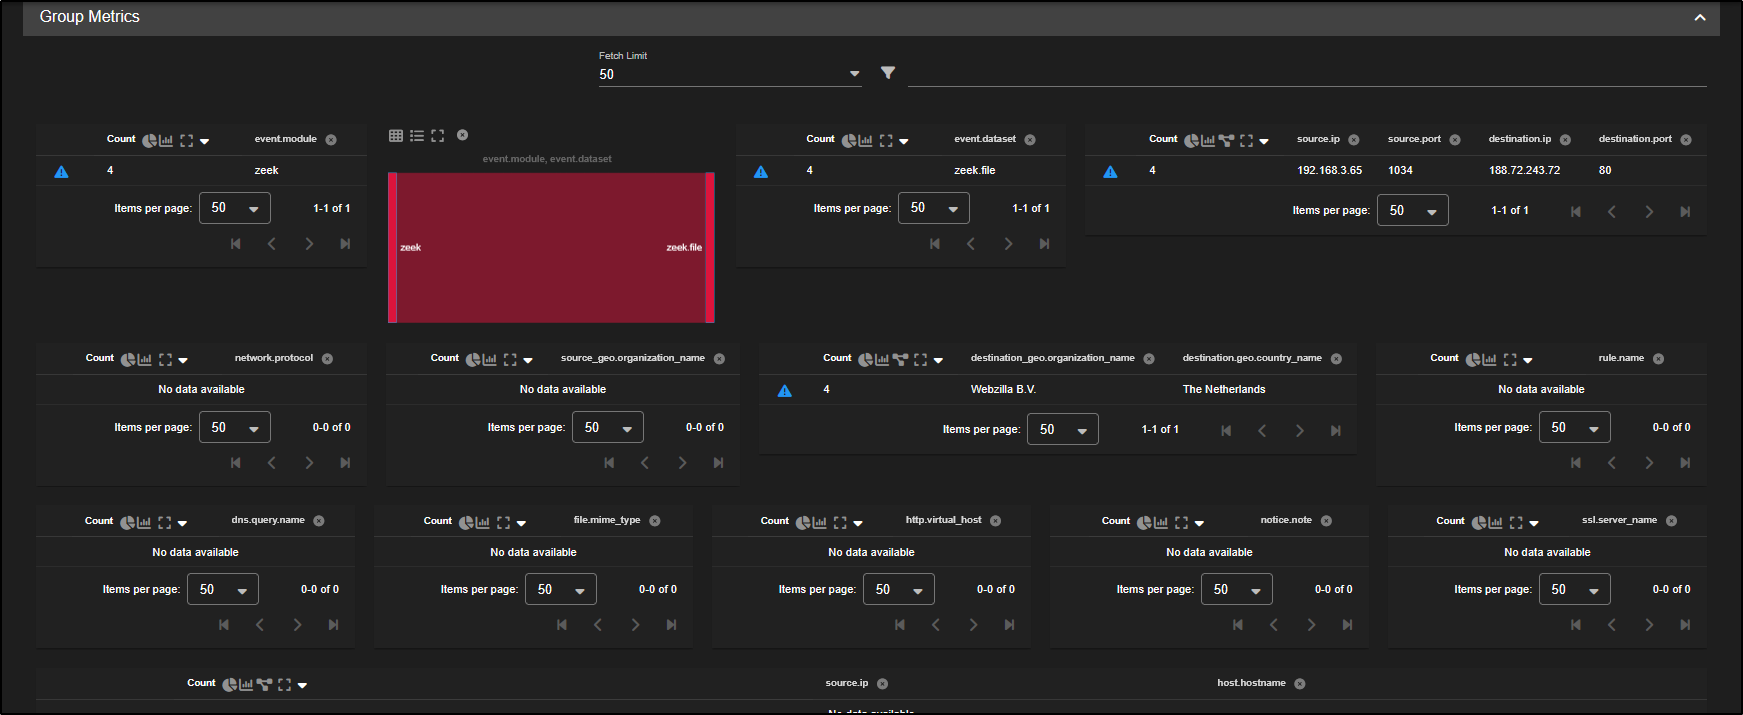
To work out where the initial infection came from, we will need to examine other Zeek file logs linked to the same system.
Click on the source IP address and choose Include. This filters the Hunt results to show only activity involving that particular host, helping you trace the infection’s origin.
Remove the community ID filters from your query. This allows you to see all network flows related to the selected source IP, not just the ones tied to a single session.
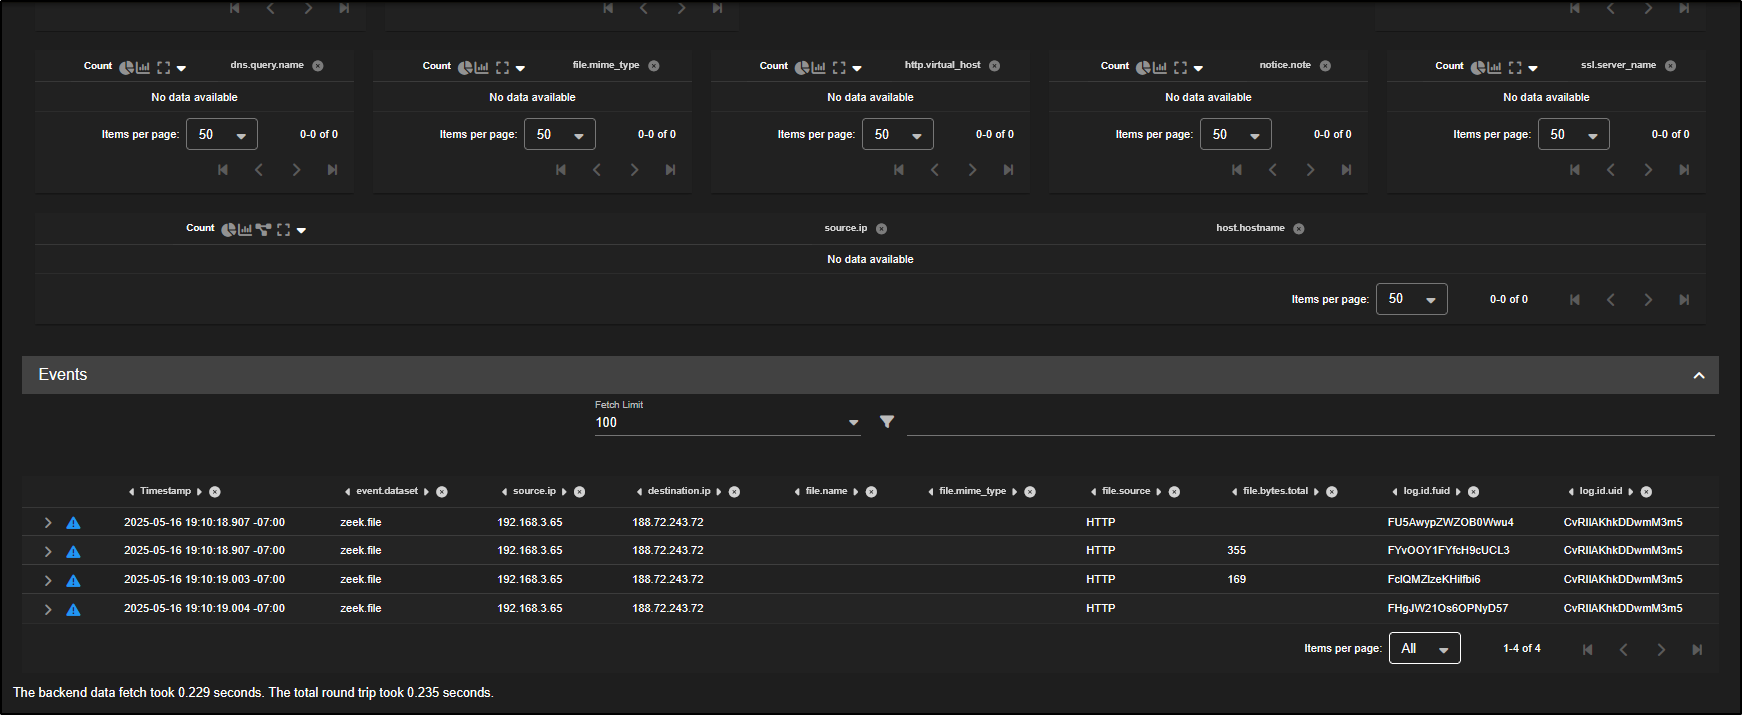
There are 22 different file records linked to the source IP 192.168.3.65, suggesting this host has been involved in multiple file transfers, which may include the original point of infection.
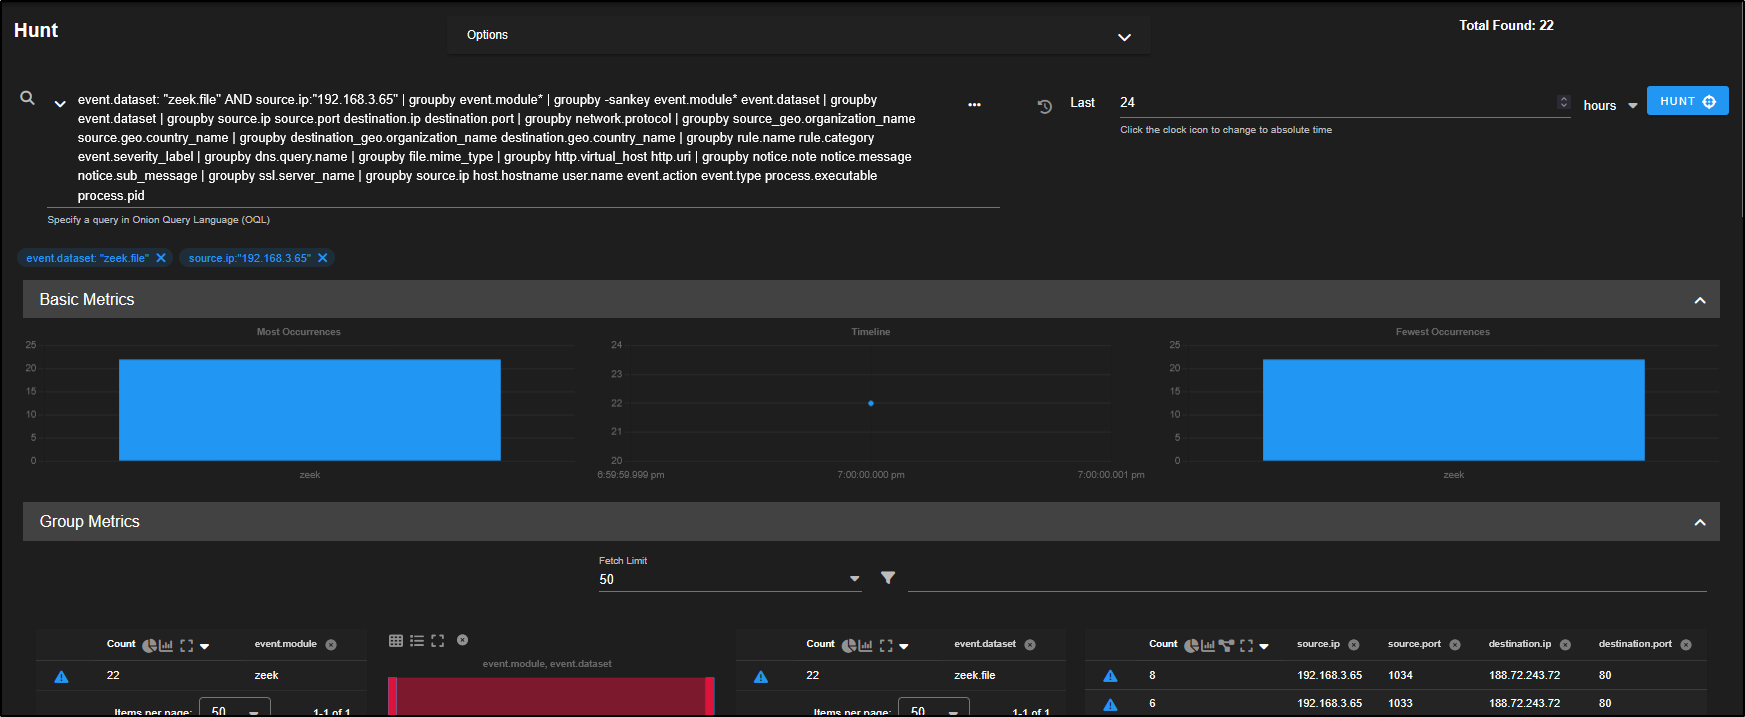
As we scroll down, we notice one file is a Windows DOS executable which is a potential indicator of a malicious payload or the initial infection file. This needs a closer inspection.
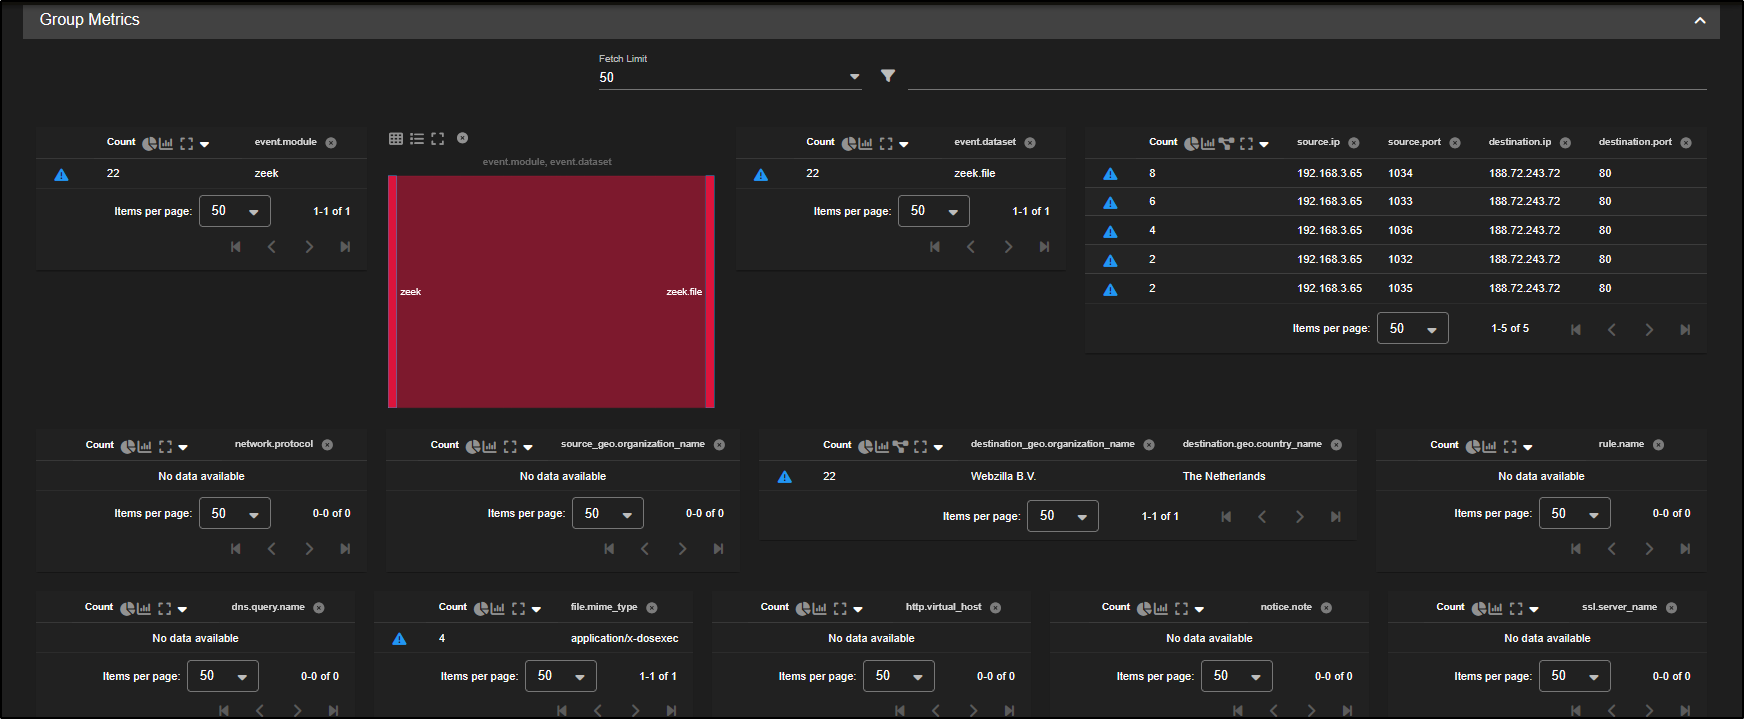
The next step is to extract the executable from the PCAP file to confirm whether it was the initial point of compromise. After that, you can hunt across your network to check if any other systems have downloaded or executed the same file.
The Hunt interface is designed for analysts to quickly explore and interpret collected data, allowing you to summarise patterns, compare records, and pivot between different log sources during an investigation.
The Dashboards feature offers similar functionality but with a wide range of prebuilt visualisations for specific use cases.
To get started, go to the Dashboards tab in the SOC web interface.
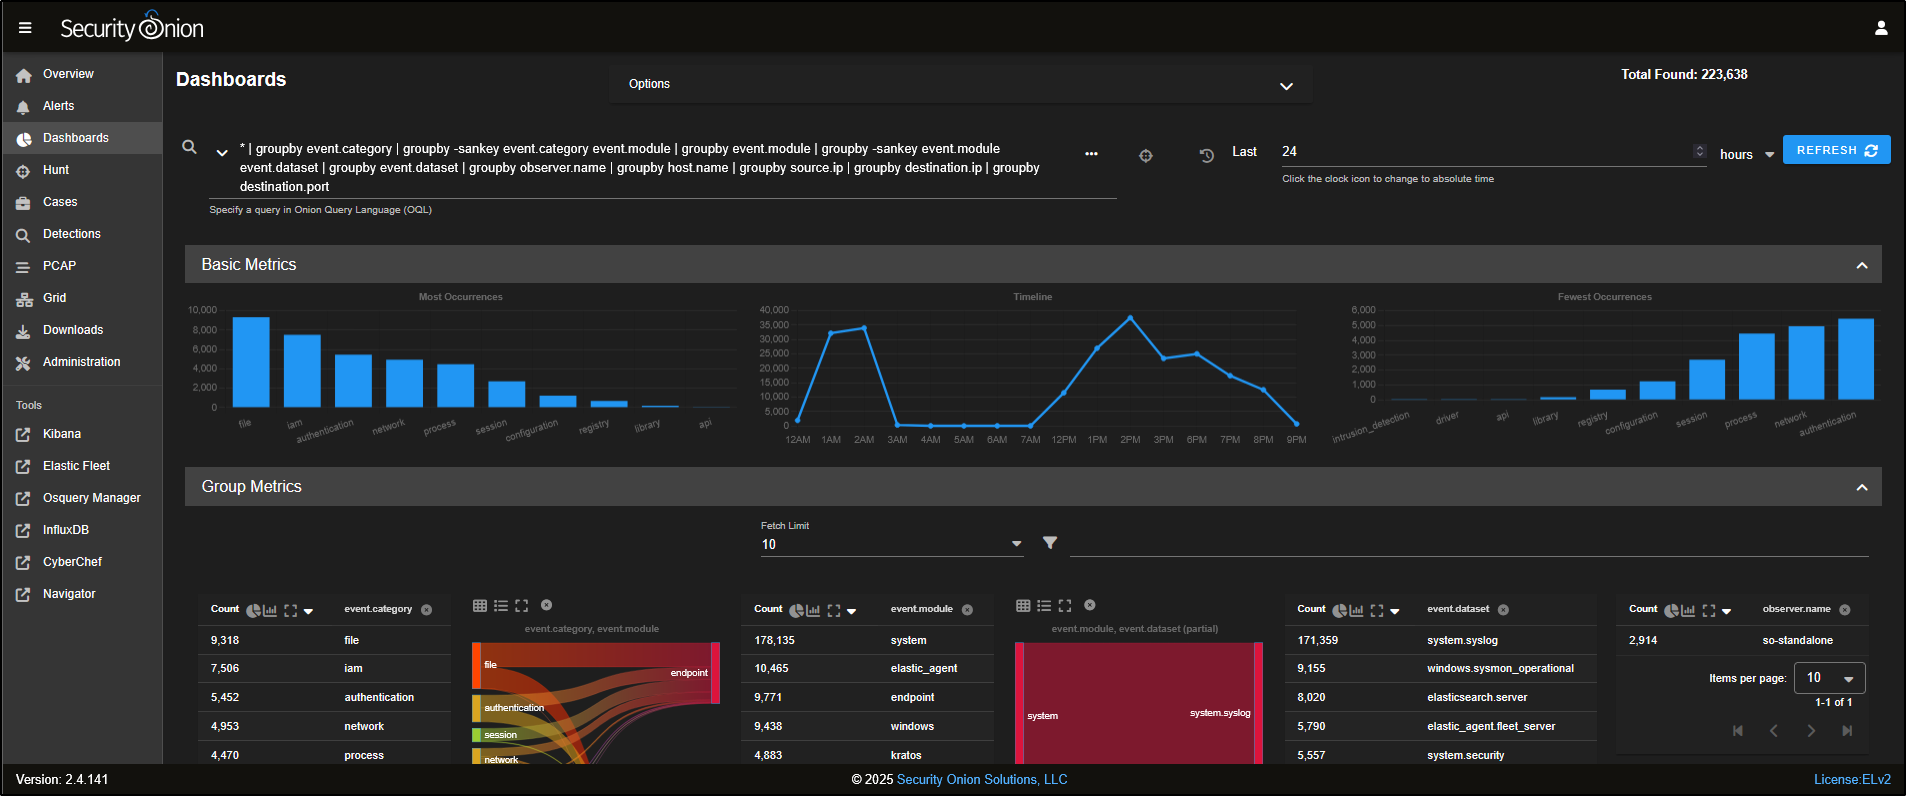
The default view gives a high-level summary of all data within Security Onion, presented through SANCII diagrams, bar charts, pie graphs, and tables that break down each dataset.
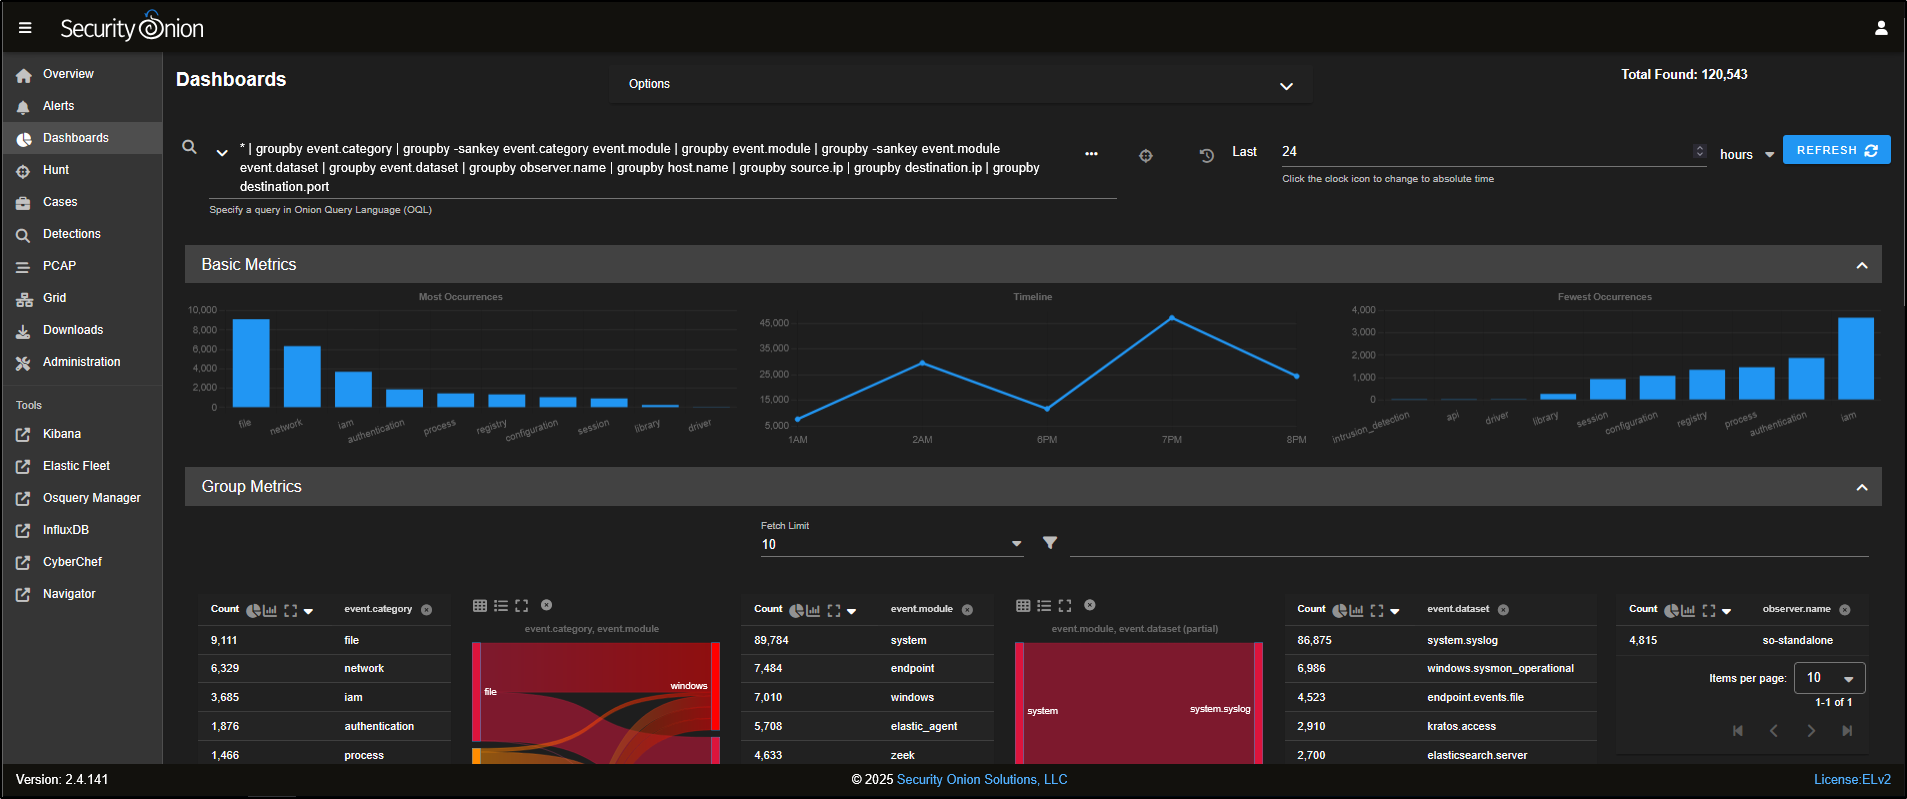
Besides the default overview, there are several prebuilt dashboards tailored to specific protocols and data sources.
If you would like to carry out a similar threat hunt via Dashboards, a good place to begin is the HTTP dashboard, which focuses specifically on HTTP traffic patterns and related events.
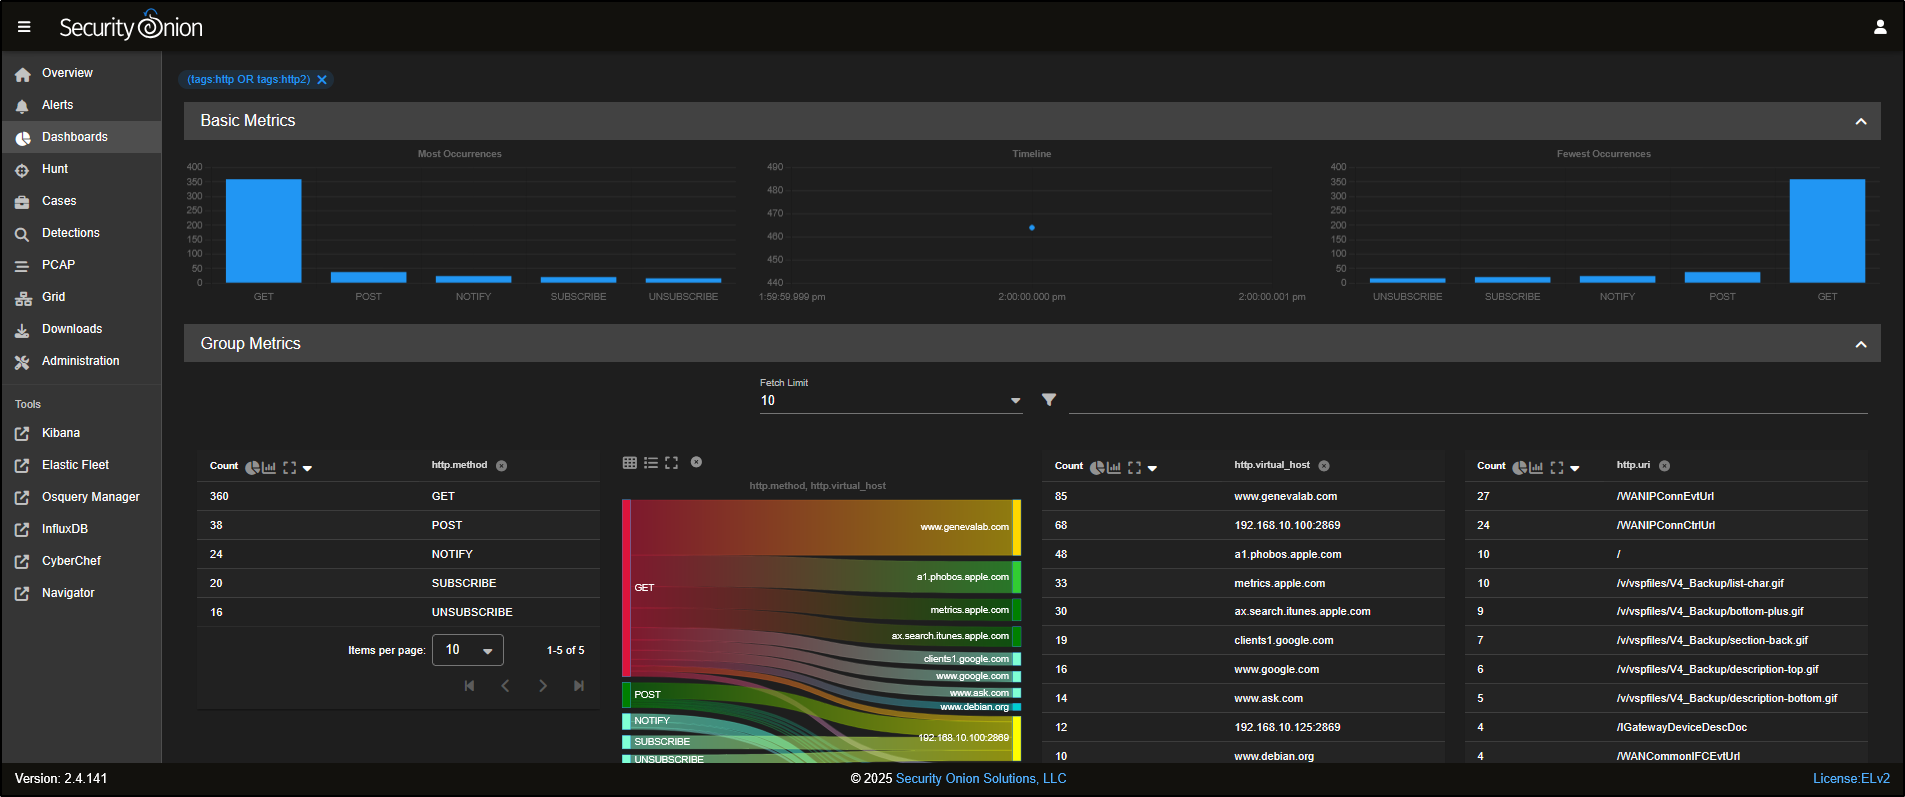
You will see a variety of tables and visualisations that summarise all HTTP connection data.
To filter for port 80 traffic, you can do it just like in the Hunt interface, by selecting destination.port 80 and choosing Include to narrow the results.
Scroll down the dashboard, find destination.port 80, and click Include to filter the results to show only HTTP traffic using port 80.
To focus on POST requests, scroll to http.method, click on POST, and choose Include. This will filter the dashboard to show only HTTP POST traffic.
The dashboard now displays only HTTP POST requests, allowing you to focus your analysis on traffic that may indicate data uploads or command-and-control activity.
Scroll down and sort the tables by http.request.body.length to prioritise entries with larger POST payloads. You should now see the same suspicious activity identified earlier in the Hunt interface, confirming consistency across both views.
Both Dashboards and Hunt pull from the same underlying data. They just offer different ways of interacting with it.
You can use either interface for threat hunting and investigations, depending on whether you prefer visual summaries or a more flexible, query-driven approach.
Detection Engineering
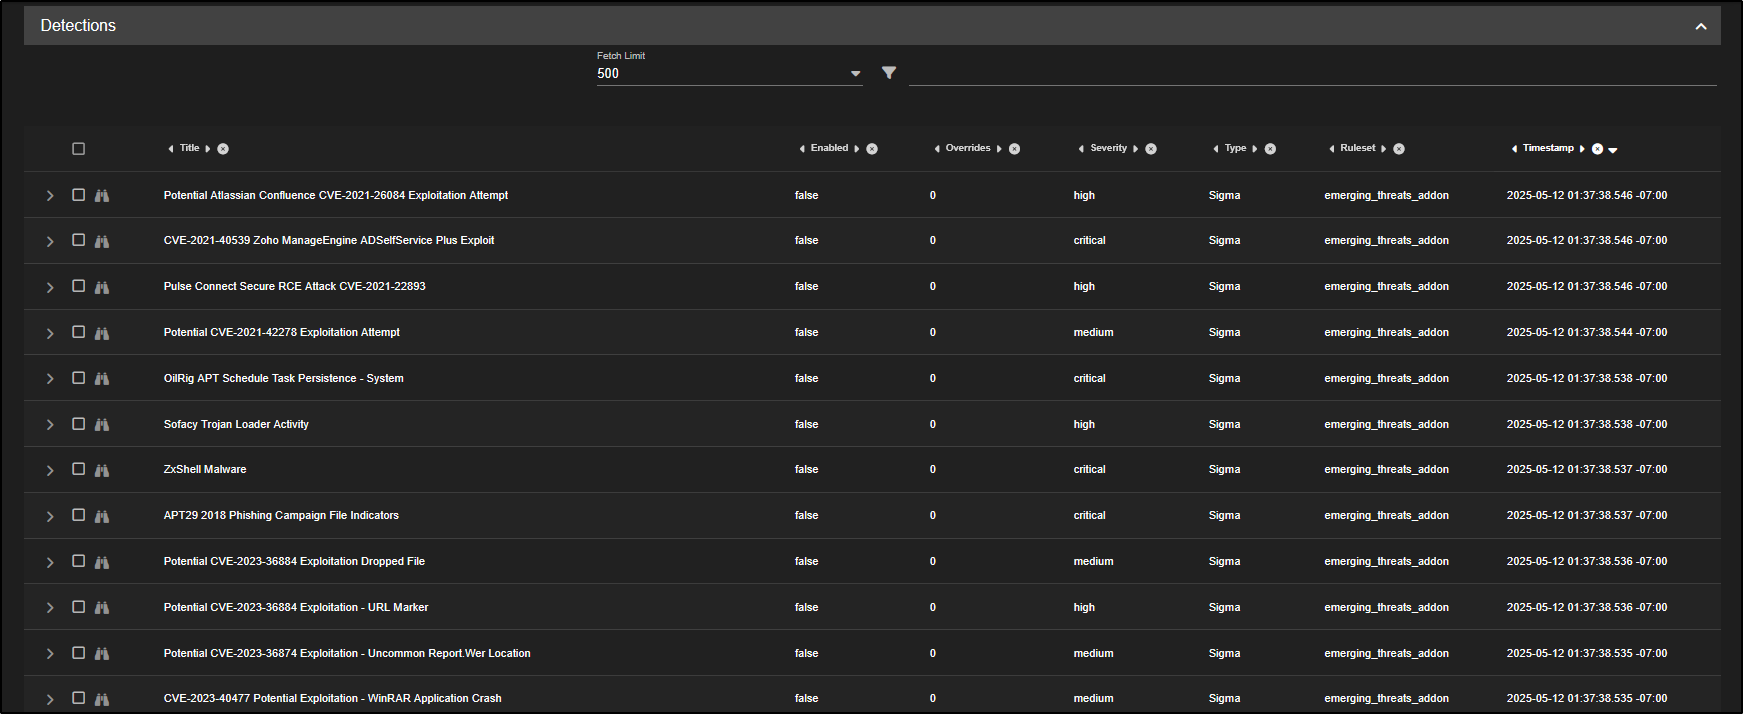
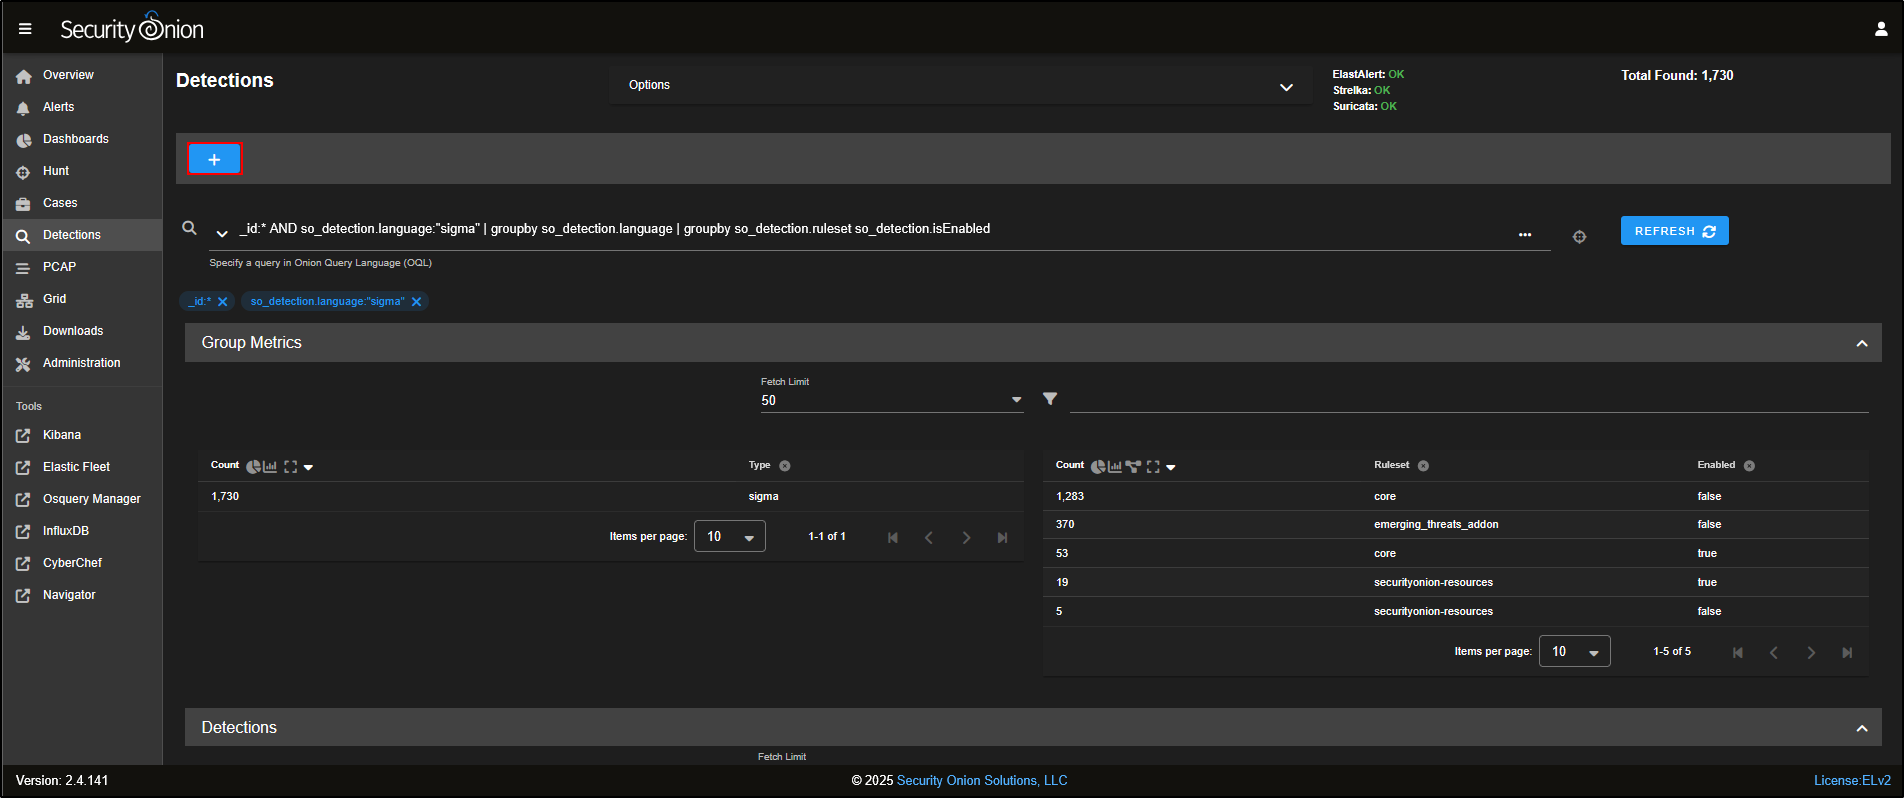
Go to the Detections section in the SOC web interface. By default, it displays all available rules, grouped by detection language.
Security Onion supports three types of detection rules, each tailored for a specific purpose:
- Suricata rules are used for network-based detection. These rules scan live network traffic captured on the monitoring interface, looking for patterns such as specific IPs, ports, or keywords. For example, if you wanted to be alerted whenever “PHP” appeared in traffic on port 80, a Suricata rule would suit that need.
- Yara rules are for file-based detection. Security Onion automatically extracts files from unencrypted network traffic such as
.exe,.docx, or.pdfand checks them using Yara rules via the strelka module. These rules are useful for spotting files with suspicious patterns, like those containing malware-related strings or known risky behaviours (e.g. Office macros). If you need to detect an executable signed with a specific certificate, Yara is the way to go. - Sigma rules are used for log-based detection. They work by creating Elastic Query Language (EQL) queries that regularly scan collected logs (like Windows event logs or Sysmon) for known Indicators of Compromise (IOCs). When a match is found, an alert is generated.
Each detection language targets a different layer: network traffic, file analysis, or system logs giving you a wide coverage across the attack surface.
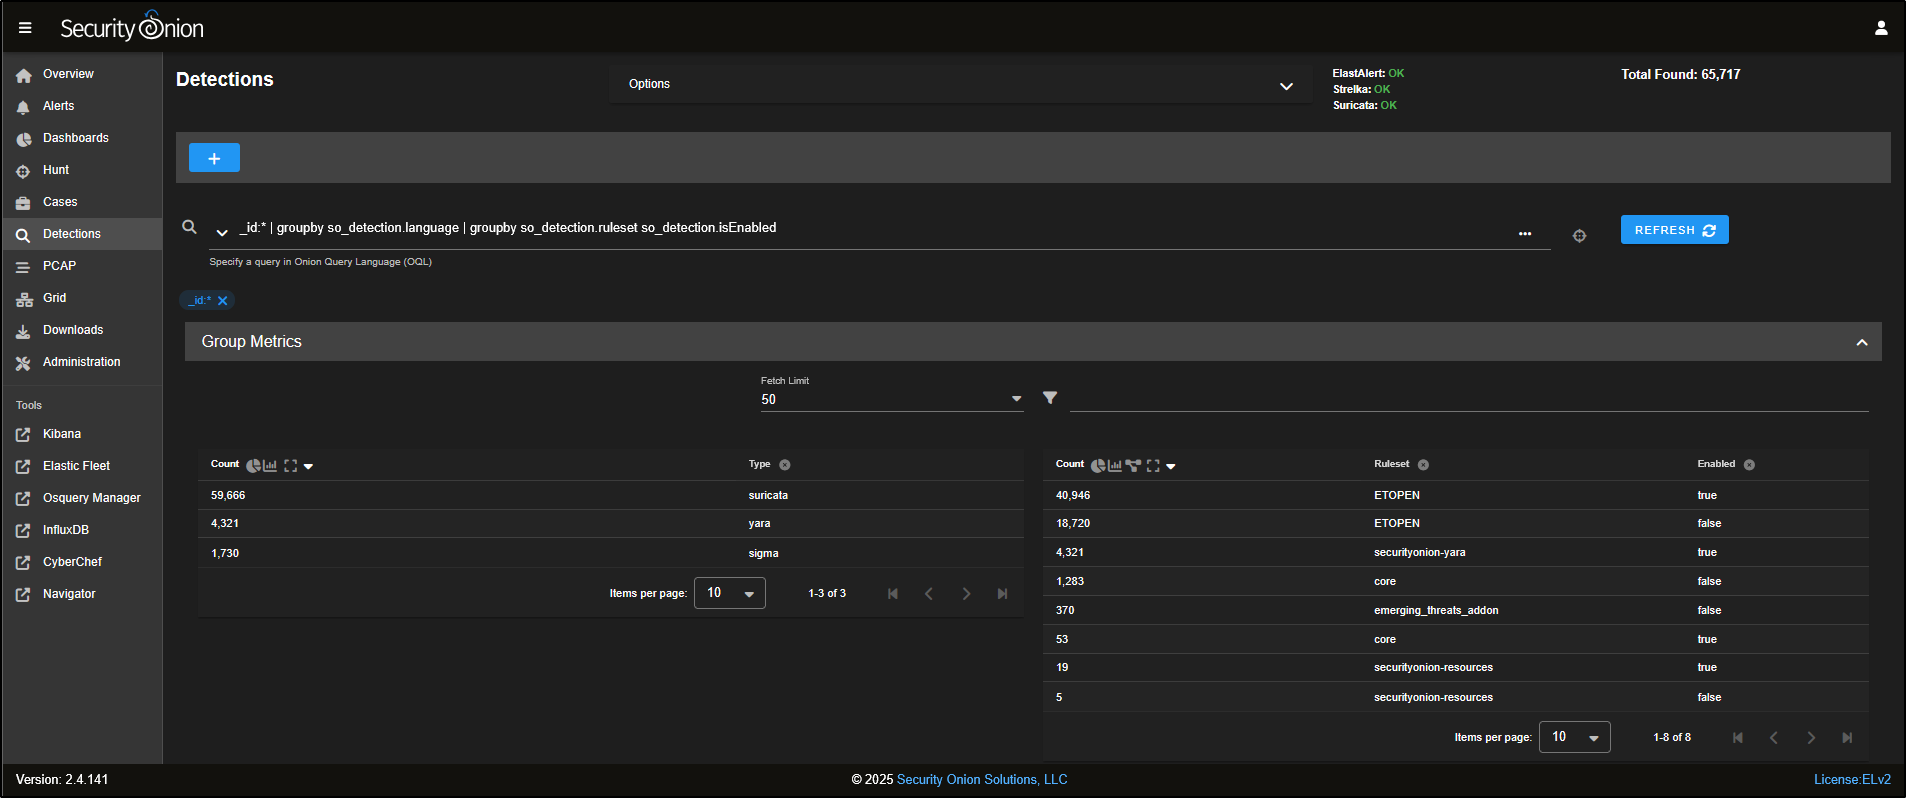
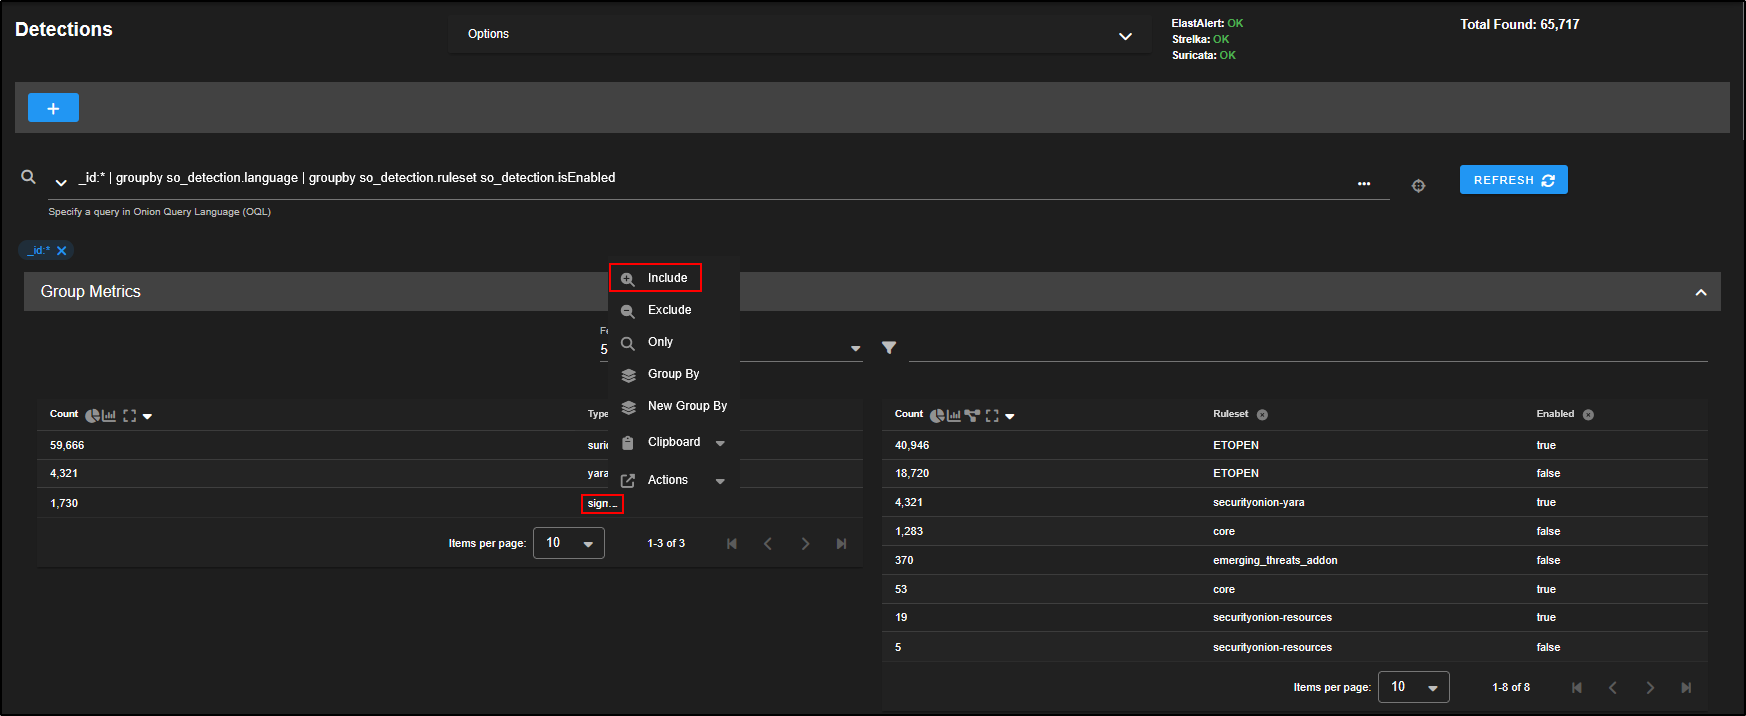
If you scroll down, you will see that the tables are fully interactive and can be used to adjust the query in the search bar.
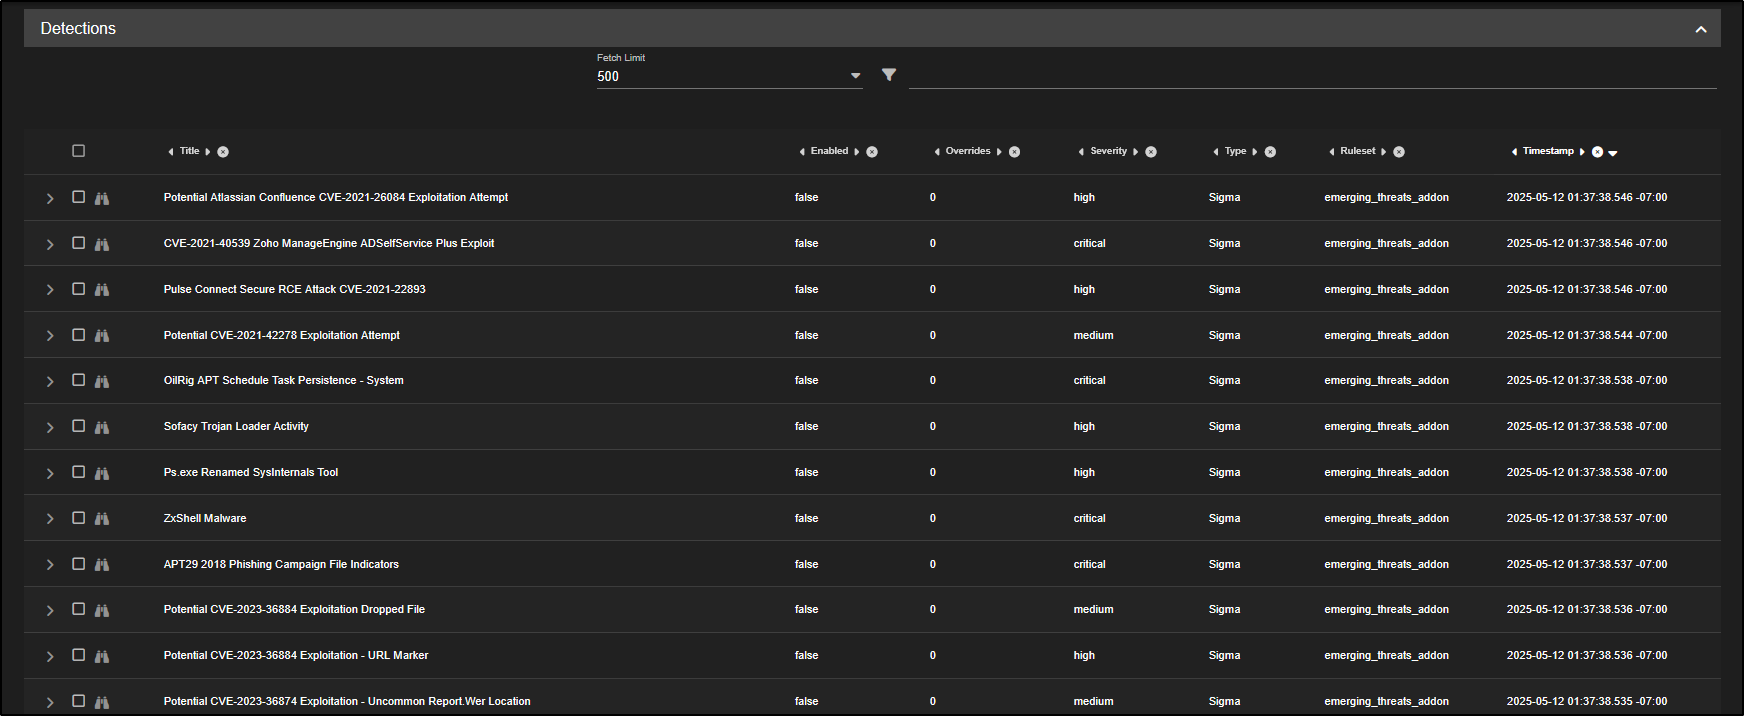
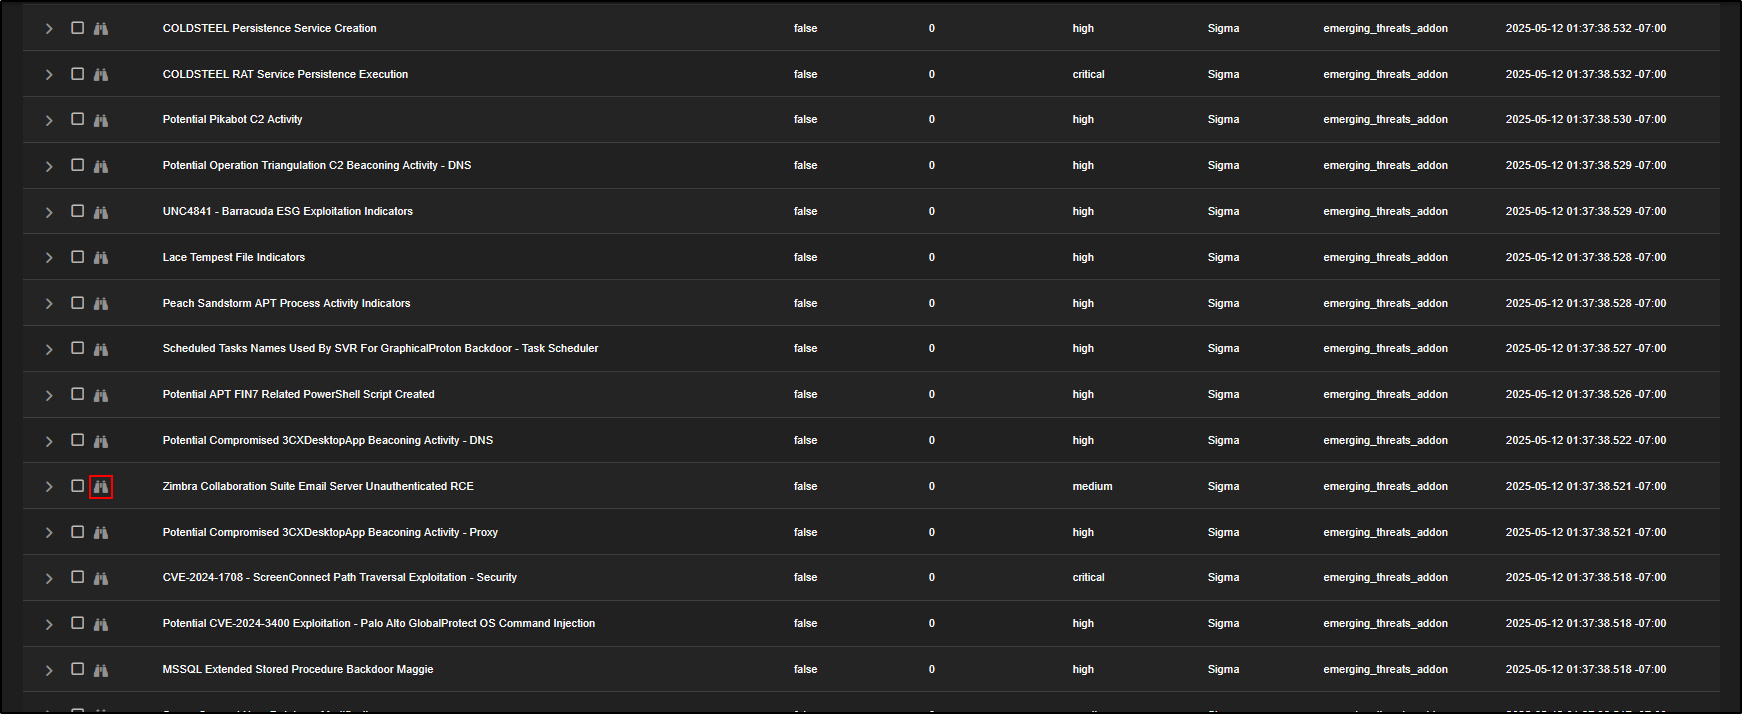
For instance, if you only want to view Sigma rules, simply click on sigma and choose Include. You will notice that the detection results and the list of enabled rules update to reflect that filter.
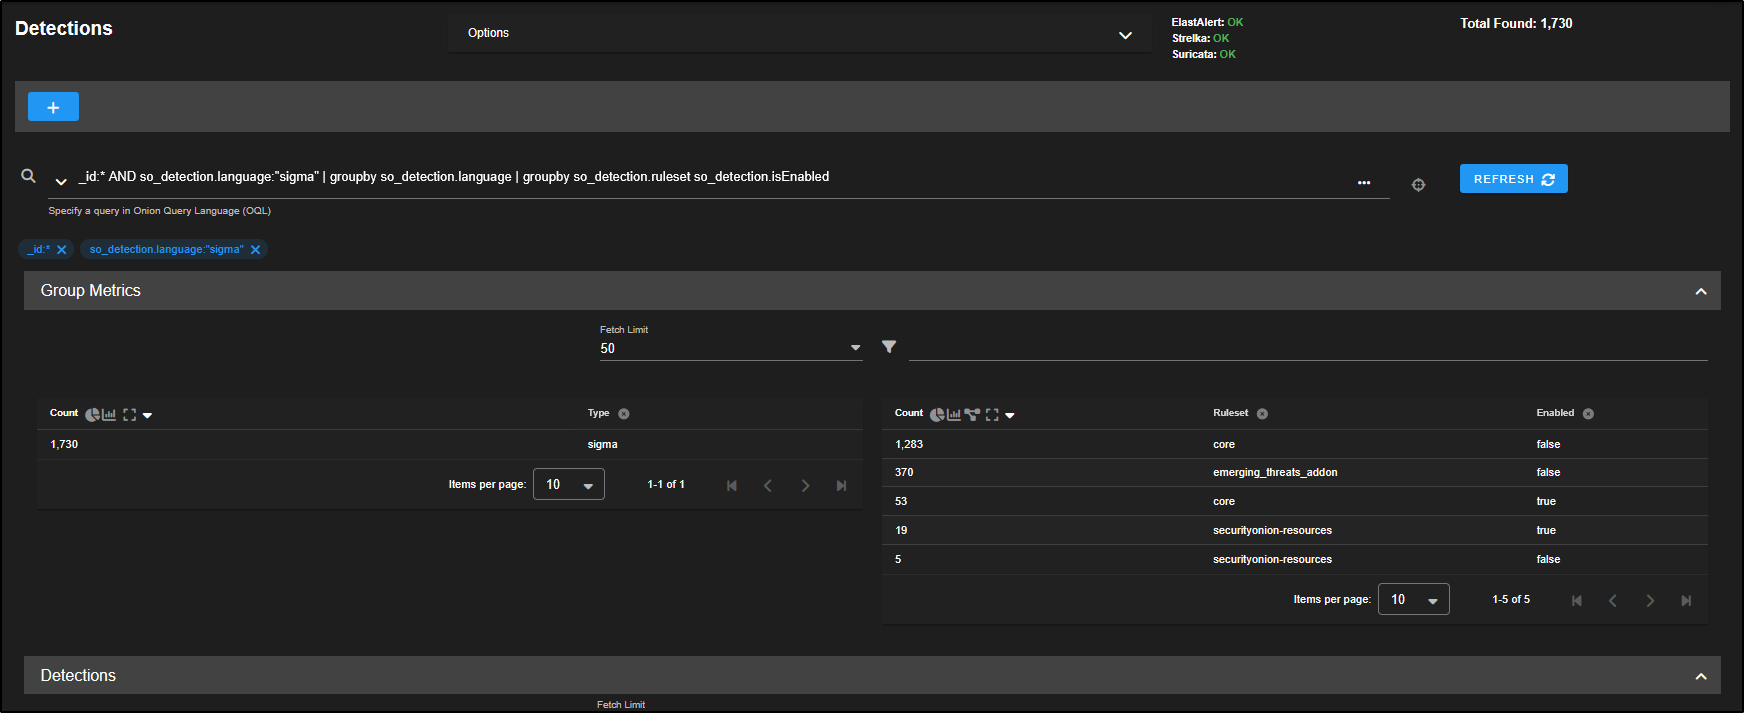
Most of the Sigma rules included with Security Onion are turned off by default. Each enabled rule runs an Elasticsearch query every few minutes, so enabling all of them could put heavy strain on the Grid and affect performance.
To inspect a rule more closely, click the binoculars icon next to its name.
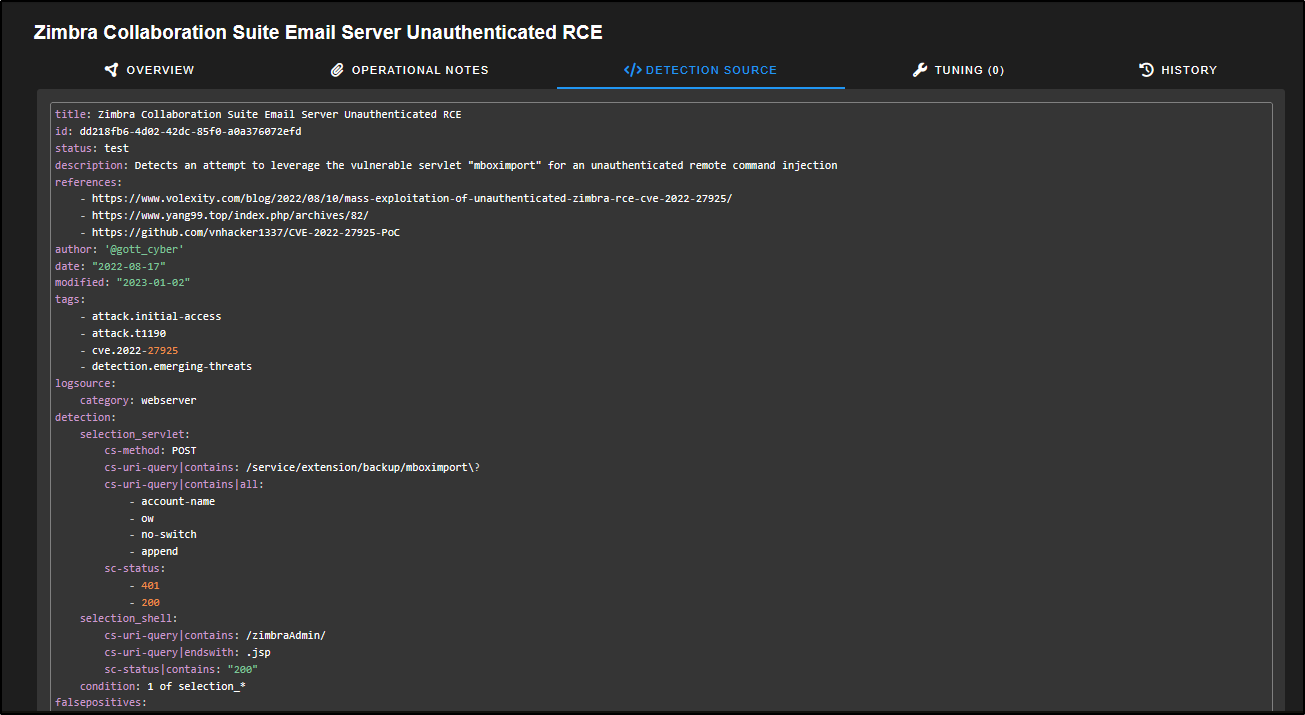
This opens the tuning interface for that specific rule. The Overview tab shows a summary of the rule, any related references, and the detection logic. In this example, the rule is set to trigger on POST requests to a web server that contain certain attributes. If those are detected, it may indicate an attempt to exploit an unauthenticated Remote Code Execution (RCE) vulnerability in the Zimbra Collaboration Suite and an alert will be generated.
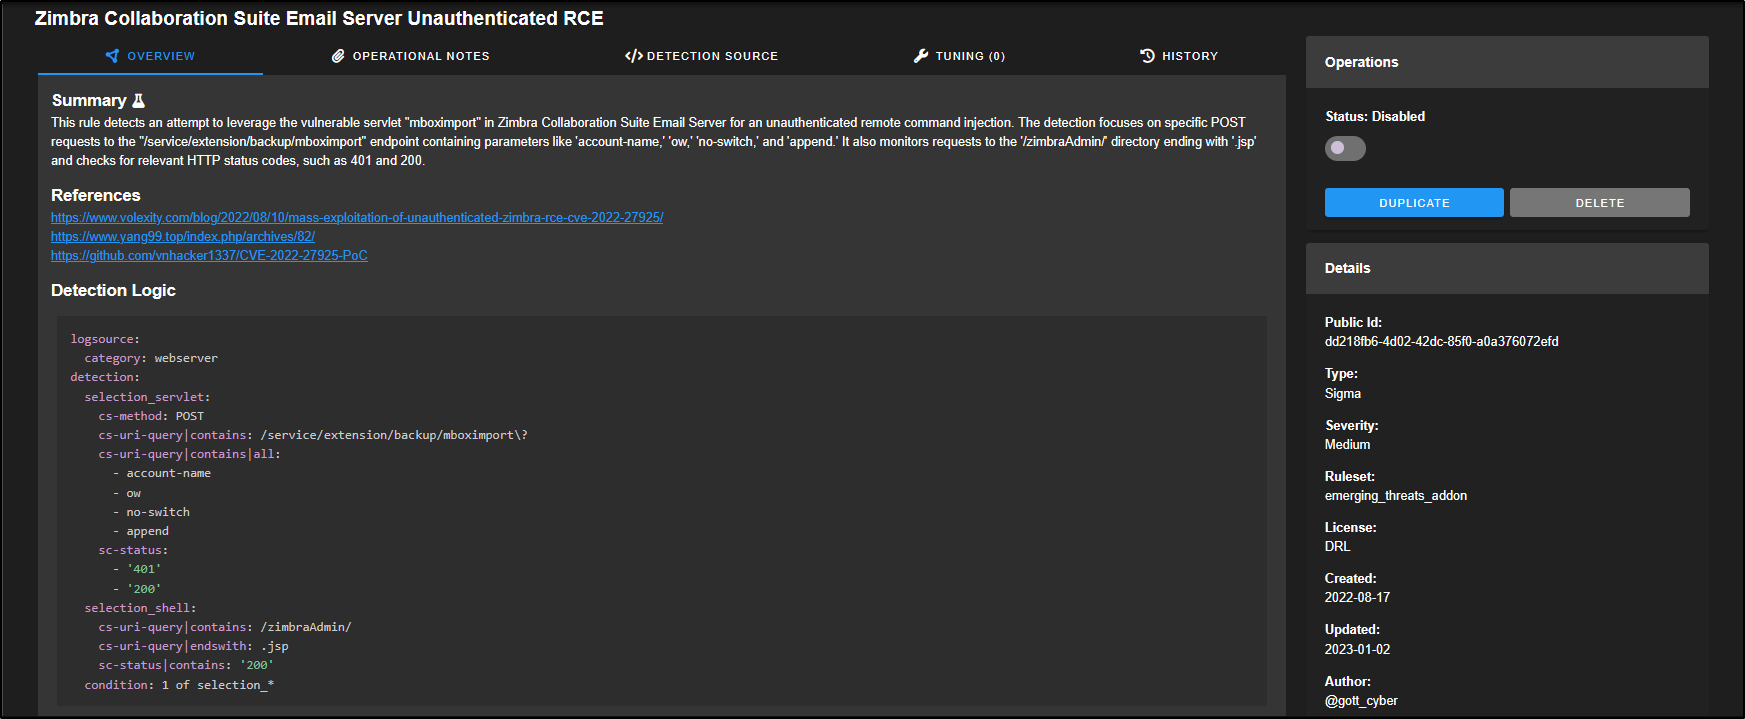
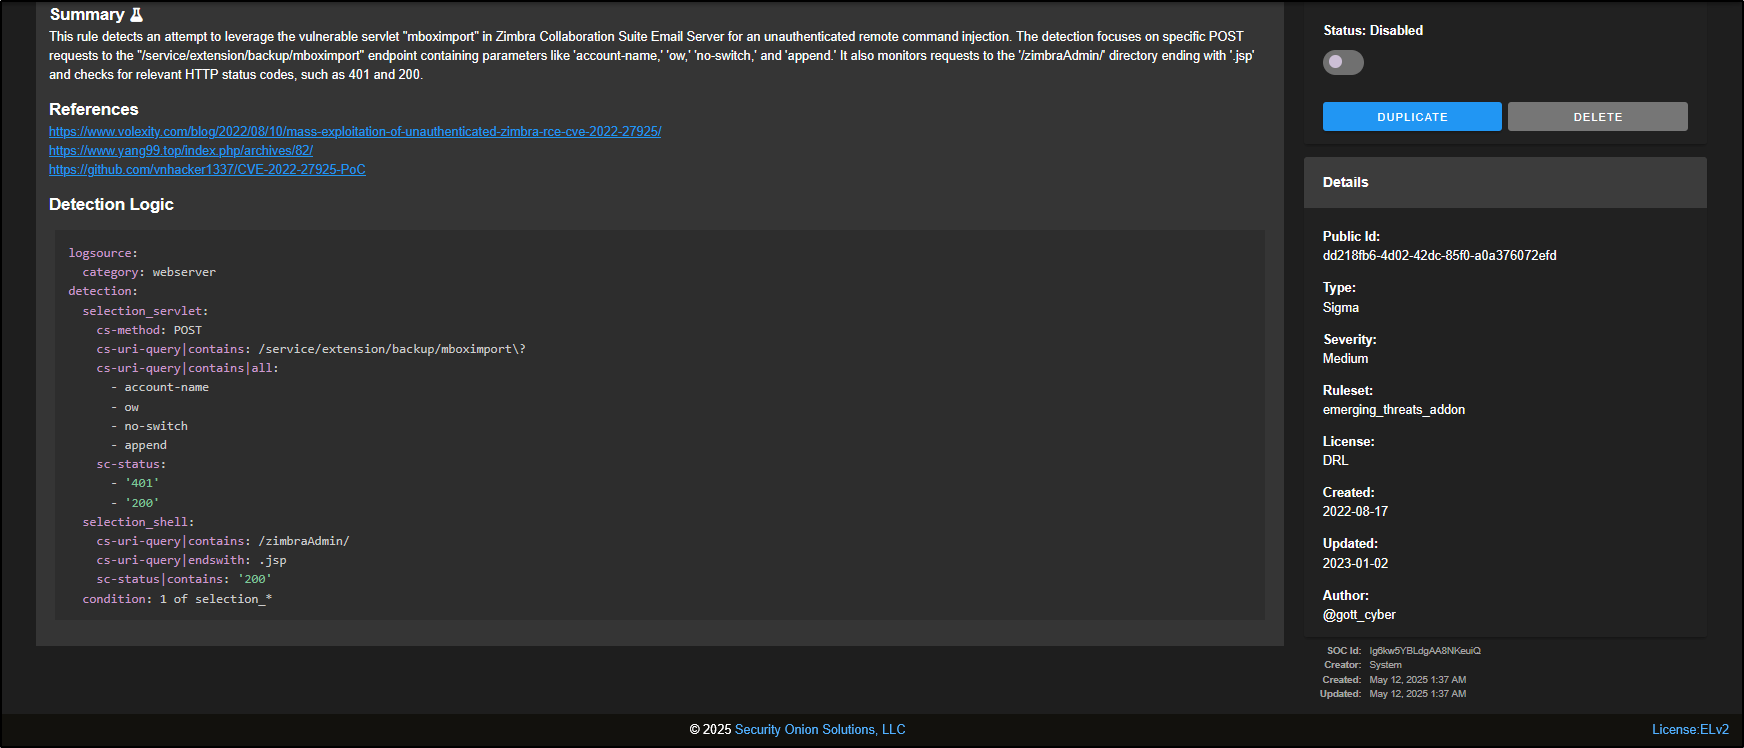
On the right-hand side of the window, you will find additional details about the rule. This includes its Public ID (a unique identifier used internally), the rule type, the ruleset it belongs to, its severity, the author, the license, and the dates it was created and last updated. At the top, there is a slider, which is currently set to Disabled. You can click the slider to enable the rule.
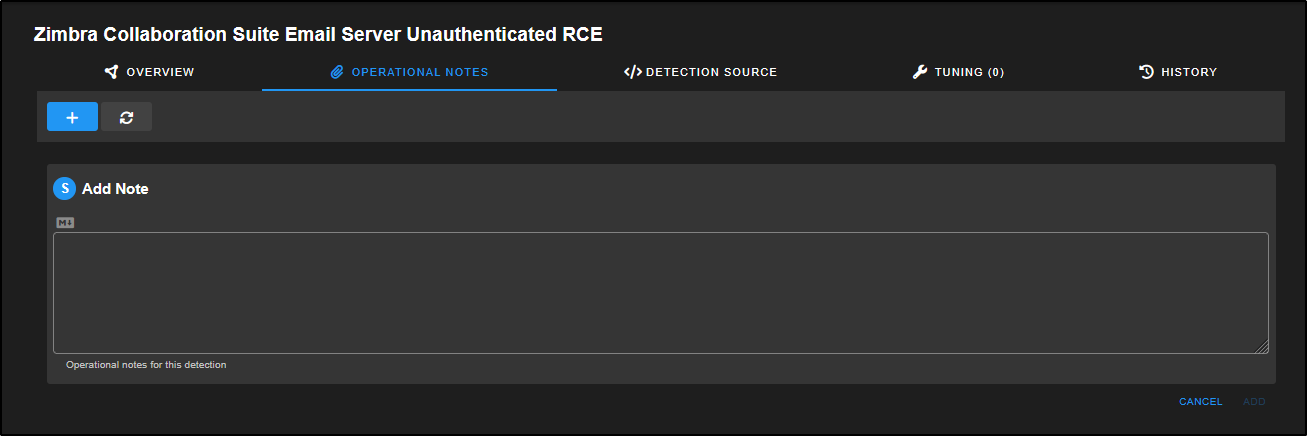
The Operational Notes tab gives analysts a place to record notes about the rule, including any tuning they have applied and how effective the rule has been in their environment.
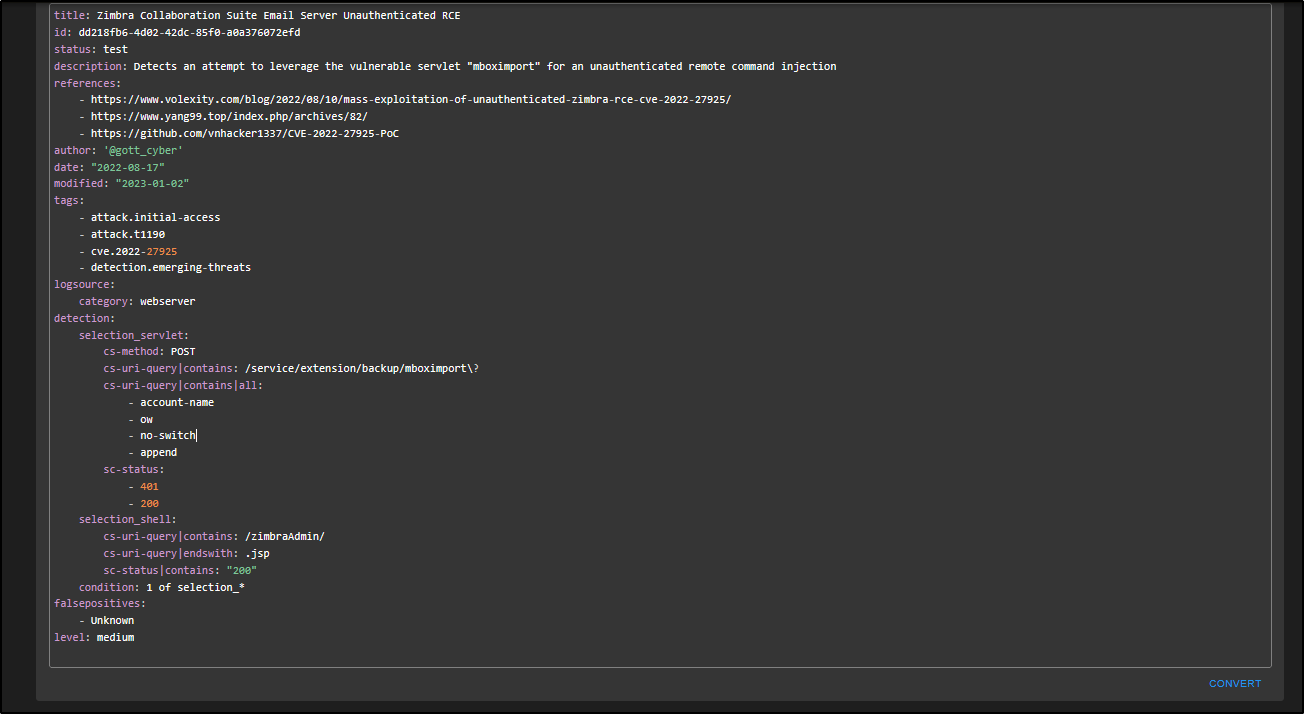
The Detection Source tab displays the complete Sigma rule text, including details not shown on the Overview page, such as possible false positives and the MITRE ATT&CK technique IDs that the rule maps to.
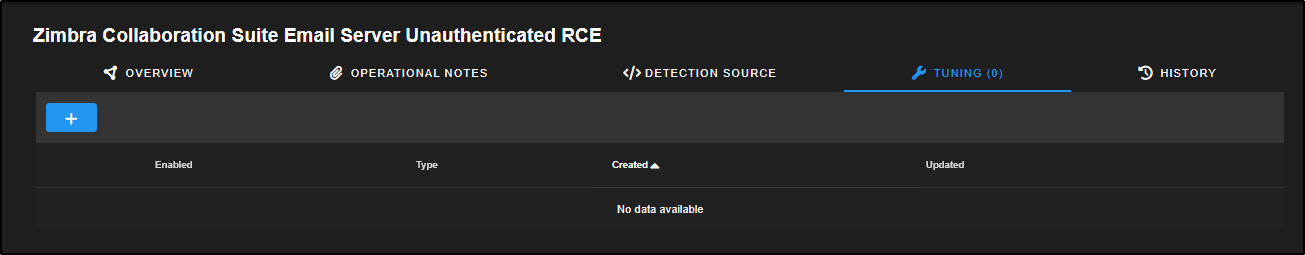
The Tuning tab gives you a tailored interface for adjusting each rule type to better suit your environment. For instance, Suricata rules can be suppressed or have thresholds set, while Sigma rules can be fine-tuned using Sigma filters.
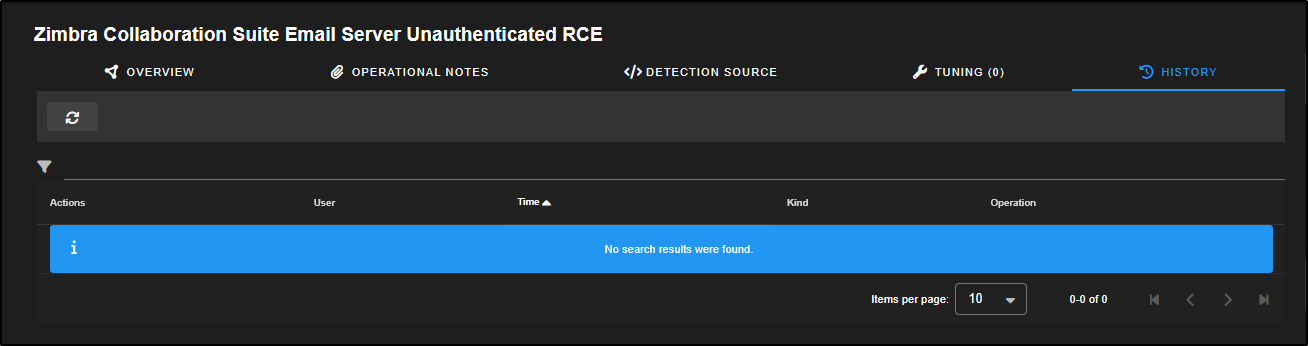
The History tab gives you a full audit trail of any changes made to the rule since it was first brought into your Security Onion setup.
Let’s walk through a Detection Engineering scenario. You have found a gap in your current detections and you want to be alerted whenever a local user account is created on a Windows machine.
Since your organisation uses Active Directory, the policy is that all accounts should be created through AD. So if a local account appears, it could mean:
- Someone is not following the policy,
- A misconfigured app has created it, or
- An attacker is trying to set up persistence.
Whatever the cause, you want to know about it.
The Windows Event ID 4720 is triggered when a new local account is created. That is the event you will use to detect this behaviour.
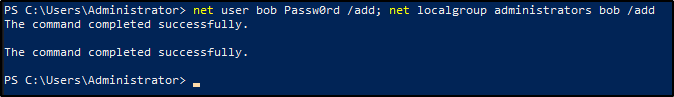
To simulate this, we will create a local administrator account on the Windows Server VM using the following command:
Go to the Detections page in the SOC web interface.
Click on the plus icon to create a new rule and add it to your detection setup.
This is where you will define the rule that alerts on the creation of local user accounts.
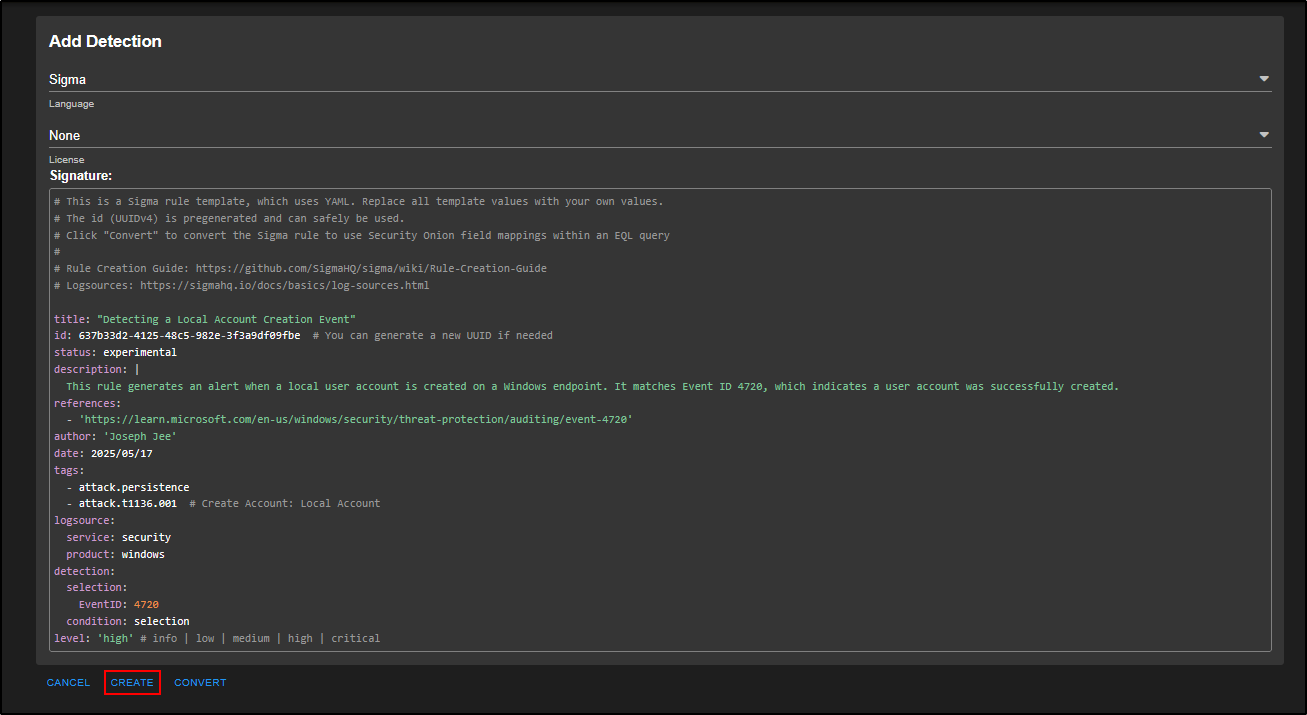
In the Add Detection window, choose Sigma from the drop-down menu. This is the best option since we’re creating a rule based on a log entry (Event ID 4720).
Set the License field to None.
You will see a pre-filled Sigma template which outlines all the key fields like title, ID, log source, detection condition, etc. The URLs at the top link to guides that help you write proper Sigma rules: Sigma Rule Creation Guide and Logsources Reference.
Replace the template with the following custom rule:
# This is a Sigma rule template, which uses YAML. Replace all template values with your own values.
# The id (UUIDv4) is pregenerated and can safely be used.
# Click "Convert" to convert the Sigma rule to use Security Onion field mappings within an EQL query
#
# Rule Creation Guide: https://github.com/SigmaHQ/sigma/wiki/Rule-Creation-Guide
# Logsources: https://sigmahq.io/docs/basics/log-sources.html

title: "Detecting a Local Account Creation Event"
id: 637b33d2-4125-48c5-982e-3f3a9df09fbe  # You can generate a new UUID if needed
status: experimental
description: |
  This rule generates an alert when a local user account is created on a Windows endpoint. It matches Event ID 4720, which indicates a user account was successfully created.
references:
  - 'https://learn.microsoft.com/en-us/windows/security/threat-protection/auditing/event-4720'
author: 'put your name here'
date: 2025/05/17
tags:
  - attack.persistence
  - attack.t1136.001  # Create Account: Local Account
logsource:
  service: security
  product: windows
detection:
  selection:
    EventID: 4720
  condition: selection
level: 'high' # info | low | medium | high | critical
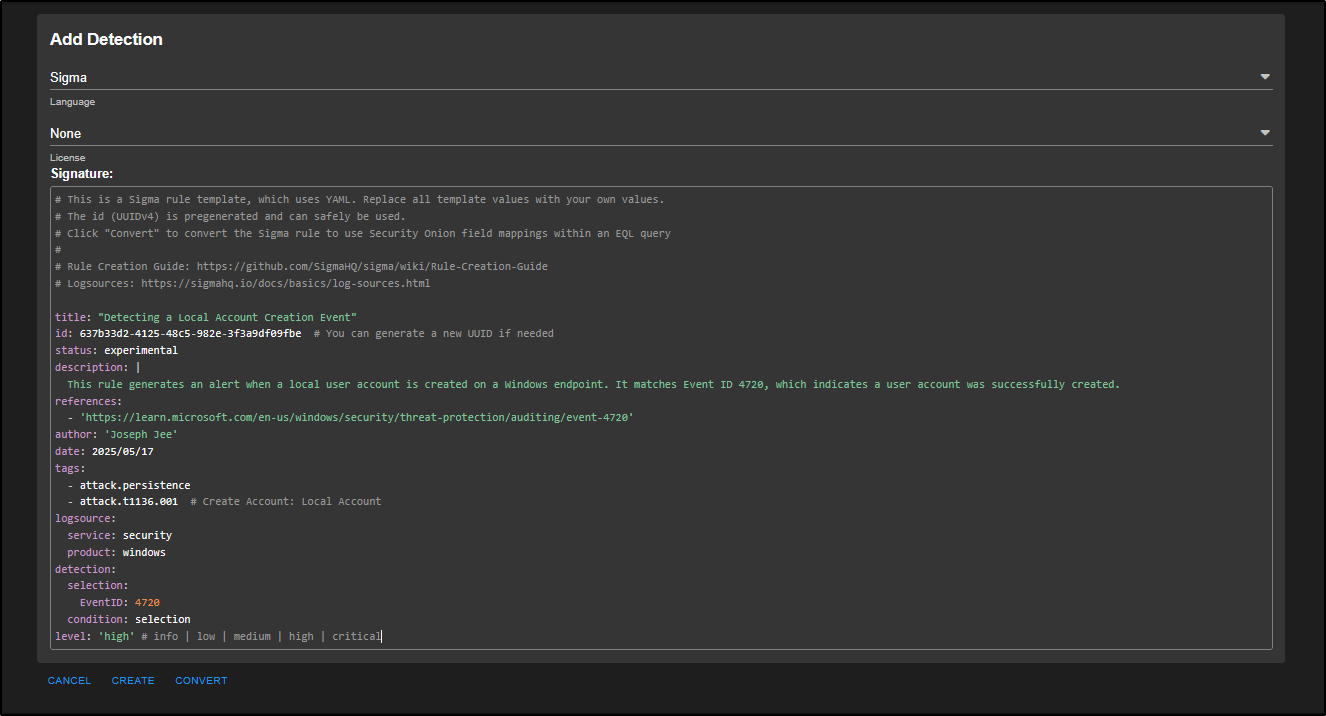
In a Sigma rule, the first section contains metadata such as the title, description, references, and tags. It is best to fill these out properly to help both yourself and other analysts who might investigate this alert later.
In this example:
- The reference is a link to the official Microsoft documentation about Event ID 4720.
- If you have an internal SOP or playbook related to handling this alert, you can include that too.
- The tags align with the MITRE ATT&CK framework. Creating a local account is a persistence tactic, and is listed under T1136.001.
The logsource tells Security Onion where to look. In this case, the Windows Security Event log. It’s important to get this right so the rule runs against the right type of log data.
The detection section says: if there is an event with Event ID 4720, trigger an alert.
The level defines how serious the alert is. It is set to high by default but you can adjust it to match your environment.
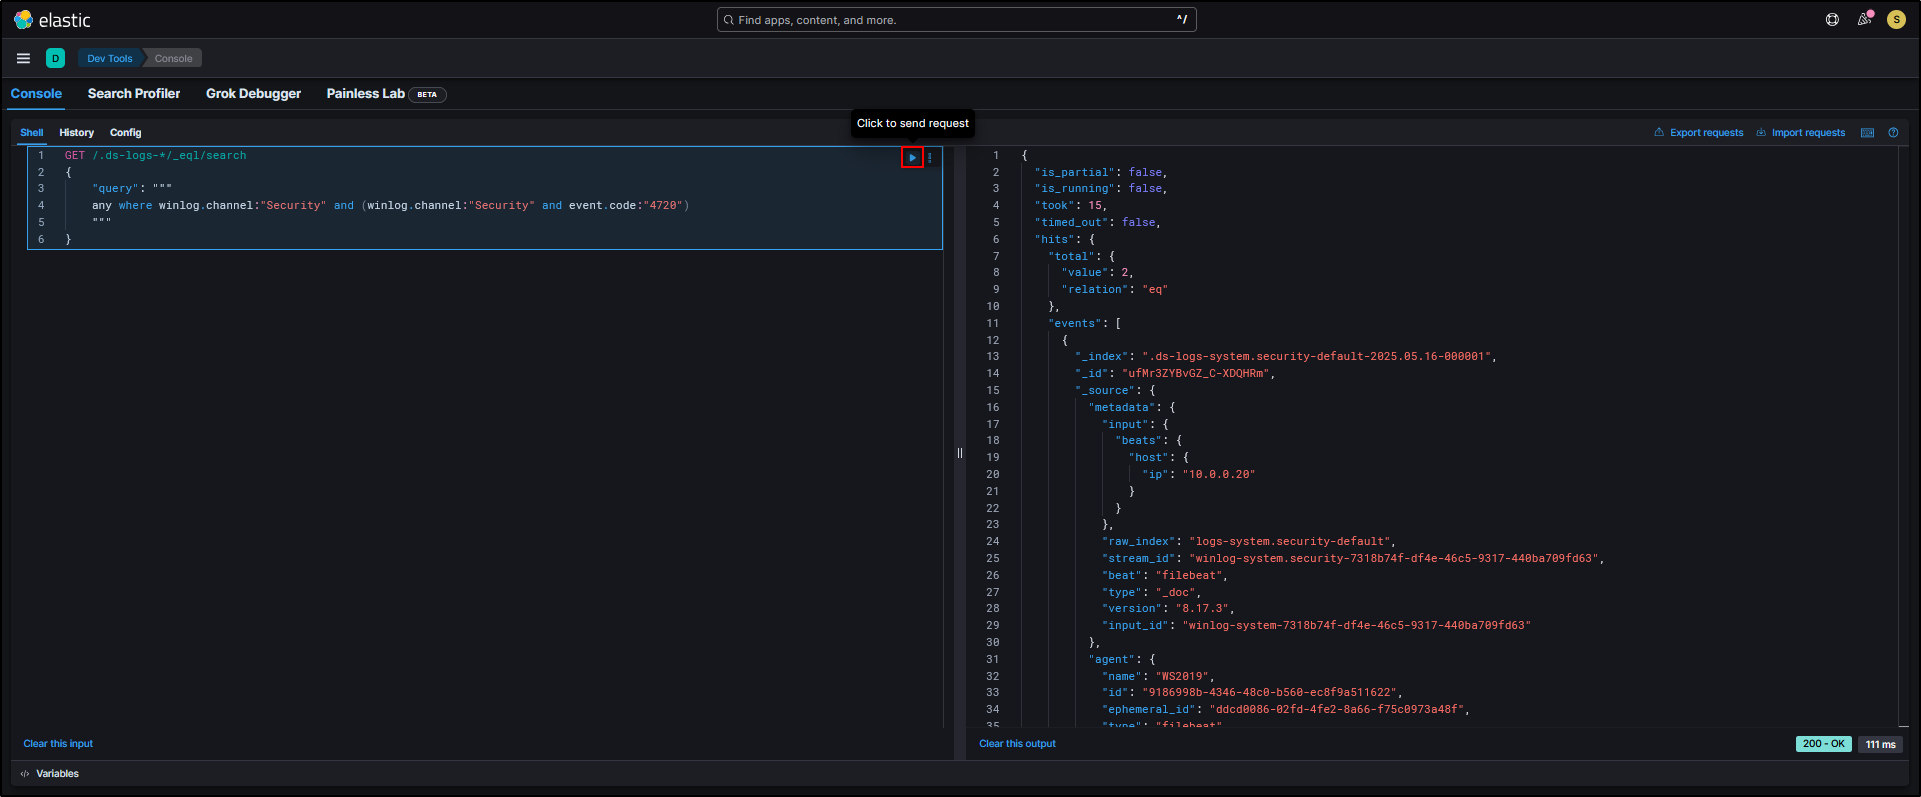
Note: the Sigma rule itself does not run directly. It gets converted into an EQL (Elasticsearch Query Language) query and that is what actually runs in the backend.
To see this:
- Click Convert to preview the EQL version.
- To test it live, click Test in Kibana. This will open the query in Kibana Dev Tools and return any matching results.
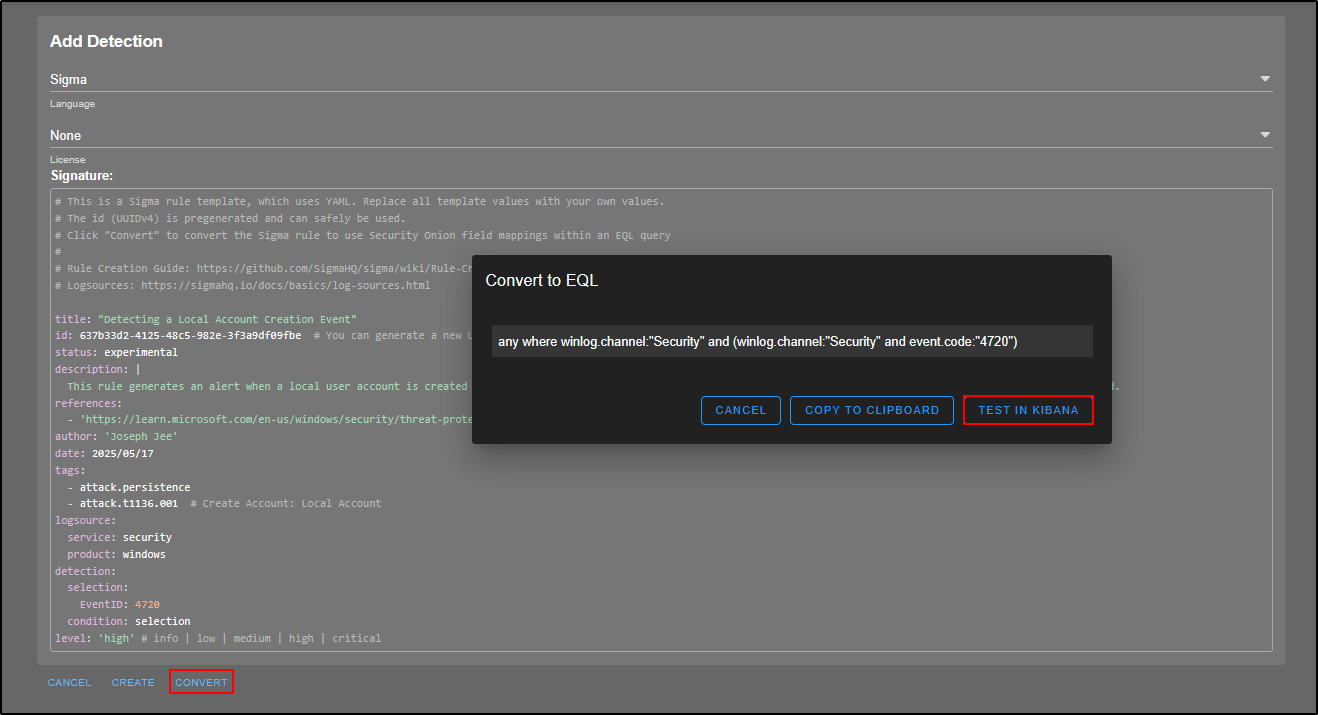
The query appears on the left-hand side, and when you click the play button, any matching events will be displayed on the right.
Even if you are not planning to test the query straight away, it is still a good idea to do the conversion step to make sure everything looks correct, especially for more complex detection rules.
Everything looks fine here, so go ahead and click Create to add the Sigma rule to our list of detections.
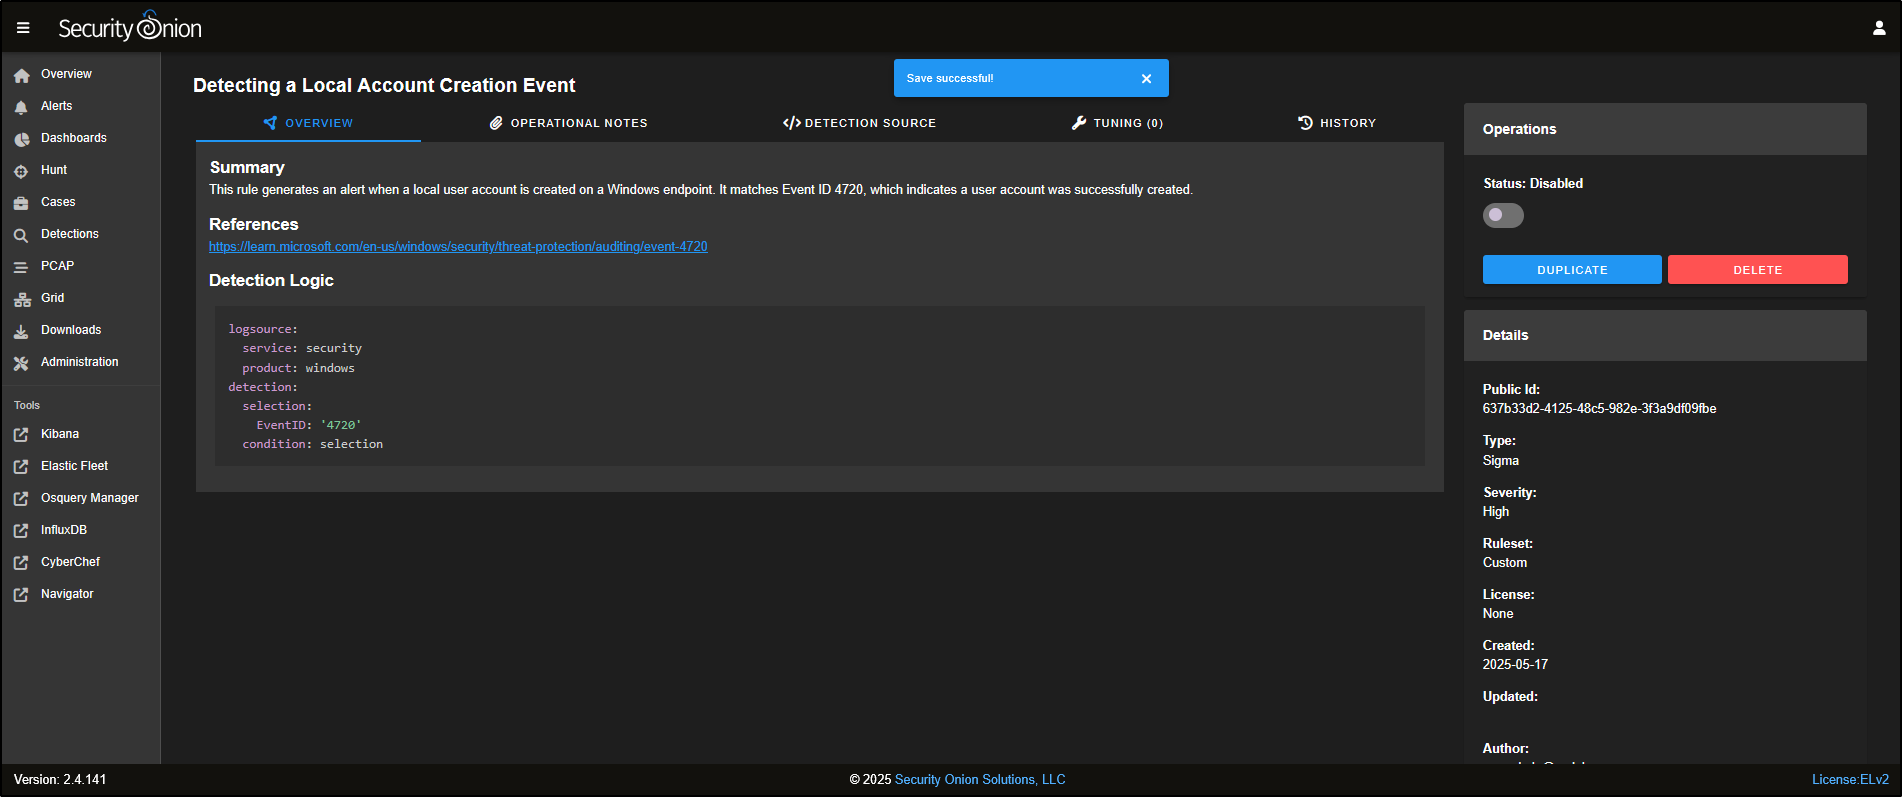
The rule is not enabled by default, but if you want to activate it, just click the slider to turn it on.
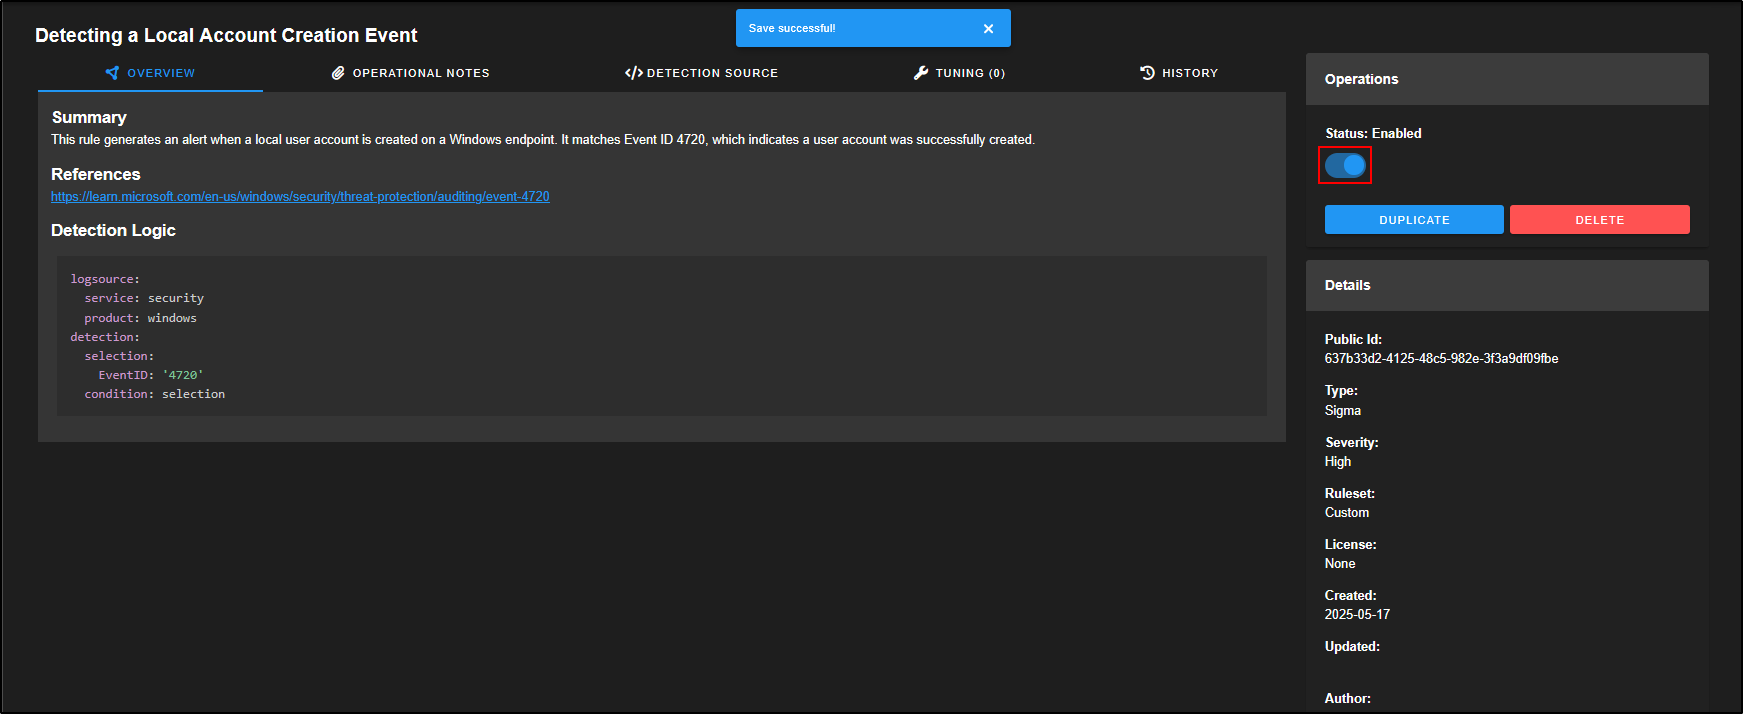
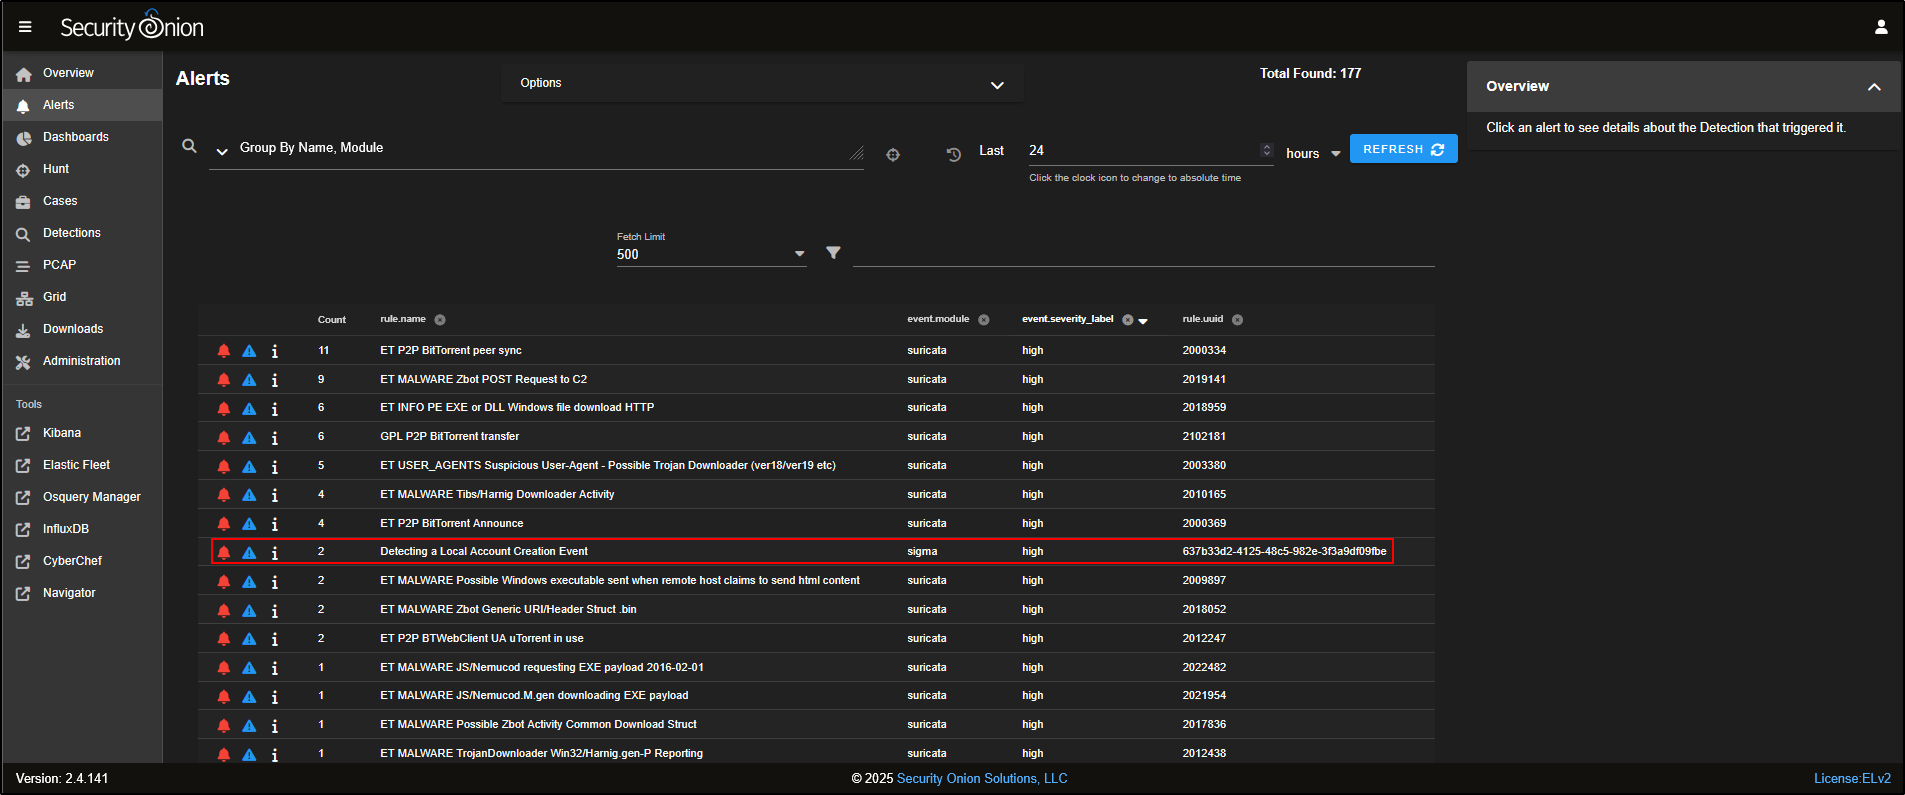
Now that the rule is active, any time a Windows Event ID 4720 is logged, which indicates a new local user account was created, we will receive an alert.
To test this, a local admin account named joe was created on the Windows Server VM using:
Head to the Alerts page in the SOC web interface. You should see an alert confirming that the rule successfully triggered based on this activity.
Start by identifying a detection gap (something your current setup is not alerting on but should be). Next, determine what logs or events you will need to collect to detect that activity. Once the necessary data is being ingested, write a detection rule using one of the supported rule languages (Suricata, YARA, or Sigma) in the Detections section of Security Onion. Finally, deploy the rule, test it to make sure it works as expected, and tune it to reduce false positives and ensure it fits your environment.
References
- https://docs.securityonion.net/en/2.4/
- https://youtu.be/Jb_sb_vLrB0?si=yTvJcF0TiHFUYfZt
- https://youtu.be/-6B04sZPdz4?si=MsMTW89rSw5Xfl39
- https://youtu.be/i9hxtIHwlQI?si=HMuiwdQlZgnDbHVu
- https://youtu.be/j0uWmqvYSrI?si=gnurOgxNyI-YsmxJ
- https://youtu.be/L1H7UoDoUY8?si=HSNe6HhhHX3ikjAc
- https://youtu.be/Tv8uis-ocjQ?si=OVLGlLLuX_Kb8EUM
- https://youtu.be/OQt0lvpvkr8?si=6-swKUUfLhEzOwSx